The Euro
And just like that, 2022 is coming to an end. I wish every reader all the best for the remainder of 2022 and into 2023. Thank you to everyone that I’ve had positive interactions with throughout the year.
December is a great time to plan next year’s goals and objectives. It’s worth taking your time and using the month to prepare. I’ve been undertaking a process of listing my strengths and weaknesses and then making a plan to improve both.
One weakness I have, is setting time aside to read, mainly because I’m a slow reader. I counter this with Audio books. One book I’ve enjoyed recently is ‘Zero Negativity’ by Ant Middleton.
A theme throughout is his message for complete honesty with yourself and to continue to learn about yourself. If you find you can’t pull the trigger on a trade, or you over trade or find yourself having a series of losing trades, what is the real problem? It’s all within us.
For my final article for the year, I want to take you through a recent trade setup on the Euro which continues the theme of how the 200% milestone can be part of a great trading plan.
Anyone with the Ultimate Gann Course can see this setup as I wrote about it in a recent Platinum Article. However, I wanted to make sure it goes out to this audience as well!
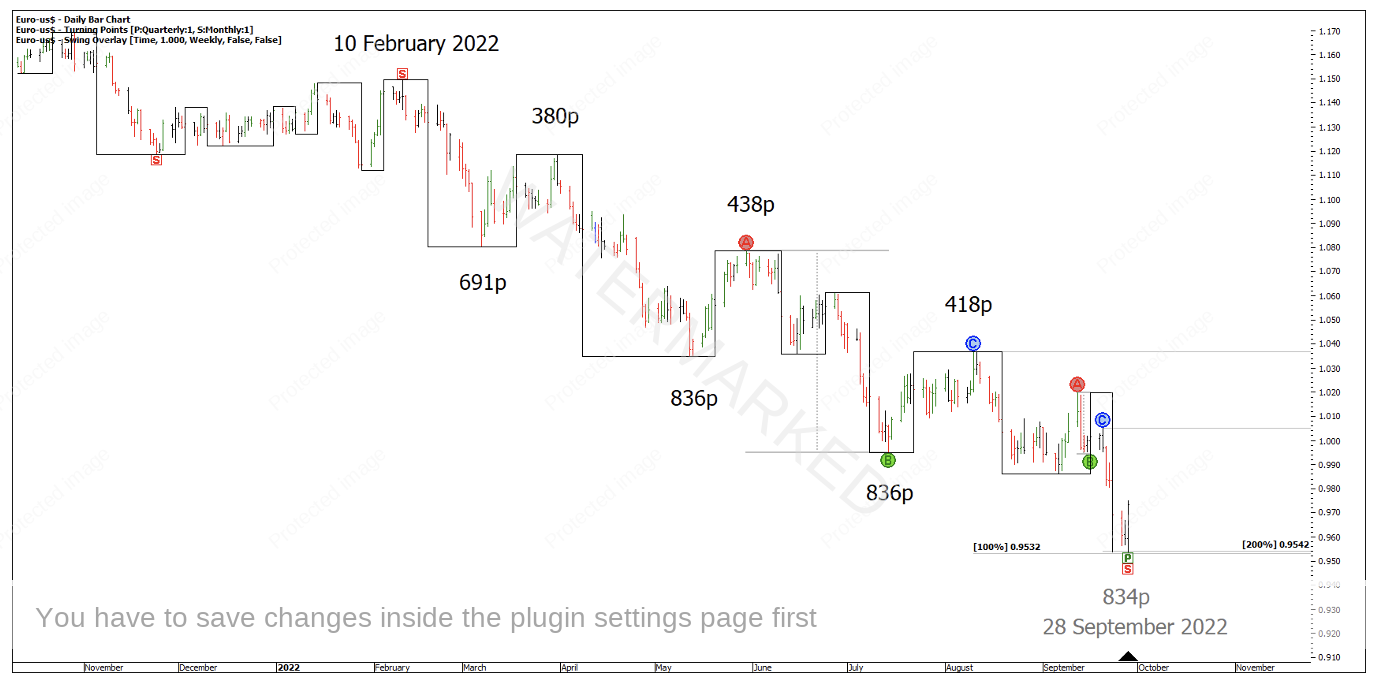
There was a great cluster on the Euro with 200% of the last daily swing giving a price target of 0.9542 and 100% of a previous section giving a price target of 0.9532.
Chart 1 – Euro Price Cluster
If you’re wondering why I have the bigger ABC milestones as they are, the answer is in Chapter 2 of How to Make Profits in Commodities or in more detail in the Ultimate Gann Course.
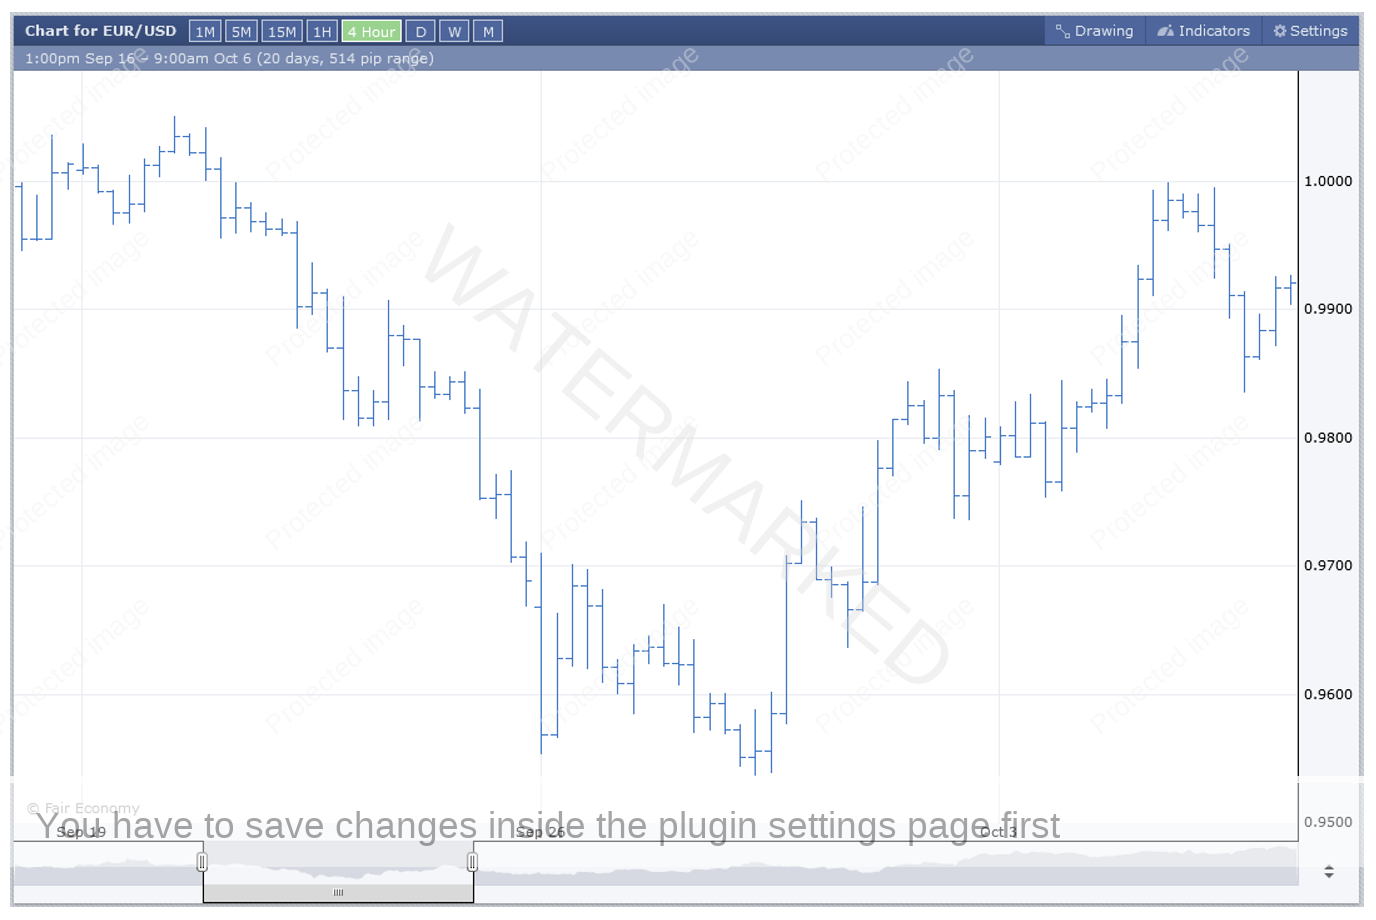
How many more parts to this cluster can you find? Can you drop down to a 4-hour swing chart and look for extra pieces?
Chart 2 – 4 Hour Bar Chart
The above 4-hour bar chart is from forexfactory.com. Take your time to look at the low to identify as many aspects as possible that would help you form-read the low. You could also look at the last 4-hour swing down on a 1-hour time frame and measure the price ranges.
How could we have entered this trade setup?
Scenario 1
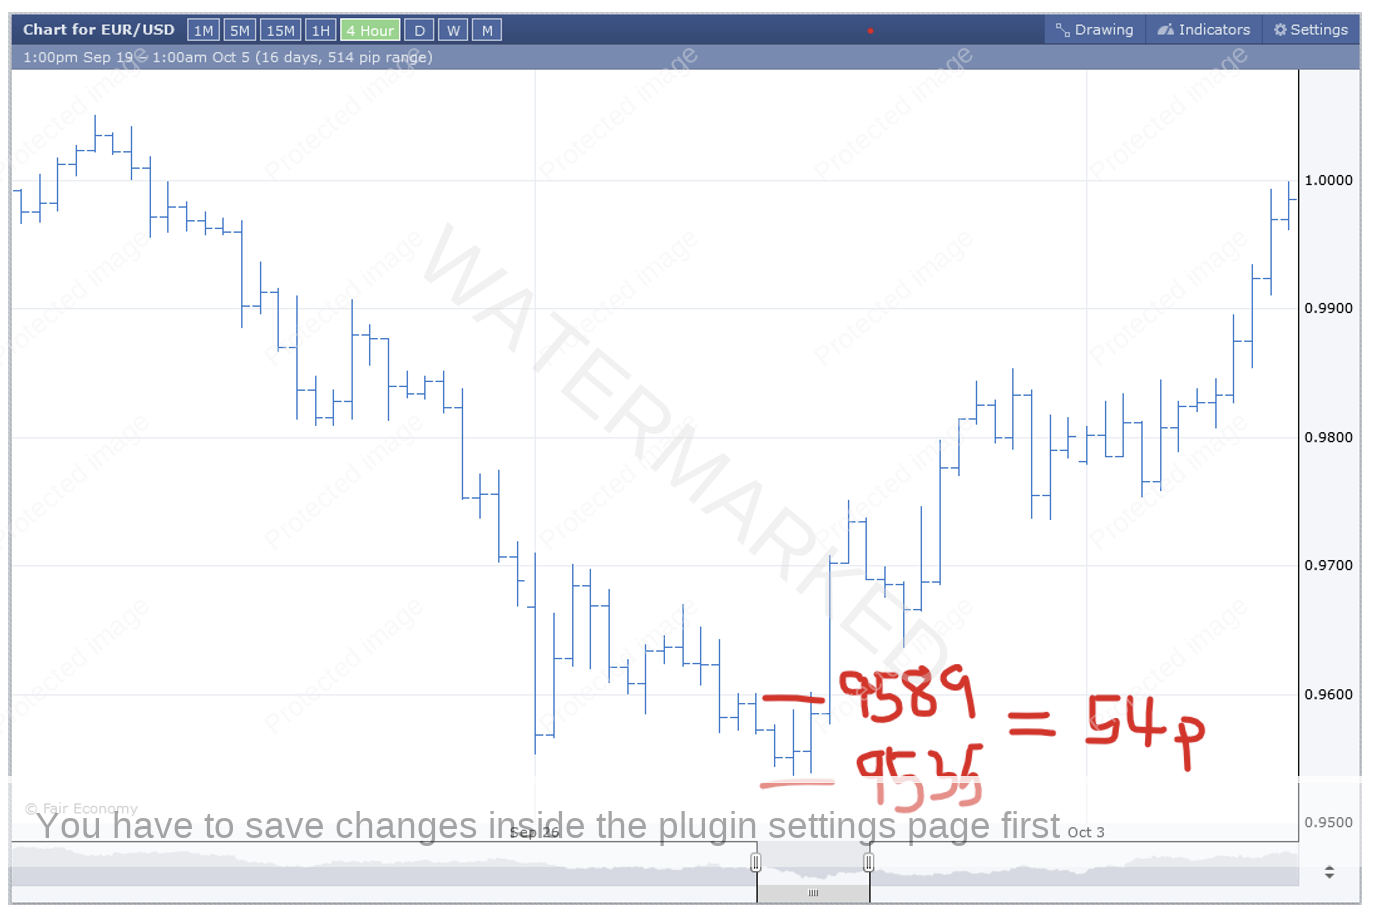
- Entry type: Enter as the swing chart turns up after the small double bottoms at 0.9589
- Exit stop at 0.9535 (Note the slight variation in price with ProfitSource and Forex Factory)
- Total Risk = 54 points
Chart 3 – Entry as the Swing Chart Turns
Scenario 2
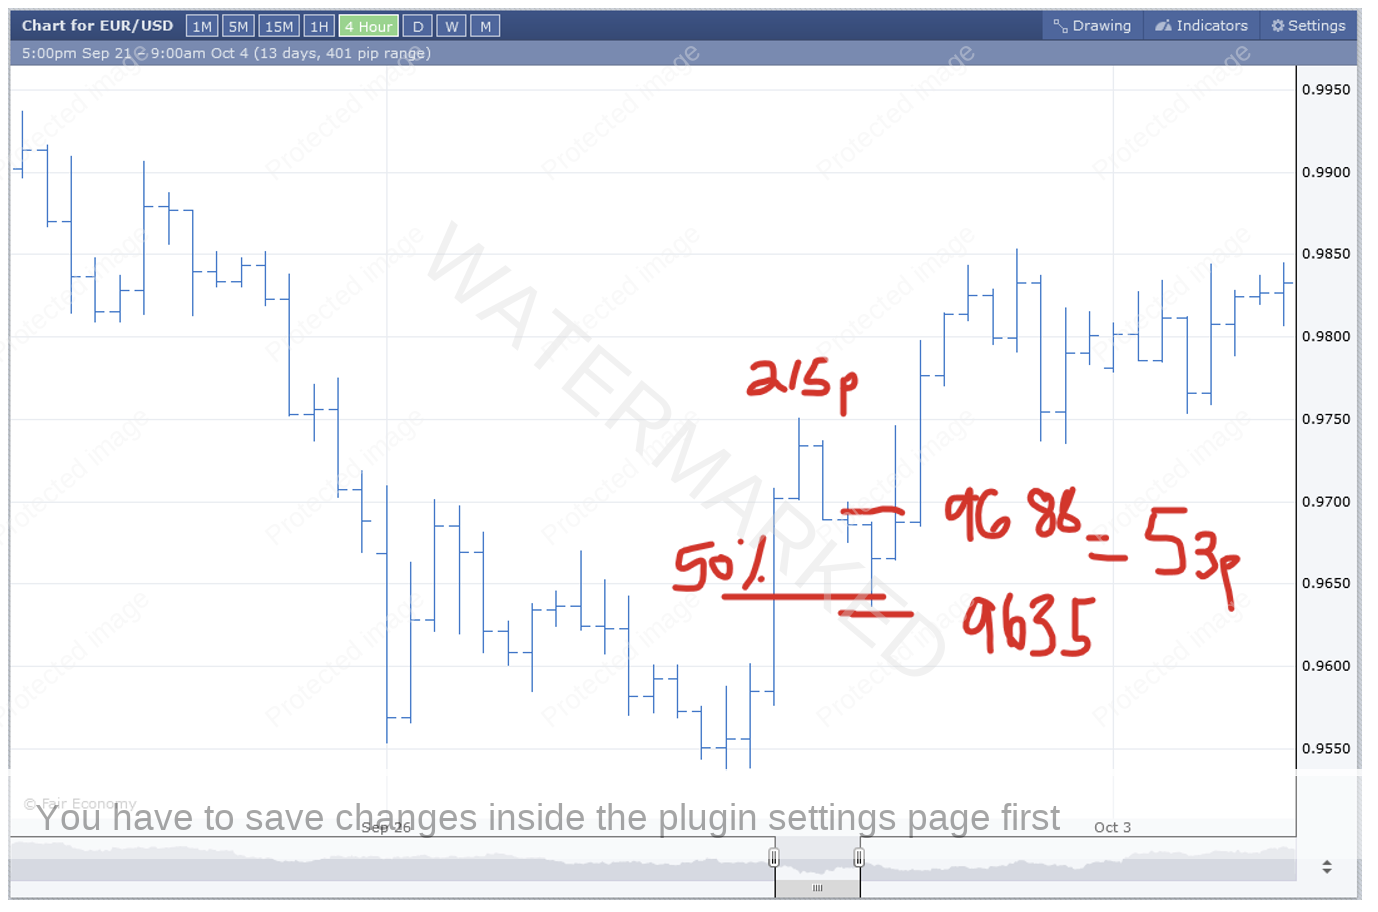
After the Overbalance in Price on the 4-hour swing chart of 215 points, the Euro had a neat 50% retracement (just through) and presented another potential entry strategy.
- Entry at 0.9688 confirmed First Higher Swing Bottom
- Exit stop at 0.9635
- Risk = 53 points
Chart 4 – Entry as the First Higher Swing Bottom Confirmed
Now with a couple of entry scenarios underway, I will leave it up to you to go back and see how you would have managed either your trailing stop or exit strategy according to your own personality.
Chart 5 – Weekly Swing Overlay
A thought worth considering is, if you believe you are trading a monthly swing turn and you want to take a good portion of the run, you expect to sit through some of the weekly pull backs which is when you may find the strongest emotion kicks in.
Looking at the above chart you can see after a week this trade was in good profit. A week later you were nearly back to break even. 2 weeks later you are back in good profit, only to see it reduce a week after that. So that’s 5 weeks before the market takes off again.
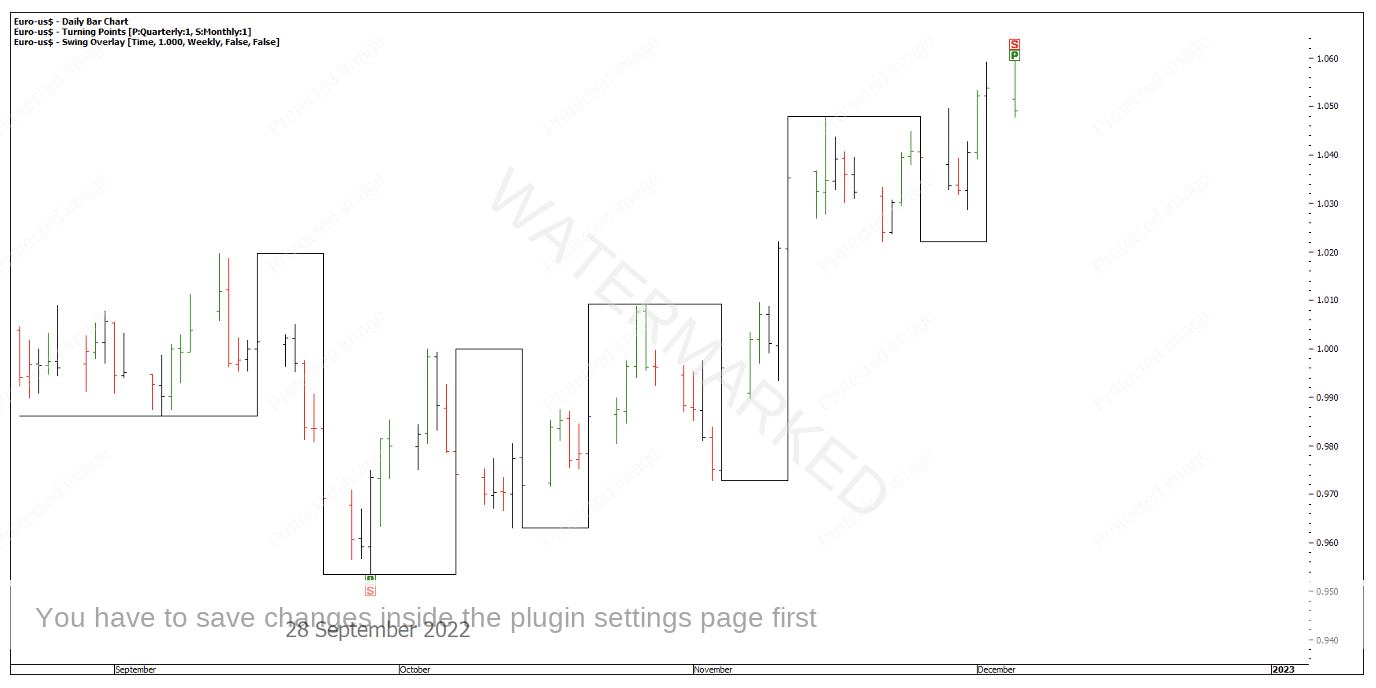
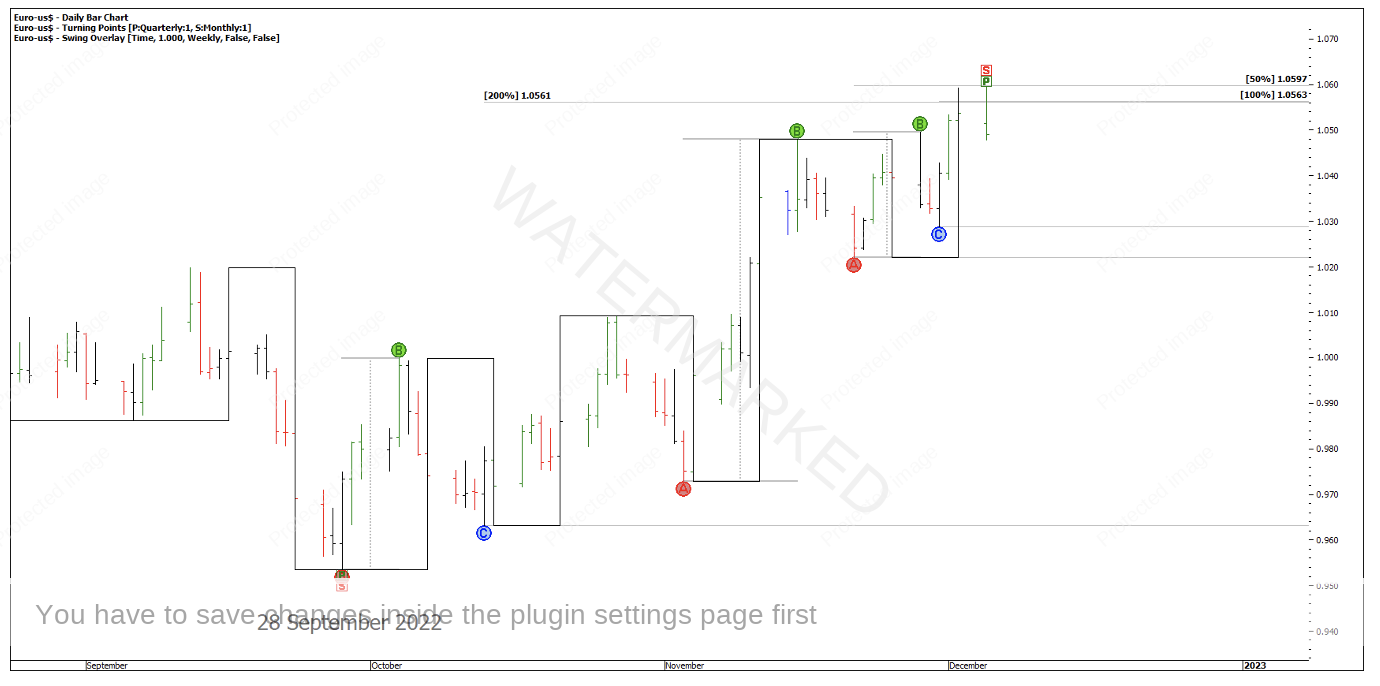
As I write this, the Euro is at another interesting point with a signal bar on 200% of the weekly First Range Out. If this market pulls back from here it might be setting up for a monthly ABC pattern to form and we could look for a possible cluster to form at Point C. However, we should always stay prepared for any scenario to unfold and any potential high quality trading opportunities.
Chart 6 – 200% of the Weekly First Range Out
See you all in 2023 to see how some of these recent trade setups have unfolded. I hope it will be your best year yet!
Happy Trading
Gus Hingeley
