First Range Out
Welcome back and a happy new year to all of our dedicated readers! To start the year off, this month’s article will take a look back on the price history of the Origin Energy stock (ORG:ASX). In particular we’ll be examining the application of the price analysis technique that we call First Range Out (FRO).
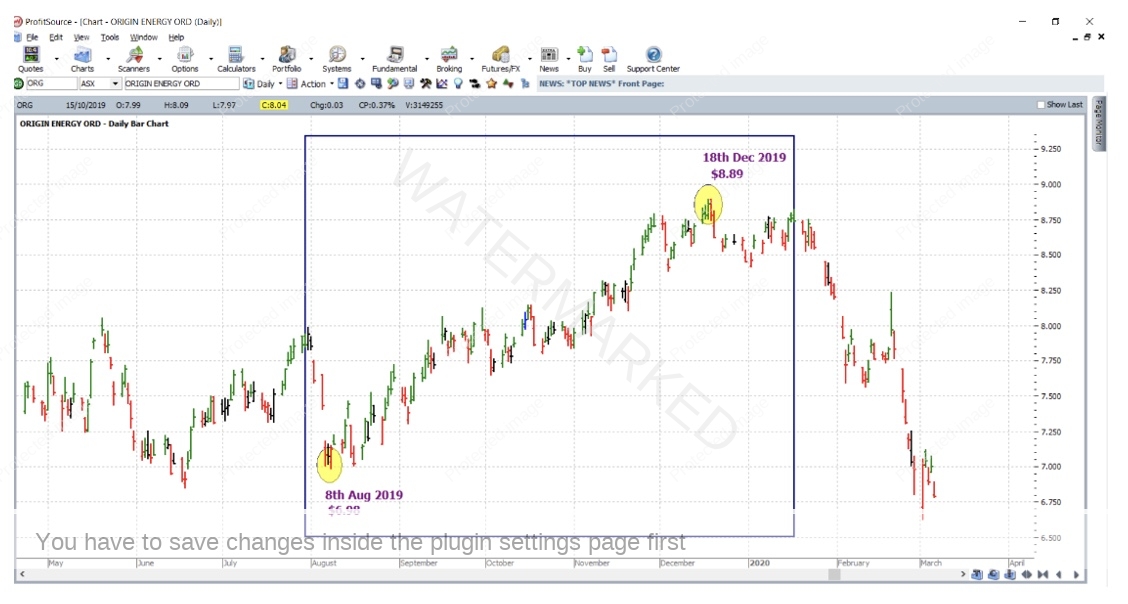
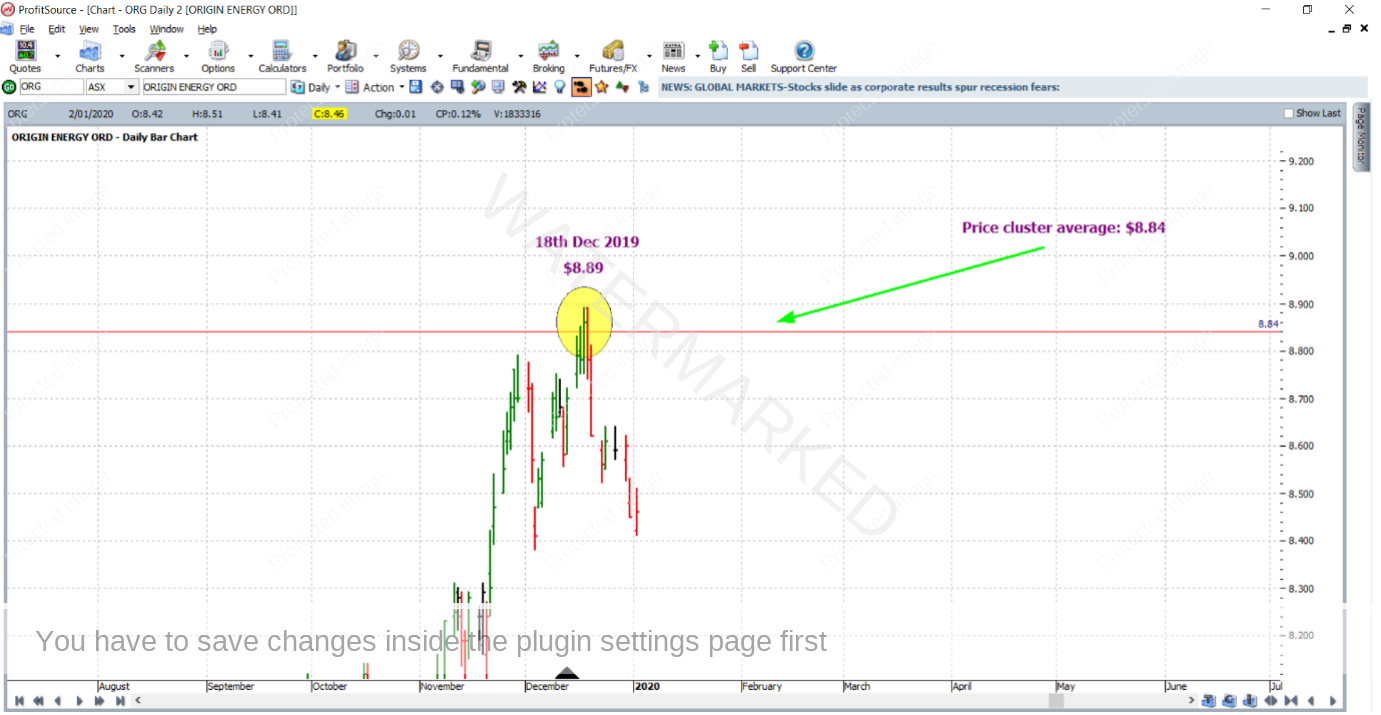
First of all let’s focus our attention on a particular section of market from the year 2019 – in particular the bull market from the 8 August 2019 low ($6.98) to the 18 December 2019 high ($8.89). This is shown below in a screenshot from ProfitSource, the chart code of course being ORG.
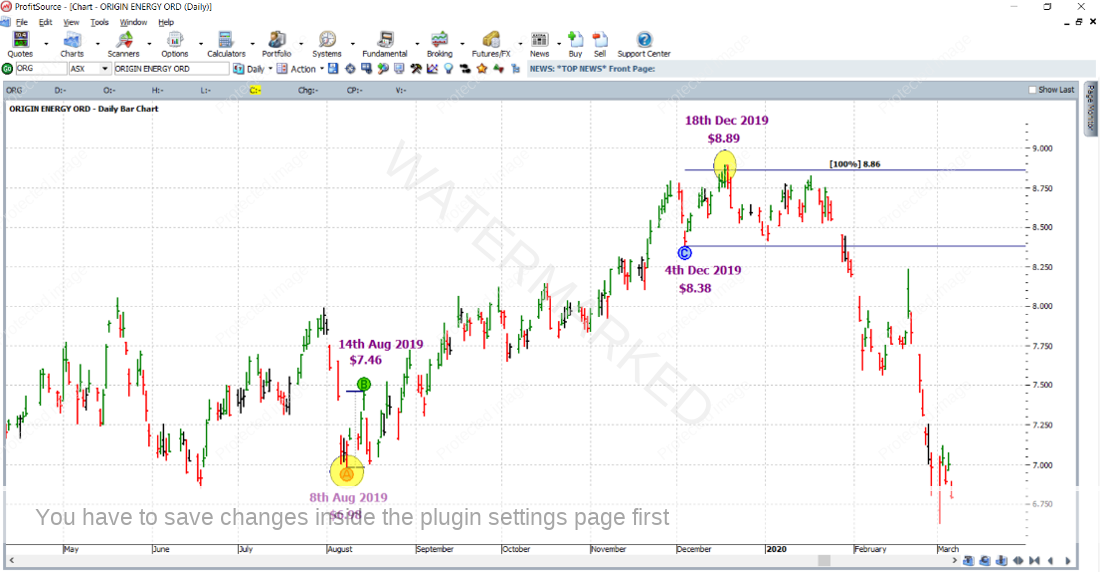
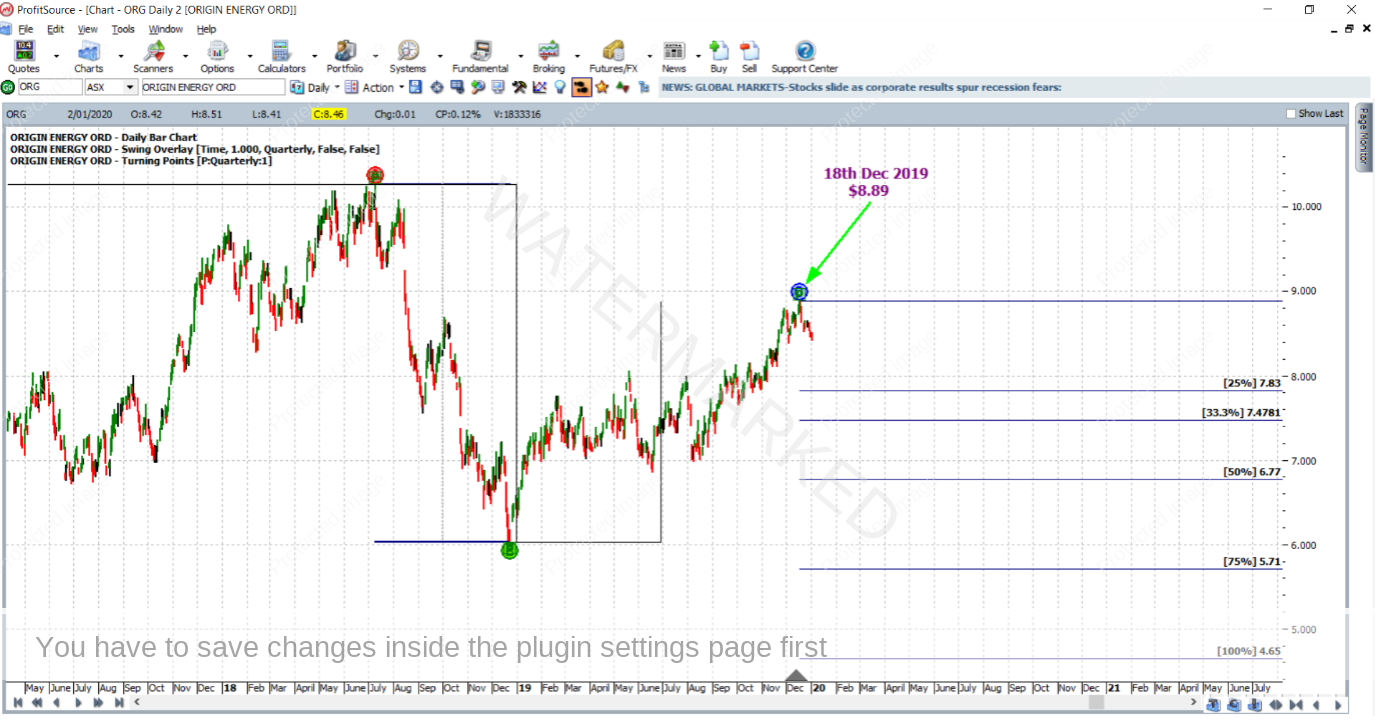
If we apply the ABC Pressure Point tool, it can be seen how the FRO from this section of the market could be used to call the last range in this section of the market. The AB range of the FRO in this case is based on the 2-day swing chart – i.e., the first upswing from the 8 August 2019 low, on the 2 day swing chart. So, Point A is placed on the low of 8 August 2019 and Point B on the high of 14 August 2019. Point C was placed on the low of 4 December 2019, and as a result of this the 100% milestone came in at $8.86 – with the eventual top of the 18 December 2019 at $8.89 only false breaking this resistance level by 3 cents i.e. 3 points. See below.
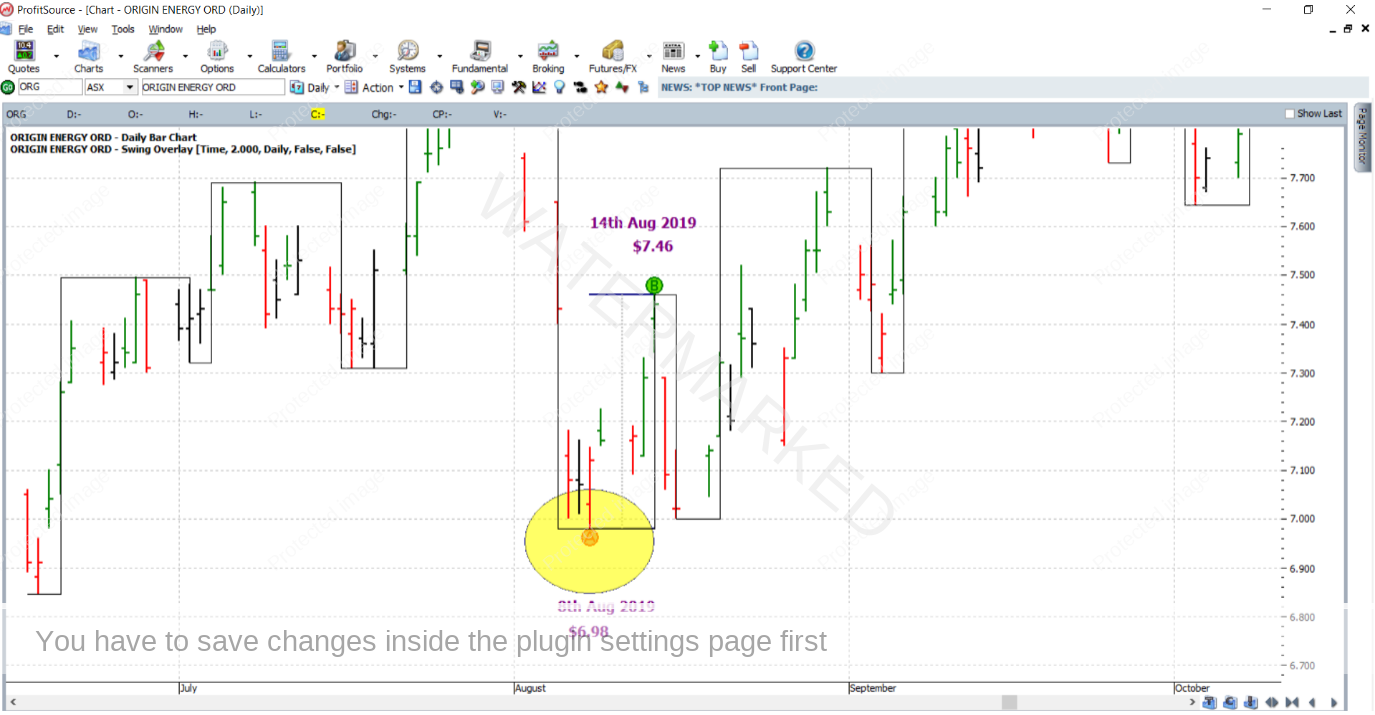
For reference purposes below is a close-up view of the FRO itself, and the 2-day swing chart overlay applied.
However, as many of our existing students will already know, it takes more than one technical price reason to trade. In other words, you would not have gone short ORG in December of 2019 based on this FRO analysis alone. Nor would the FRO in this case be your leading indicator as it used such a small picture range. At least two more price analysis reasons would be required.
And yes, there were! The two other price reasons which this article has in mind are from the “bigger picture”, that is they engage a few of the bigger picture turning points from the chart of this market, all well and truly prior to December of 2019, with the output of their analysis only considering multiples of 50% when it comes to milestones and resistance levels. Test your skills and see if you can determine what they were. Hint: you’re more likely to be correct if the three price reasons you end up with (including the $8.86 from above) average out at a price of $8.84.
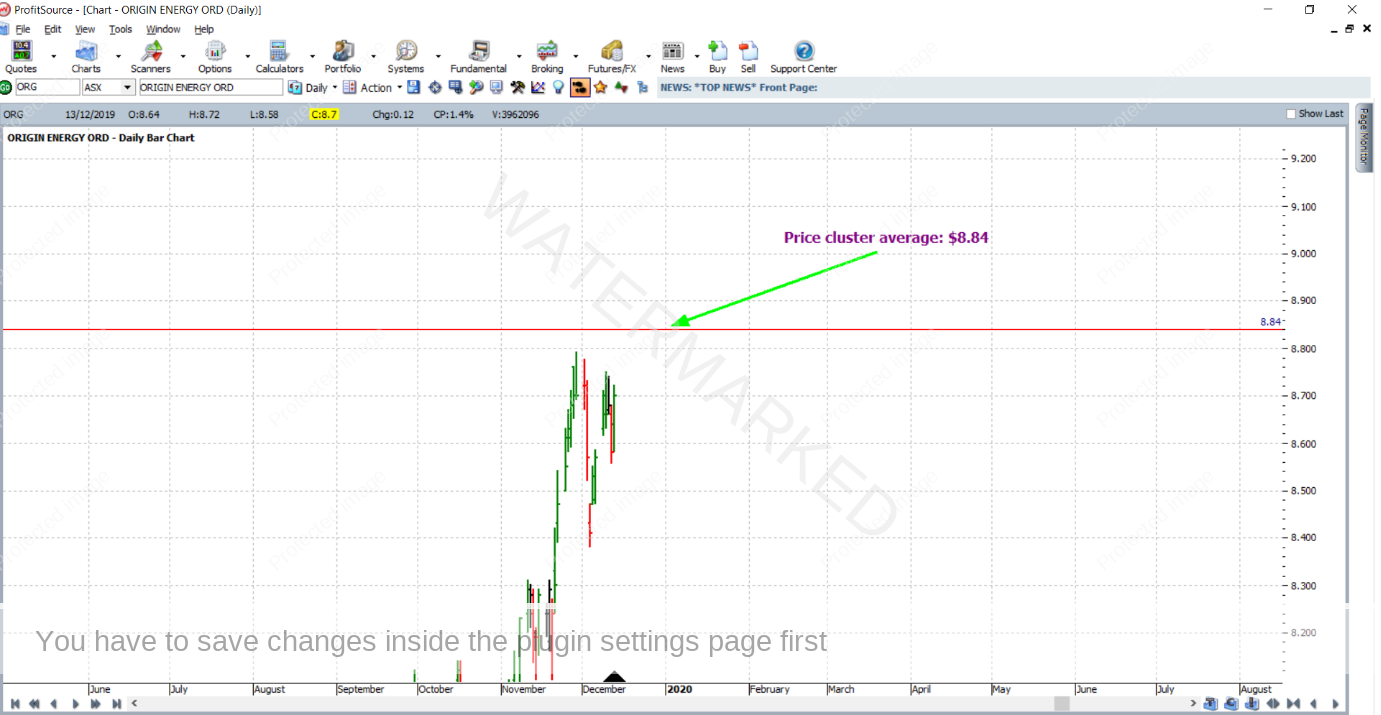
Now assuming that prior to 18 December 2019 you had done your price analysis, $8.84 would have been looming overhead as a strong price cluster and hence a place to watch for a potential reversal in the market. See the ProfitSource chart below in Walk Thru mode.
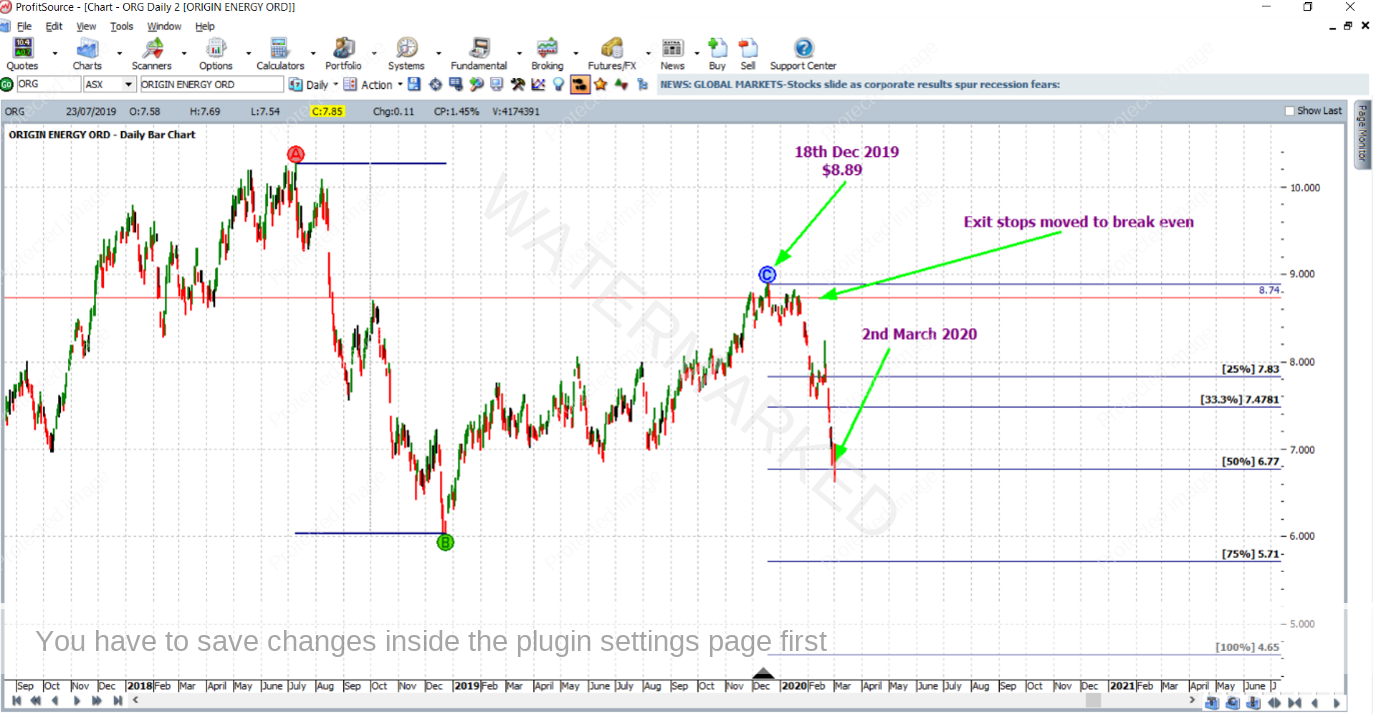
Then on 18 December 2019 the market reached the price cluster and broke it by 5 points, finally topping at $8.89 – some error obviously, but this is tolerable since the other two price reasons in question were from the very big picture. Overall, it was a strong price cluster and as you can see below a reversal in the market began.
As for getting into a trade as a result of the price cluster, the down day which was 19 December 2019 put a swing top in the daily swing chart, getting you short ORG at a price of $8.74, with an initial stop one point above the highs of the two smaller picture double tops at $8.90.
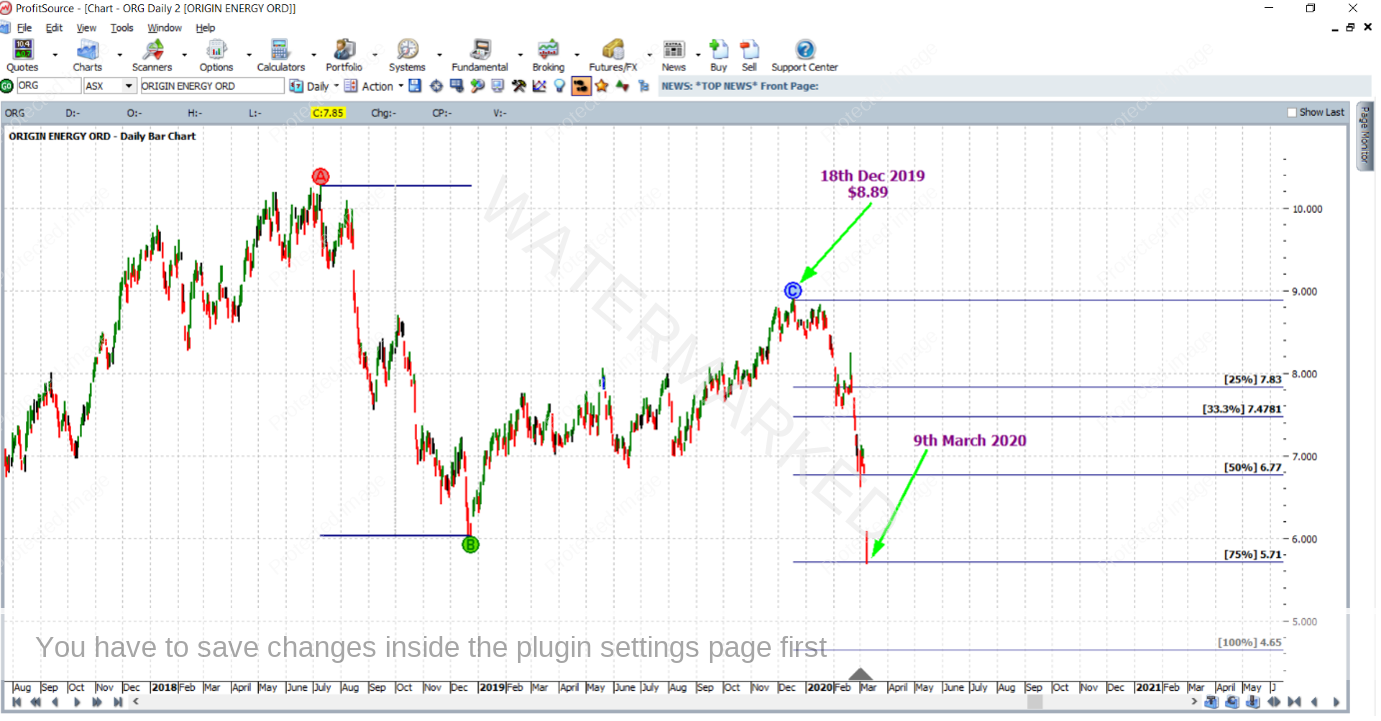
For managing the position, the last quarterly swing down was used with stops managed “Stock” style, that is, just like a large ABC trade taking profits at the 75% milestone. This is shown below with the aid of ProfitSource’s Quarterly Swing overlay, Quarterly Turning Point hi-lites, and of course the ABC Pressure Point tool.
Patience was required initially. It took until 2 March 2020 for the market to reach the 50% milestone, at which point exit stops were moved to break even.
Then on 9 March 2020 the 75% milestone was reached, and profits were taken at a price of $5.71.
Now for a look at the rewards of taking this trade:
Initial Risk: 8.90 – 8.74 = $0.16 = 16 points (point size is 0.01)
Reward: 8.74 – 5.71 = 3.03 = 303 points
Reward to Risk Ratio: = 303/16 = approximately 19 to 1
If 5% of the account size was risked at entry, the growth in account size from this trade alone would be as follows:
19 x 5% = 95% (almost doubling the account!)
And if 5% of a $10,000 account was risked at entry, the reward in Australian dollars would be:
19 x $500 = $9,500
Work Hard, work smart.
Andrew Baraniak
