Banking Crisis
Another Rally for Gold
The month of March always brings about some market activity and we could debate the drivers behind it, but I am comfortable to accept it’s just a seasonally active time for markets and we should be on guard for moves. I am reminded by virtue of my age I have now been around markets for what feels a shorter time than the 20 + years of actual experience. It’s interesting that I write this piece around the March seasonal date, and I recall the low of March 2003, way back when the invasion of Iraq occurred and ended the bear market and started the bull run that lead to the GFC.
Nostalgia is a wonderful emotion to experience but the markets wait for no one. As I re-read what I wrote last month, and my comment around big banks in Australia feeling like a comfy pair of shoes, we are now watching the demise of Credit Suisse and the Silicon Valley banks and echoes of a banking crisis have resurfaced. The reasons behind why they failed is complicated, but a general view is when markets are out of season failures are likely.
Banks and investment funds have experienced a falling equity market and bond market (rising interest rates) this has not been seen for 40 years or more and people forget history at their peril. This has presented trading opportunities on both the short side and long side.
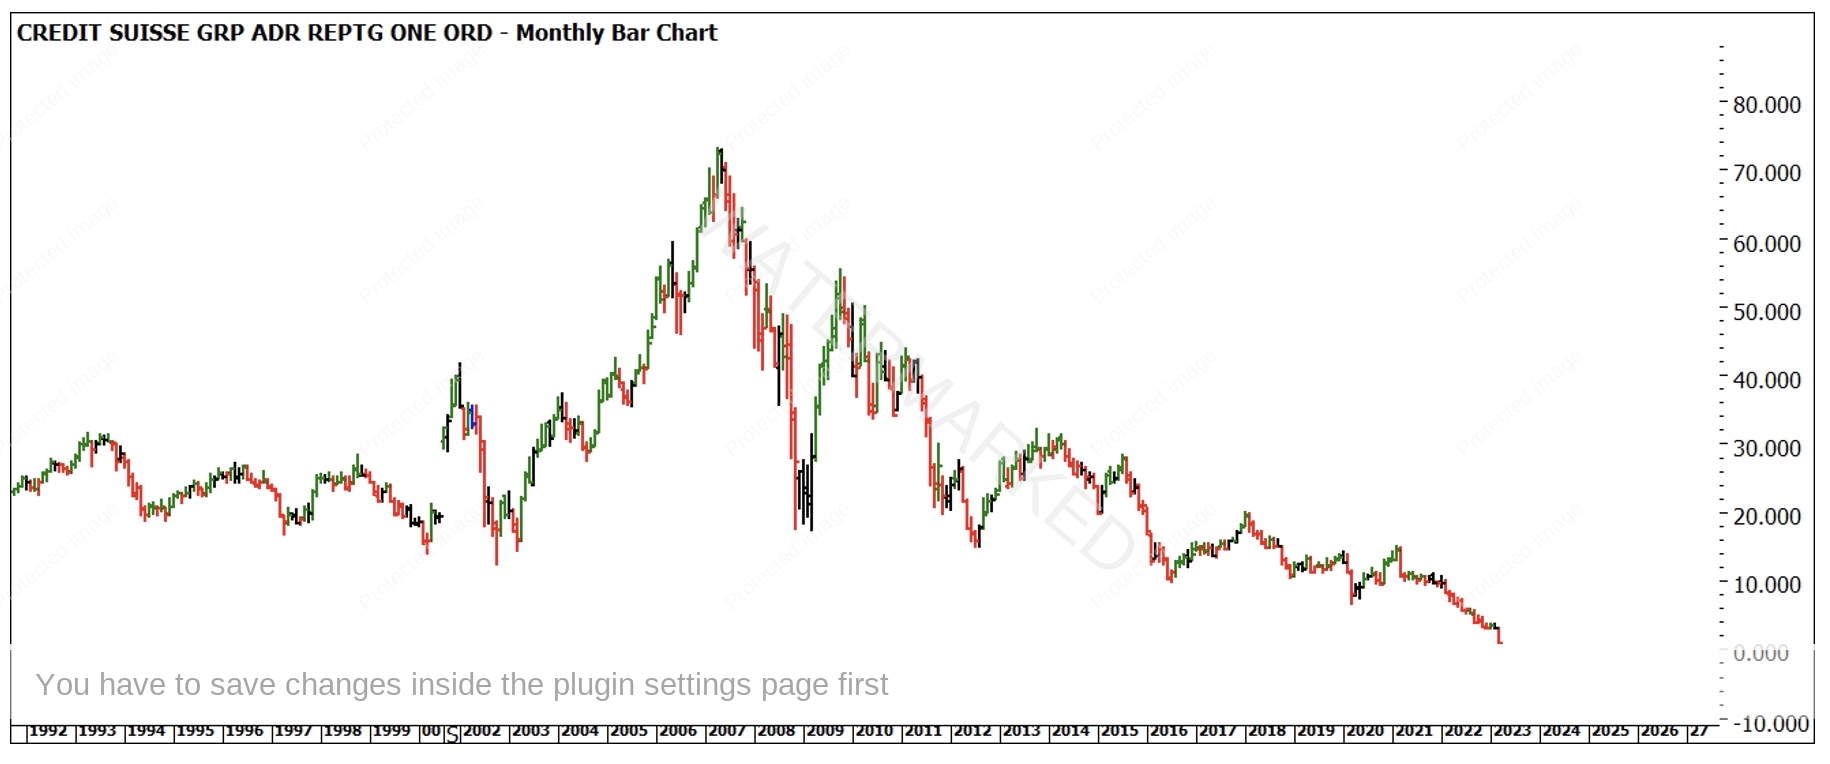
Chart 1 is a quick reality check for Credit Suisse stockholders that have held on for the ride expecting a salvation to occur. Here is a great example of stocks that can go to zero.
Chart 1 – Monthly Bar Chart CS.NYSE
The flip side to this is when a good financial bomb goes off the value of the shiny stuff, Gold, really gets traction. I wrote in 2022 on a few occasions how a whole community of investors are preparing for gold to be the only method of transaction when paper money falls over. I am not in the camp of the ‘end of the world’ scenarios, but we can participate in moves regardless of what’s driving them.
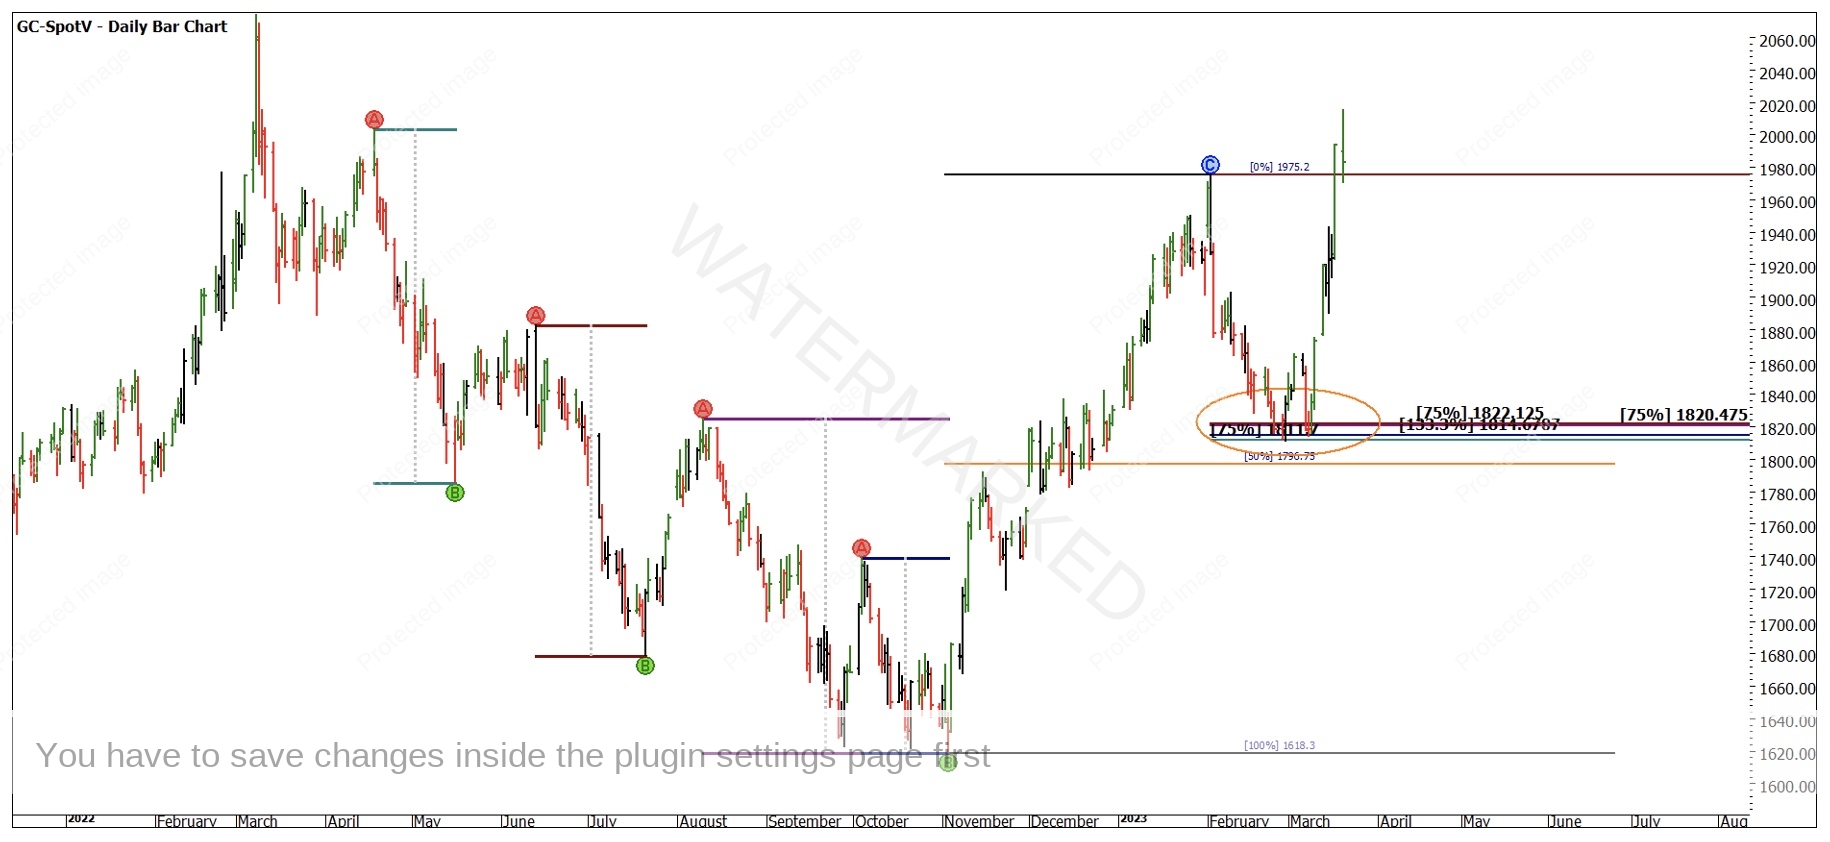
Chart 2 is the Gold futures market and the recent low that came in on 28 February 2023. You will note that the low pulled up above the 50% and also with a number of repeating ranges from the move off the high in 2022. Whilst the chart is quite busy, note how 75% (not the most powerful milestone) has appeared multiple times.
Chart 2 – Daily Bar Chart GC-Spotv
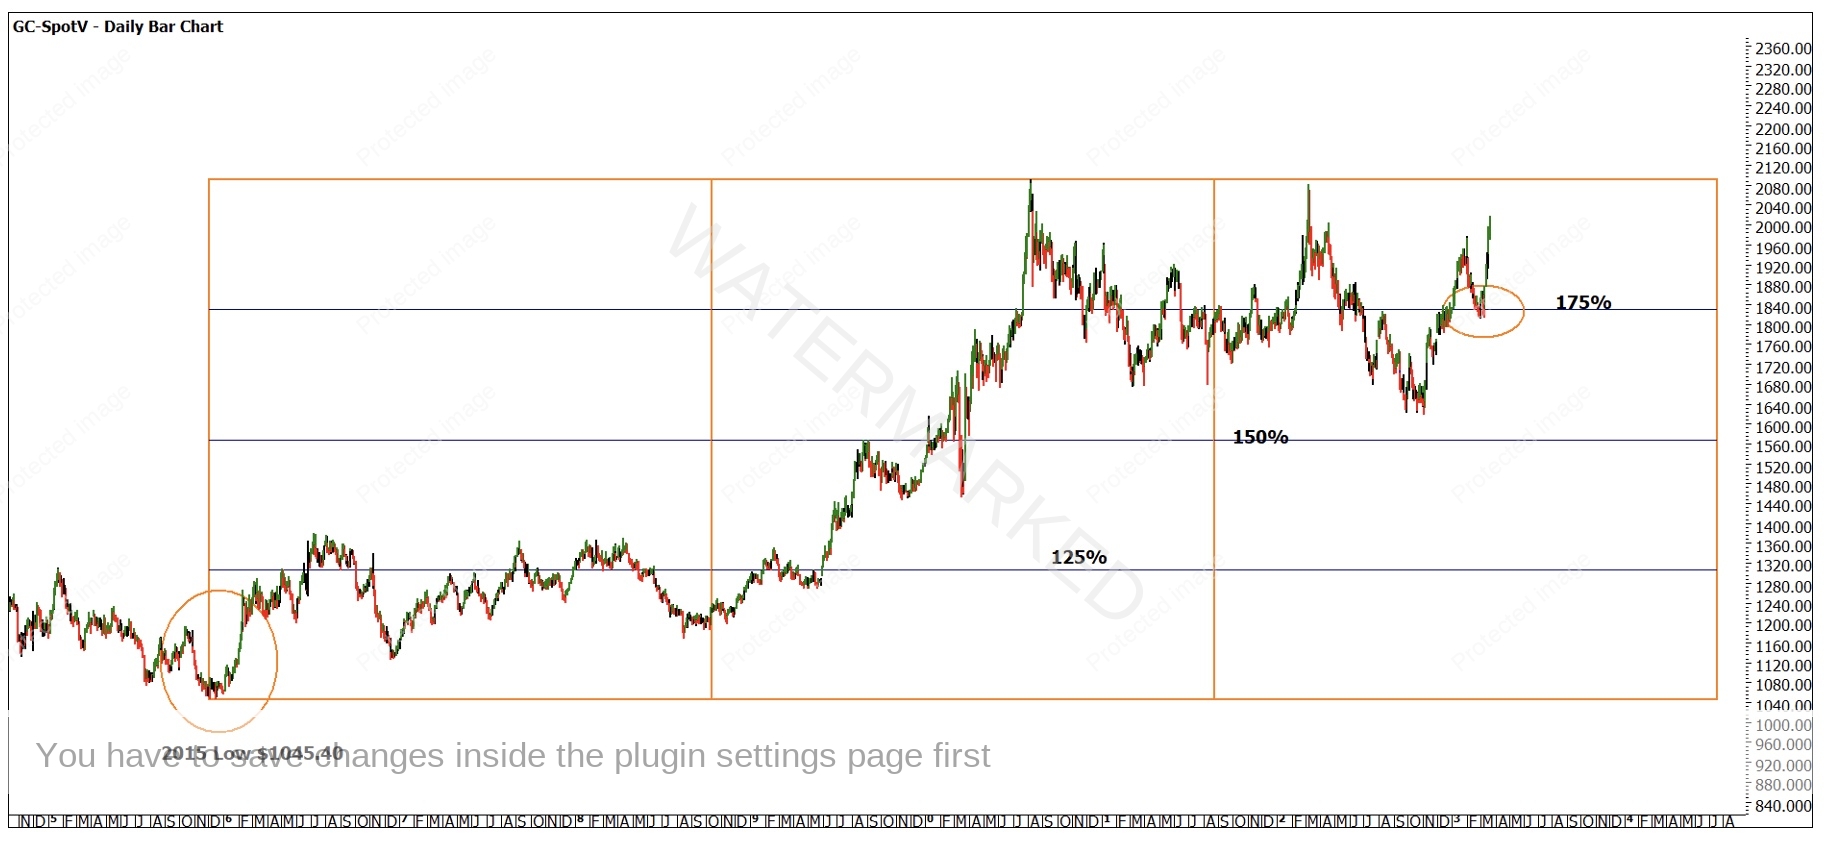
Chart 2 uses another one of our Price Forecasting tools, the Lows Resistance Card. Using the most recent cycle low in 2015 we see the current cluster in February this year is 175% of that low (approximately) Using that low also nailed the 2020 high as well, so we know we should respect it.
Chart 3 – Daily Bar Chart GC-Spotv
There are a number of other price aspects that we can use to support the possibility of a low, the pattern is also worth breaking down into a trading strategy. I spoke of cycles and anniversaries at the start and I am sure many of you would notice the low we are discussing is the 8th of March, where the 2022 major high was also the 8th of March.
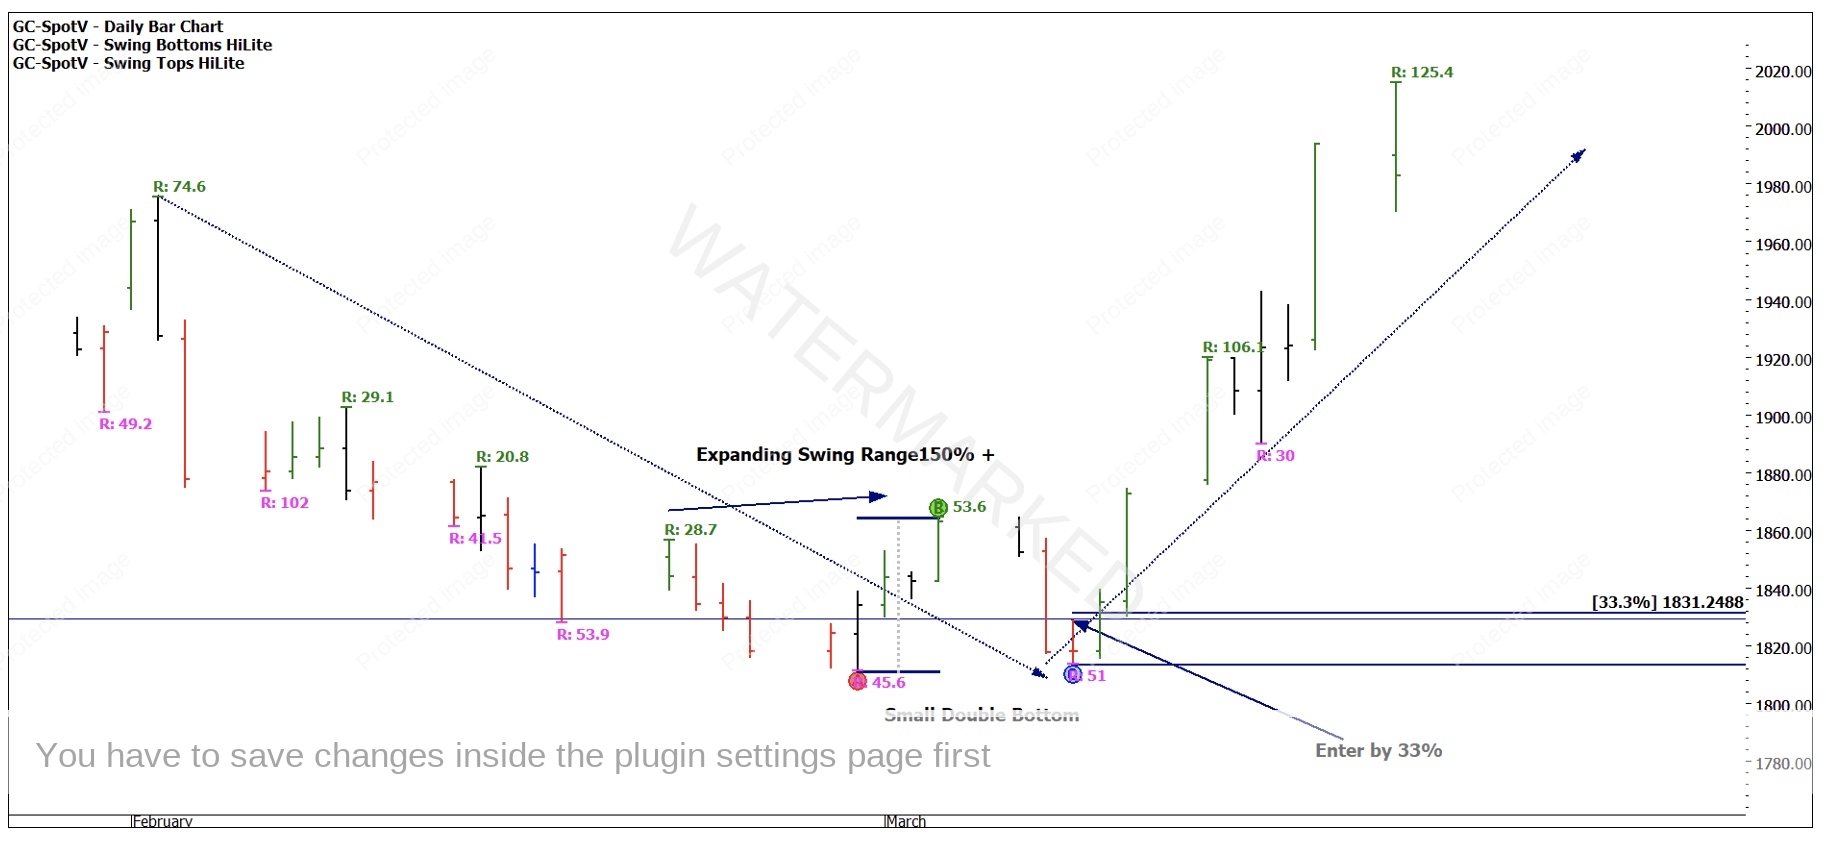
Often when a market retests itself in a short period, we can see short term double bottoms or tops. In this case the market made a small double bottom that in turn acted as a springboard.
Chart 4 focuses on the swing ranges into the low, followed by a first higher bottom entry on the swing chart. An entry was available using a 1-day swing chart inside the 33% limit. A key for me here was the expanding upside range of $53.60 before the move really kicked off. It’s also interesting to note the next up swing was $106.10 approximately 200% of the previous range.
Chart 4 – Daily Bar Chart GC-Spotv
The trade currently is showing a 9 to 1 Reward to Risk Ratio, intra-day entries could have been utilised to lower risk on entry.
Gold is easily traded as a futures contract, a CFD or you could look at gold stocks as a proxy , however, I have found that the stocks are often multi mineral/metals, so don’t always move in line with pure gold prices.
Good Trading
Aaron Lynch


