As Good as it Gets!
As a trader, after a large enough sample of trades you start to know the types of setups that resonate with your own personal style and when they come along you get pretty excited. Having delivered hundreds of sessions on trading and thousands of hours of research and practical application I still get chills thinking how good this Gann stuff is.
I have spoken and written consistently for 20 years on the value of a 50% retracement and when that aligns with Time and Price there is power in making simple the requirements you need for a setup. Gann said that you could make a fortune just by using the 50% level. . The following setup that has triggered and is currently sitting in a handy profit is one that can be studied and reviewed at around the same time each year. It’s of course a market I know well which is Crude Oil. Given all the changes I have lived through in half a generation it’s amazing that the things I remember talking to traders about around the globe have appeared again.
Firstly, an overview of the techniques… Using Seasonal Time from David’s lesson in the Ultimate Gann Course prepares you to look for periods in the calendar to watch for potential changes in trend. One period is approximately the 21st of March each year, which is important for various reasons.
The second using Time relates to the birthday of the market you are trading, the day a contract commences trading on an exchange can be used as a zero date. In the case of Crude Oil, the futures contract, commenced trading in New York on 30 March 1983. Again, this means we can see activity around these dates.
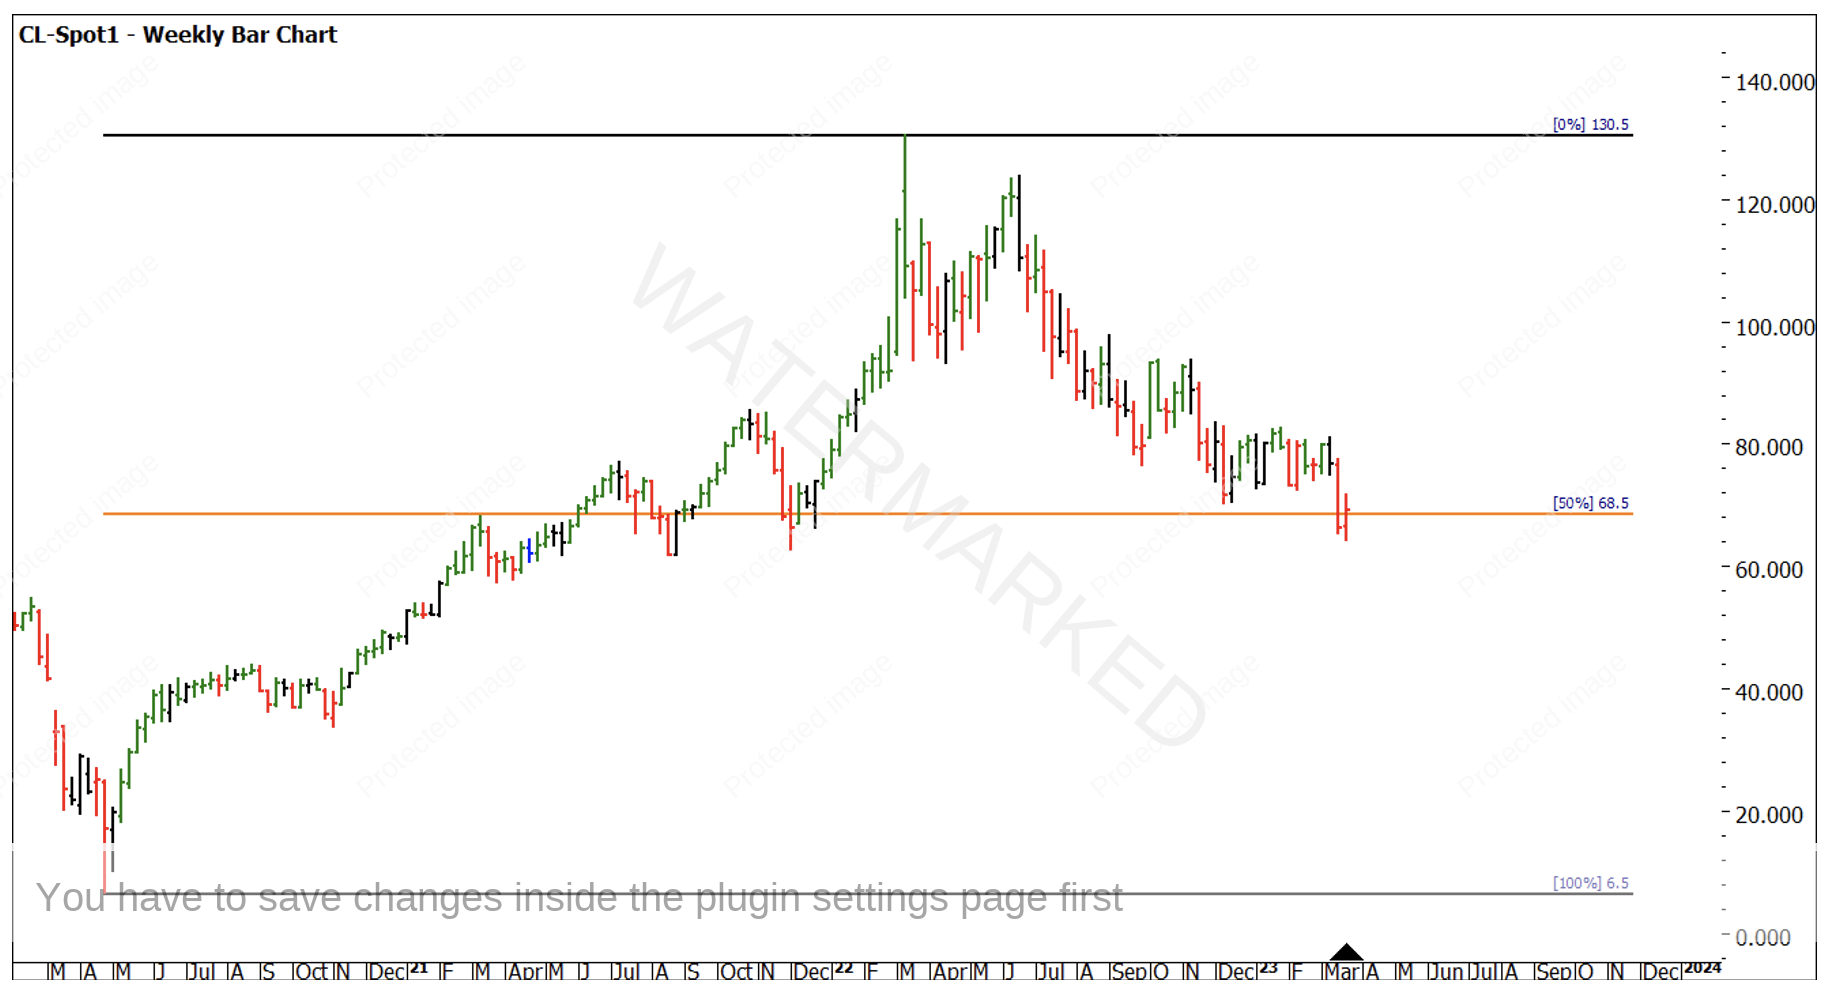
Big picture 50%’s are a consistent strategy on Crude and 2023 has delivered again. Chart 1 looks at the 2020 low and 2022 high and how the 50% sits at a price of $68.50. This proves to be an important level. If we can see strength above, then long trades are a bias, below, short trades are more likely.
Chart 1 – Weekly Bar Chart CL-Spot1
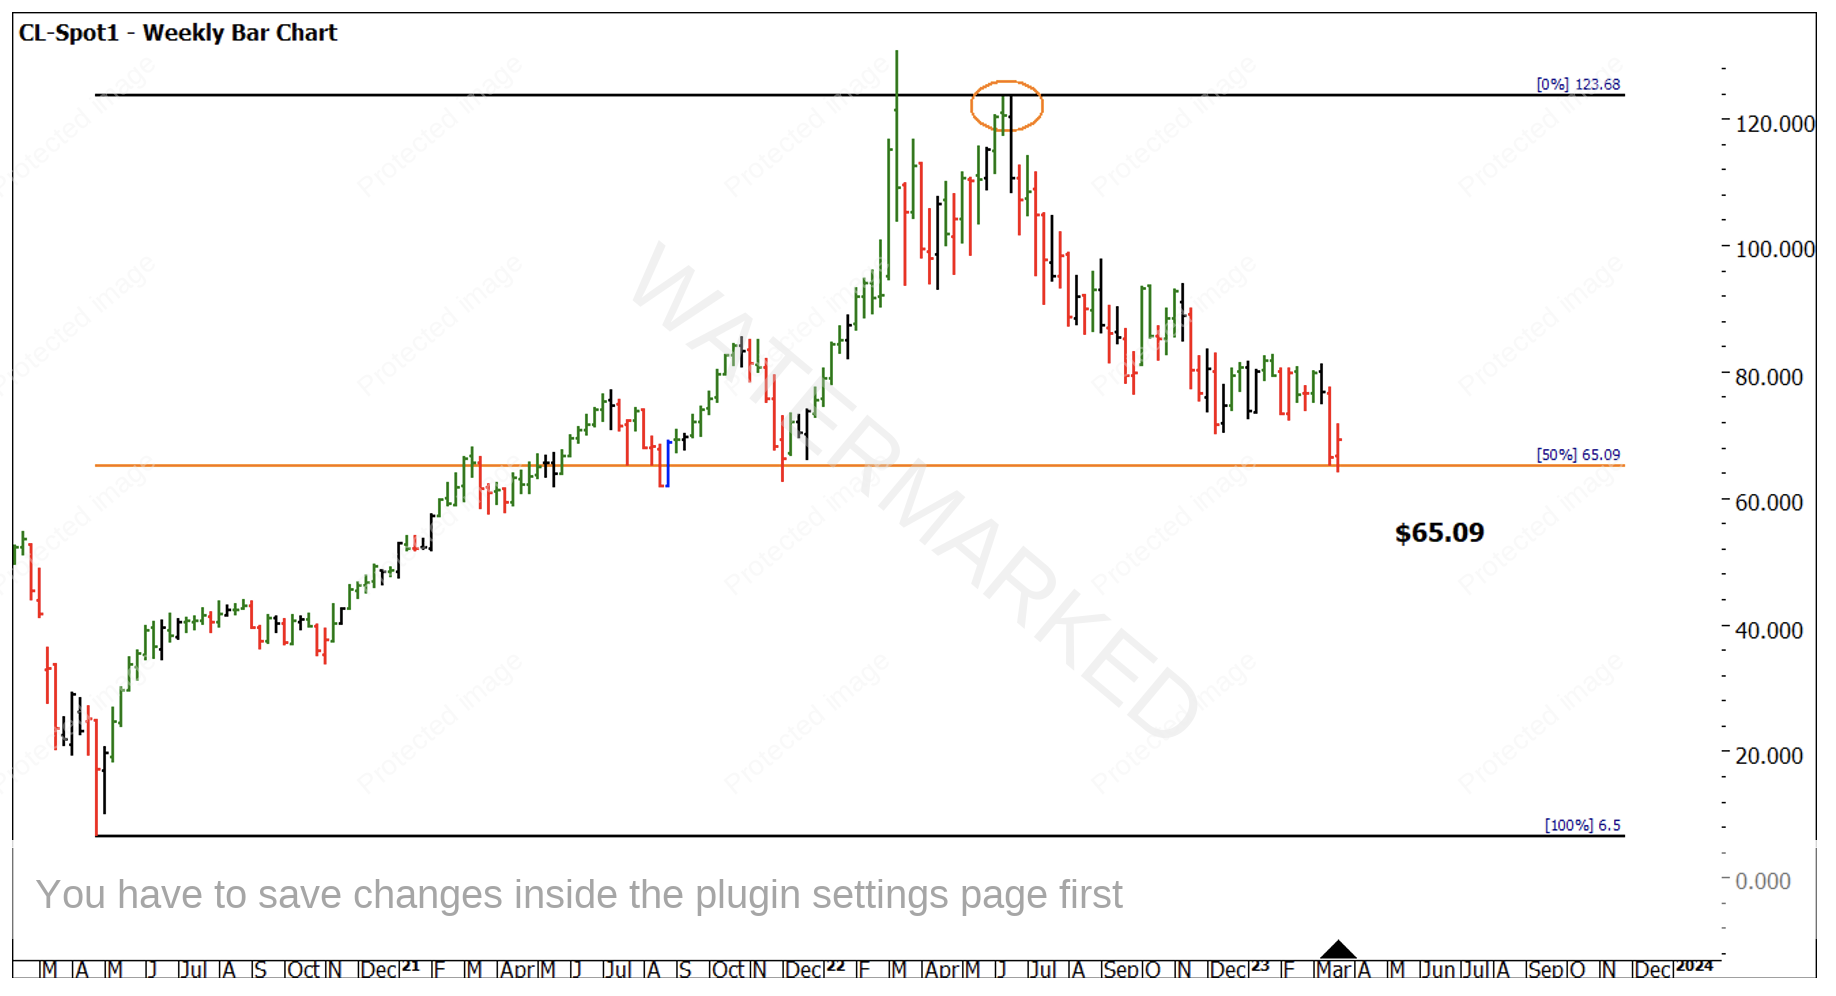
Chart 2 varies slightly as it uses the June 2022 high as opposed to the March 2022 high. This produces a slightly different 50% level $68.50 vs $65.09. The variances between the two are important but beyond the scope this article. For the more seasoned traders you could refine it down to the difference between a physical top and a true top.
Chart 2 – Weekly Bar Chart CL-Spot1
You may also see some better harmony when considering the Covid low of 2020 was $6.50, the current price action sits 10 times that low. So as a Lows Resistance Card and a Market Square, the second of the highs shows some more harmony. You should recreate this for yourself.
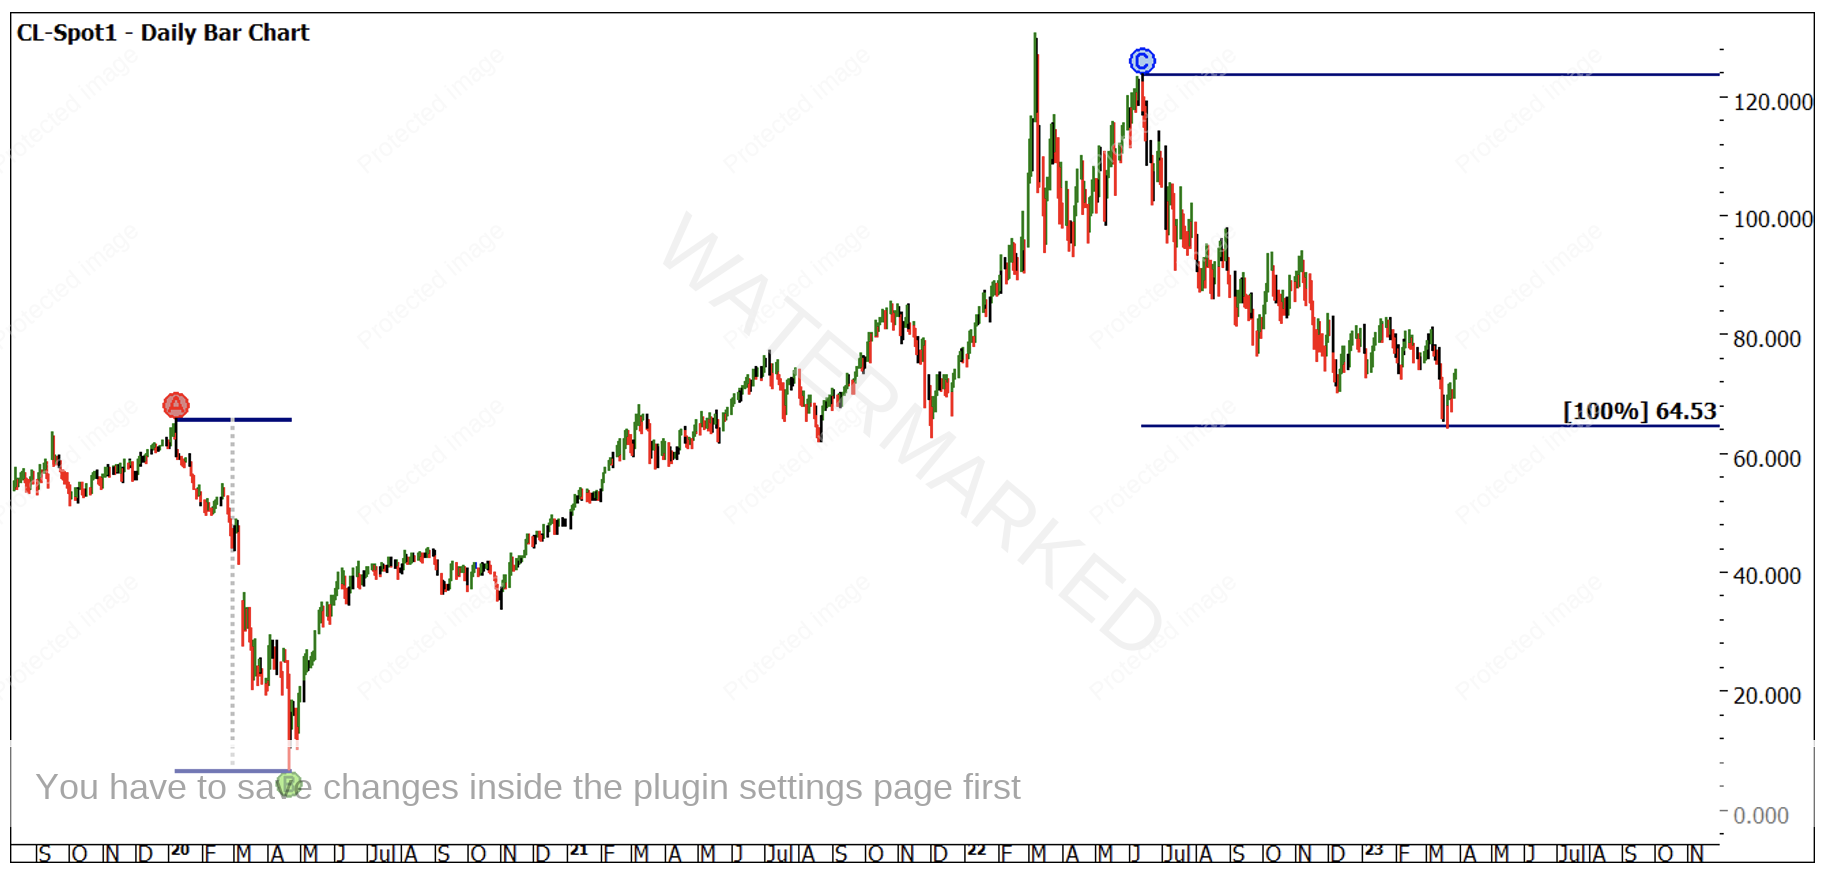
Chart 3 helps support the history repeating notion as the last range down into the Covid low of 2020 has repeated (albeit over a longer time frame) into the current low.
Chart 3 – Daily Bar Chart CL-Spot1
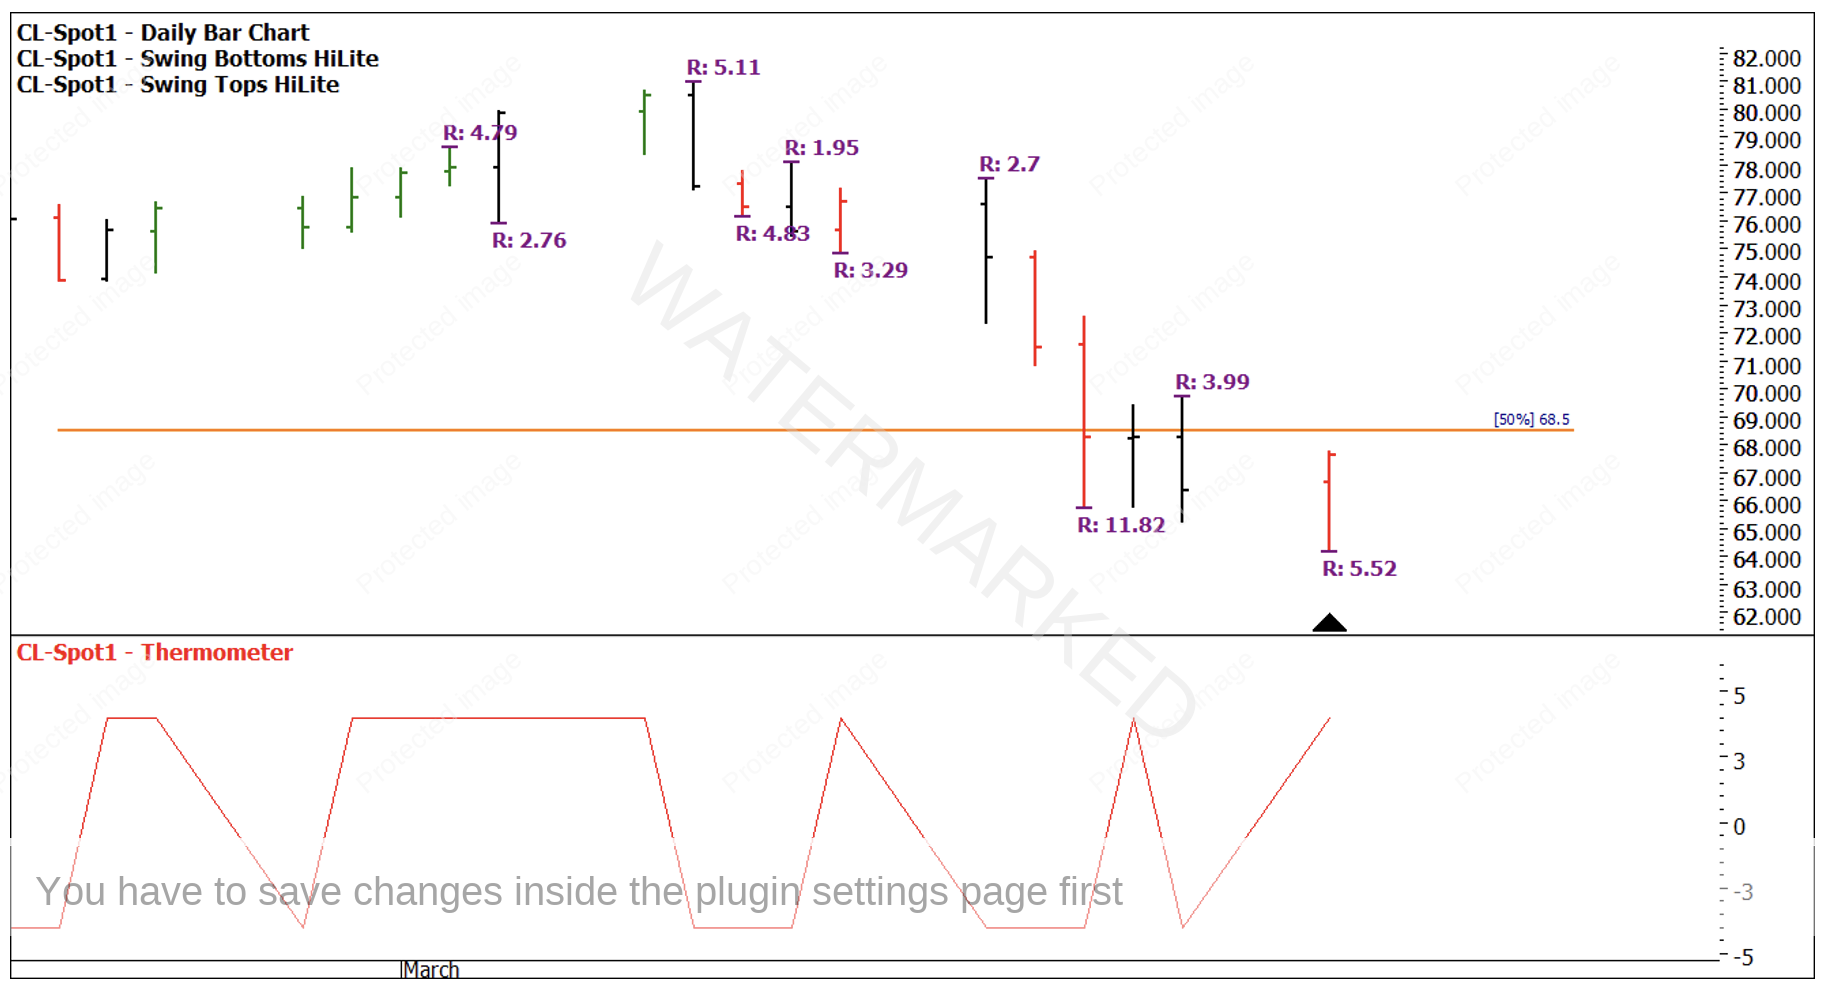
Chart 4 shows how the price action on our swing chart suggest ranges were shortening on the downside and expanding on the upside. The open close reversals on the seasonal date 20 March were also suggesting sentiment was changing.
Chart 4 – Daily Bar Chart CL-Spot1
There are a number of other techniques that could be layered to support a set up. I have watched over the years the usefulness of 50% retracements into seasonal dates and I suggest you study up on them.
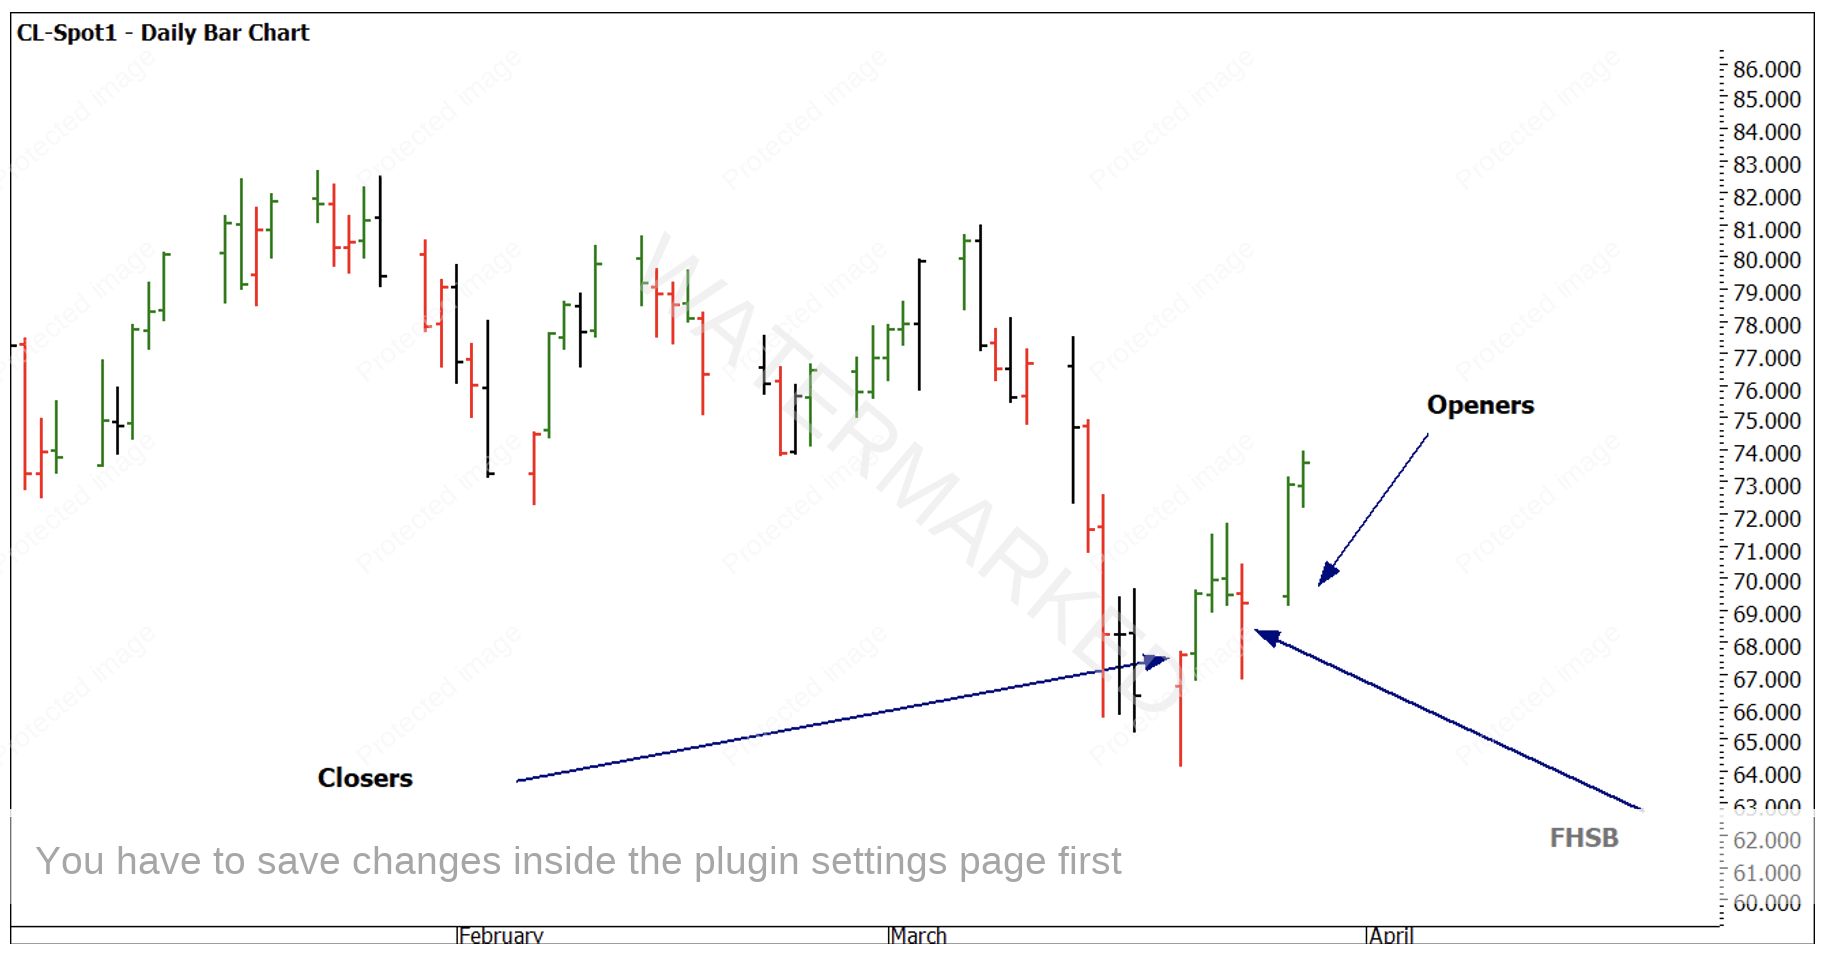
The final point would be to examine a trading strategy. What guides traders here would be what level of confirmation would be required and how aggressively you would set your entry.
Some thoughts here (using Chart 5 as a visual)
- Intraday (not shown) there were a number of higher bottom opportunities to engage.
- Closers rule 20th of March.
- First higher swing bottom
- Openers Rule 27th of March.
Chart 5 –Daily Bar Chart CL-Spot1
If I had only one technique to apply, it would be to watch for changes of trends around 50% levels where time pressure exists. The challenge for these larger picture setups is patience, but if you can bank these examples from multiple markets into your trading plan you are much more likely to be ready when they reappear.
Good Trading
Aaron Lynch
