Sweet Oil
One of the hardest aspects of trading I used to find was being out of the market because when you’re not in a trade you can’t make a profit! If you asked me previously what my number one aim was in trading, my answer would have been ‘to make money’.
What if we could become more process-driven rather than outcome-driven? Can you design a process to identify and trade a 10 to 1 (or more) Reward to Risk Ratio (RRR) trade per month for 10 months of the year? This would result in a net 100 to 1 RRR for the year whilst leaving you plenty of time out of the market for, well, other things!
In a book called Atomic Habits by James Clear, he talks about the ‘Aggregation of Marginal Gains’. To paraphrase, he talks about looking for a 1% improvement in all aspects of your process each day so that over a year that would result in you being 37 times better after 12 months.
I run the same daily market analysis process most days of the week. This is to scroll through all the swing chart time frames on about 15 markets to identify new big picture setups and to stay on top of setups previously identified. This process kept me on top of the 20 March 2023 low on Oil which resulted in reaching my monthly trading goal.
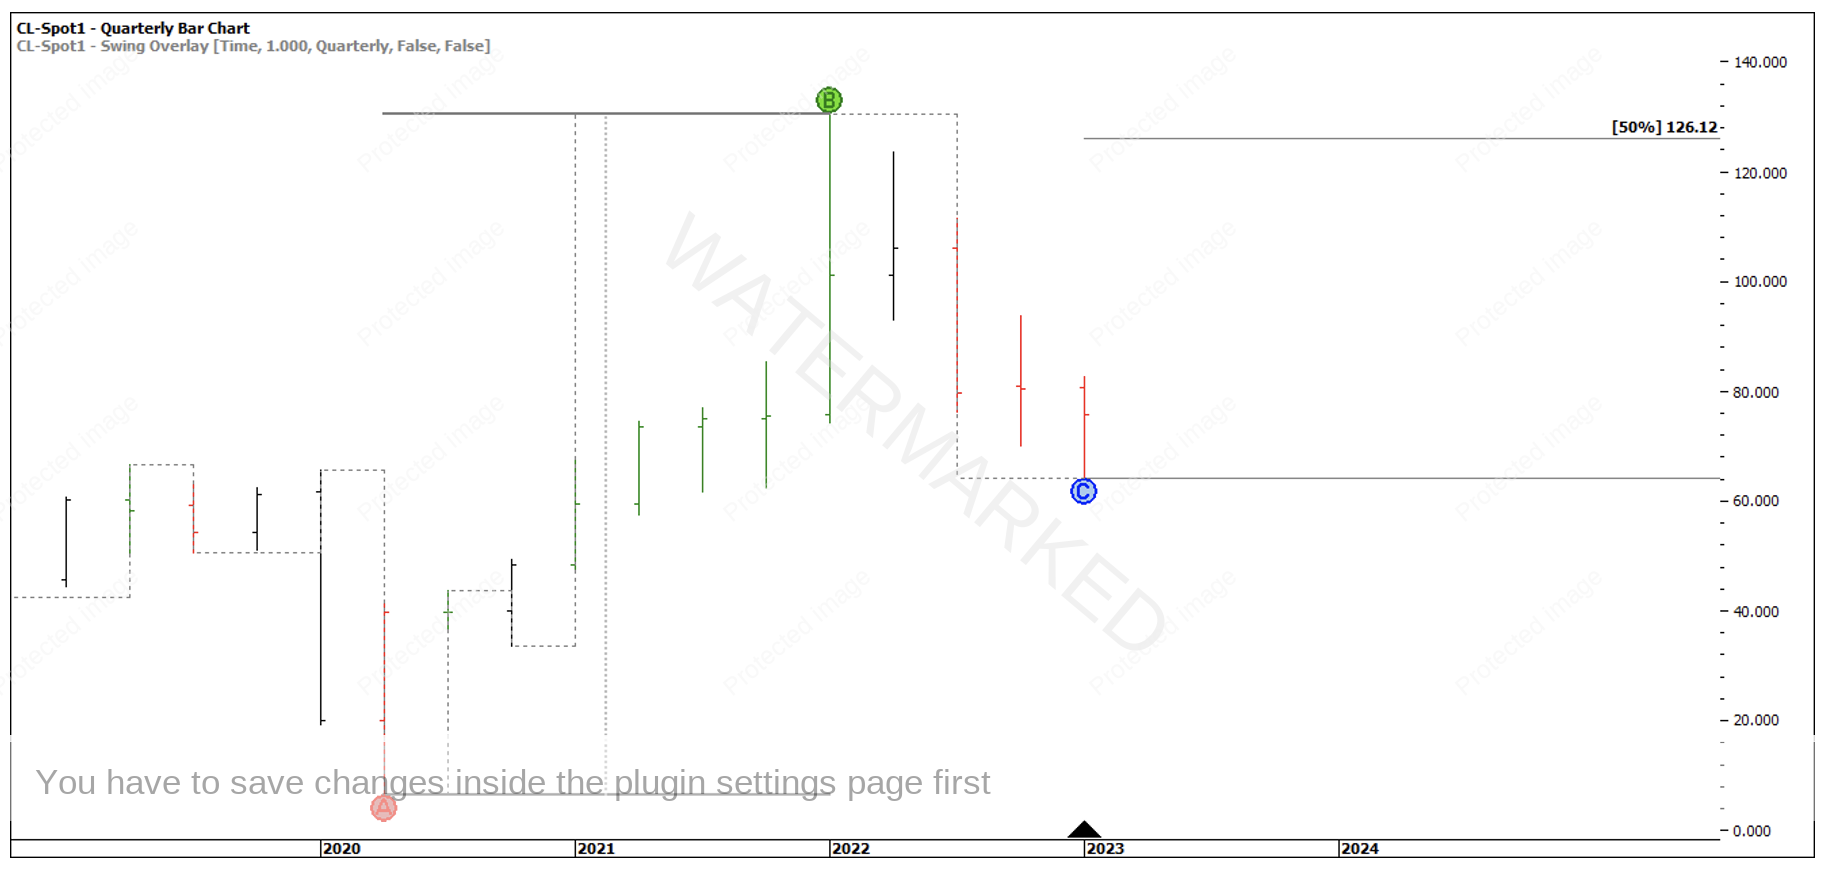
Looking at the quarterly swing chart analysis in Chart 1 below, Oil looks to be in a quarterly ABC pattern and the last 12 months would be the B-C retracement.
Chart 1 – Quarterly Swing Chart
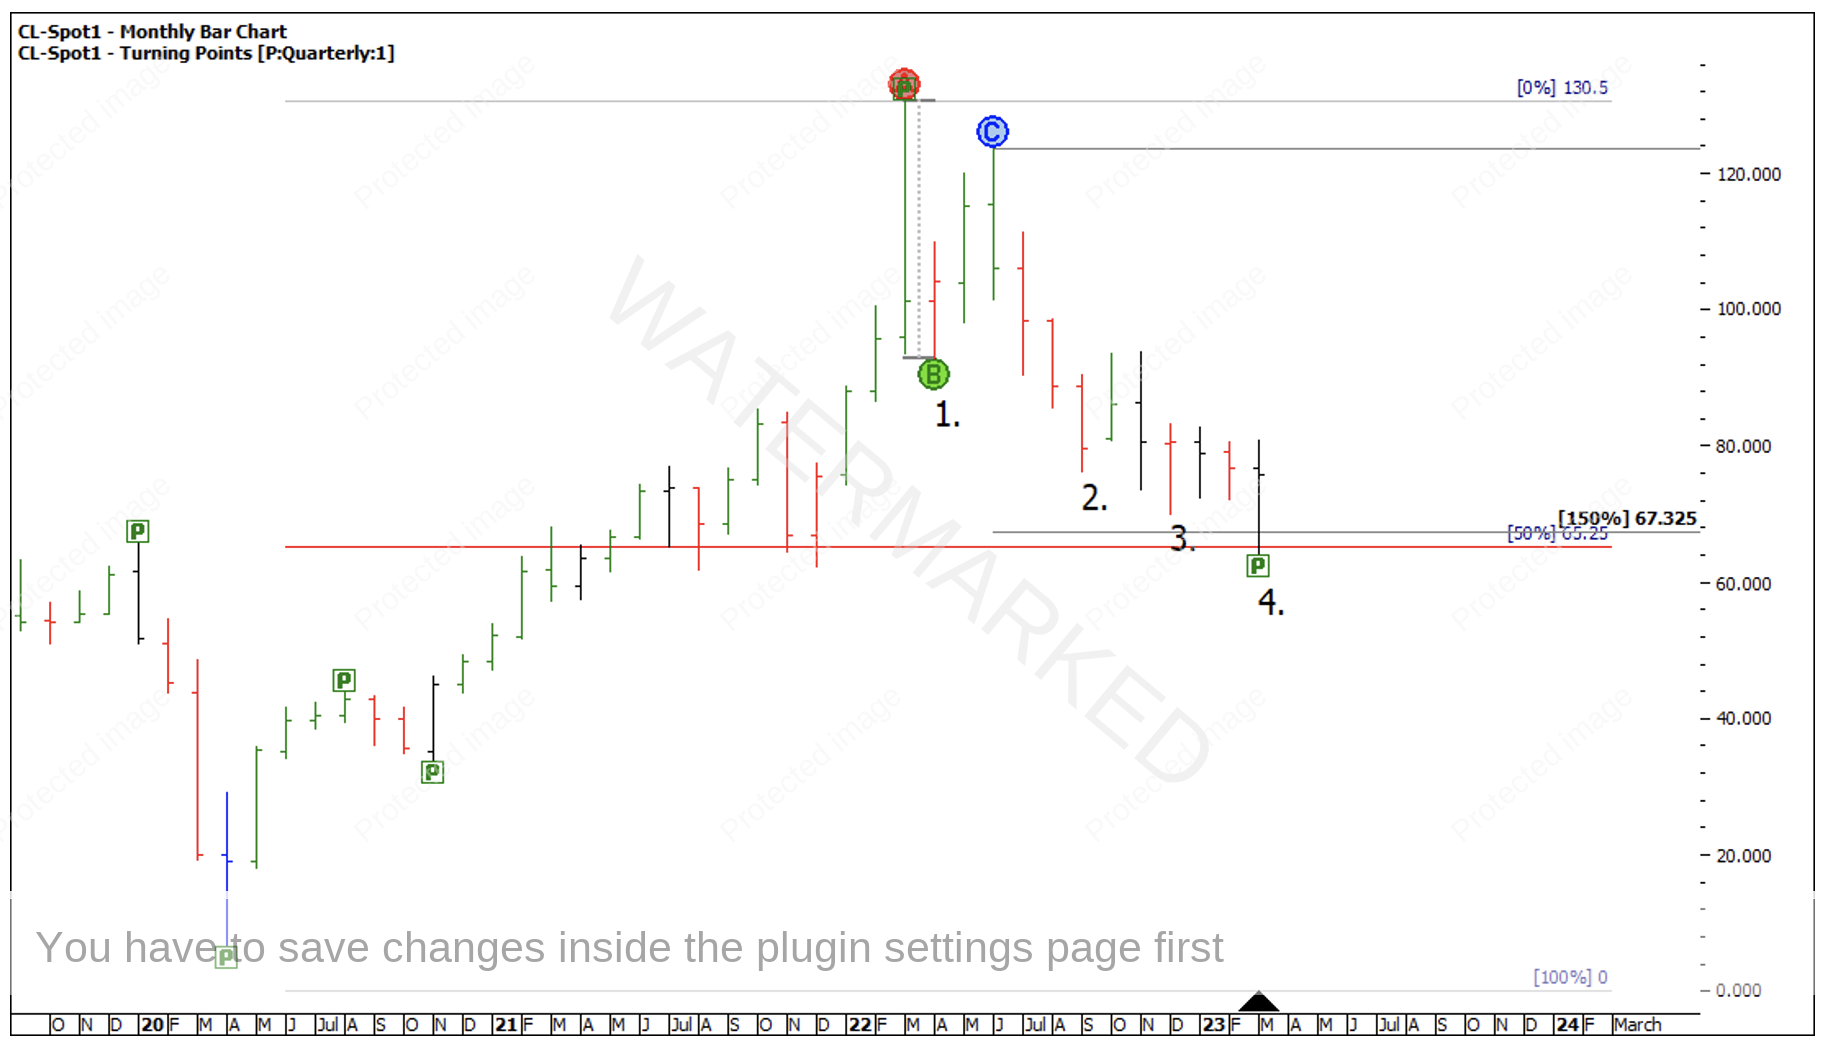
Utilising Form Reading skills, this Quarterly B-C retracement looks like it has possibly come to an end due to the four monthly swings or ‘Sections’ within this one quarterly swing. Also, the last 2 swings down are both contracting swing ranges.
For the big picture price milestones that form the basis of this cluster, I see;
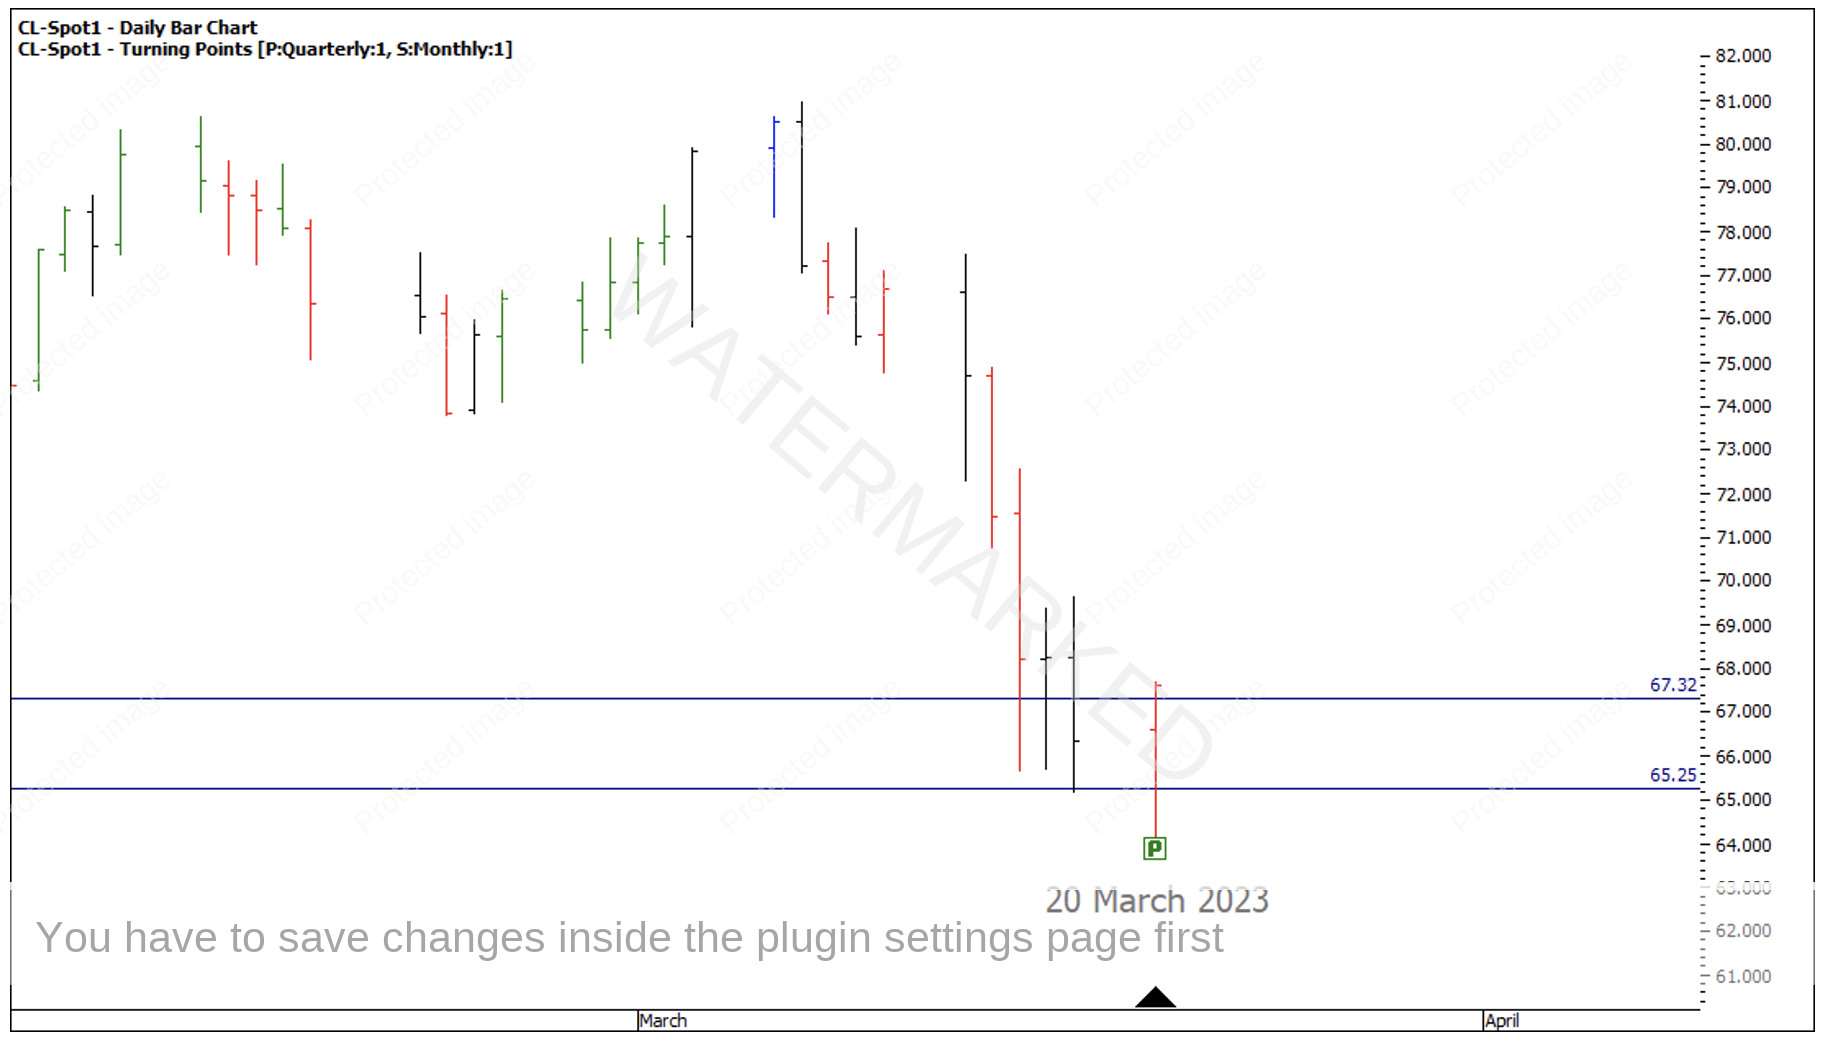
- 150% of the Monthly First Range Out = $67.32
- 50% Highs Resistance Card = $65.25
Chart 2 – Monthly Sections
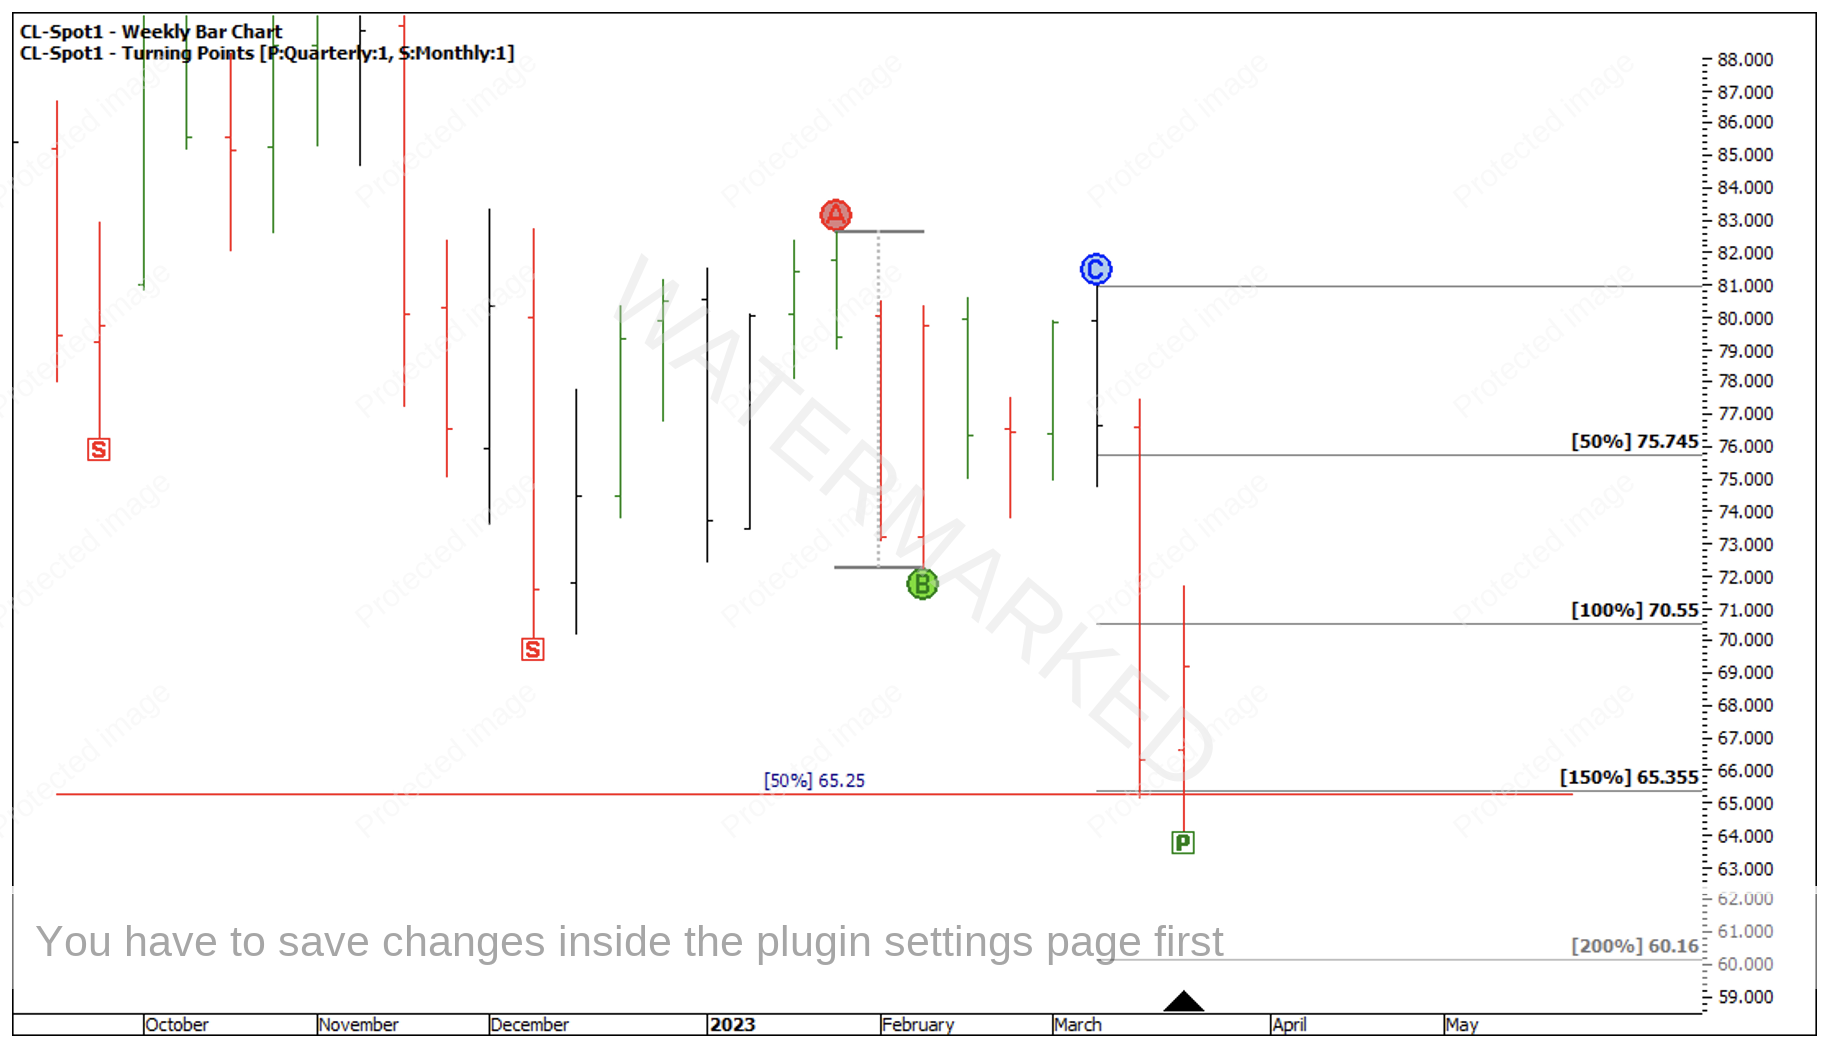
Breaking down monthly Section 4 on a smaller time frame, 150% of a weekly First Range Out gives a price of $65.35.
Chart 3 – Weekly First Range Out Milestones
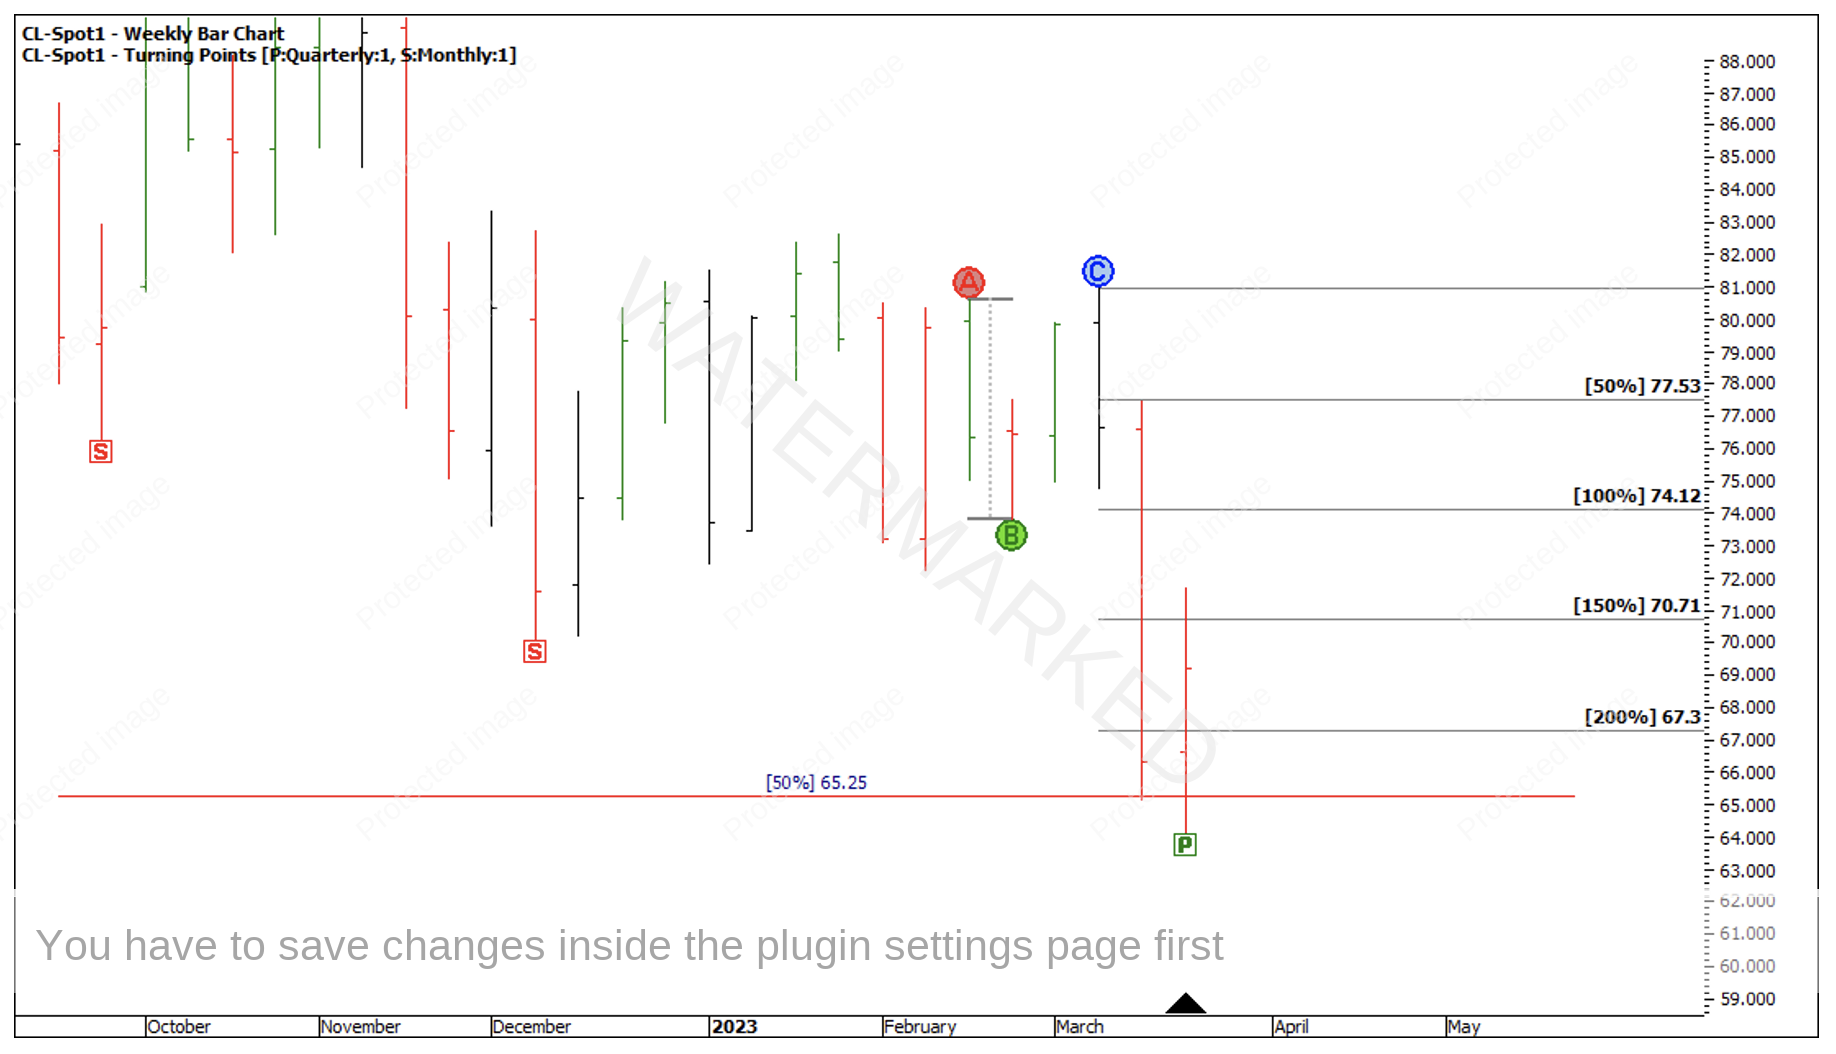
Then, 200% of the last weekly swing gives a price of $67.30.
Chart 4 – Weekly Swing Range Milestones
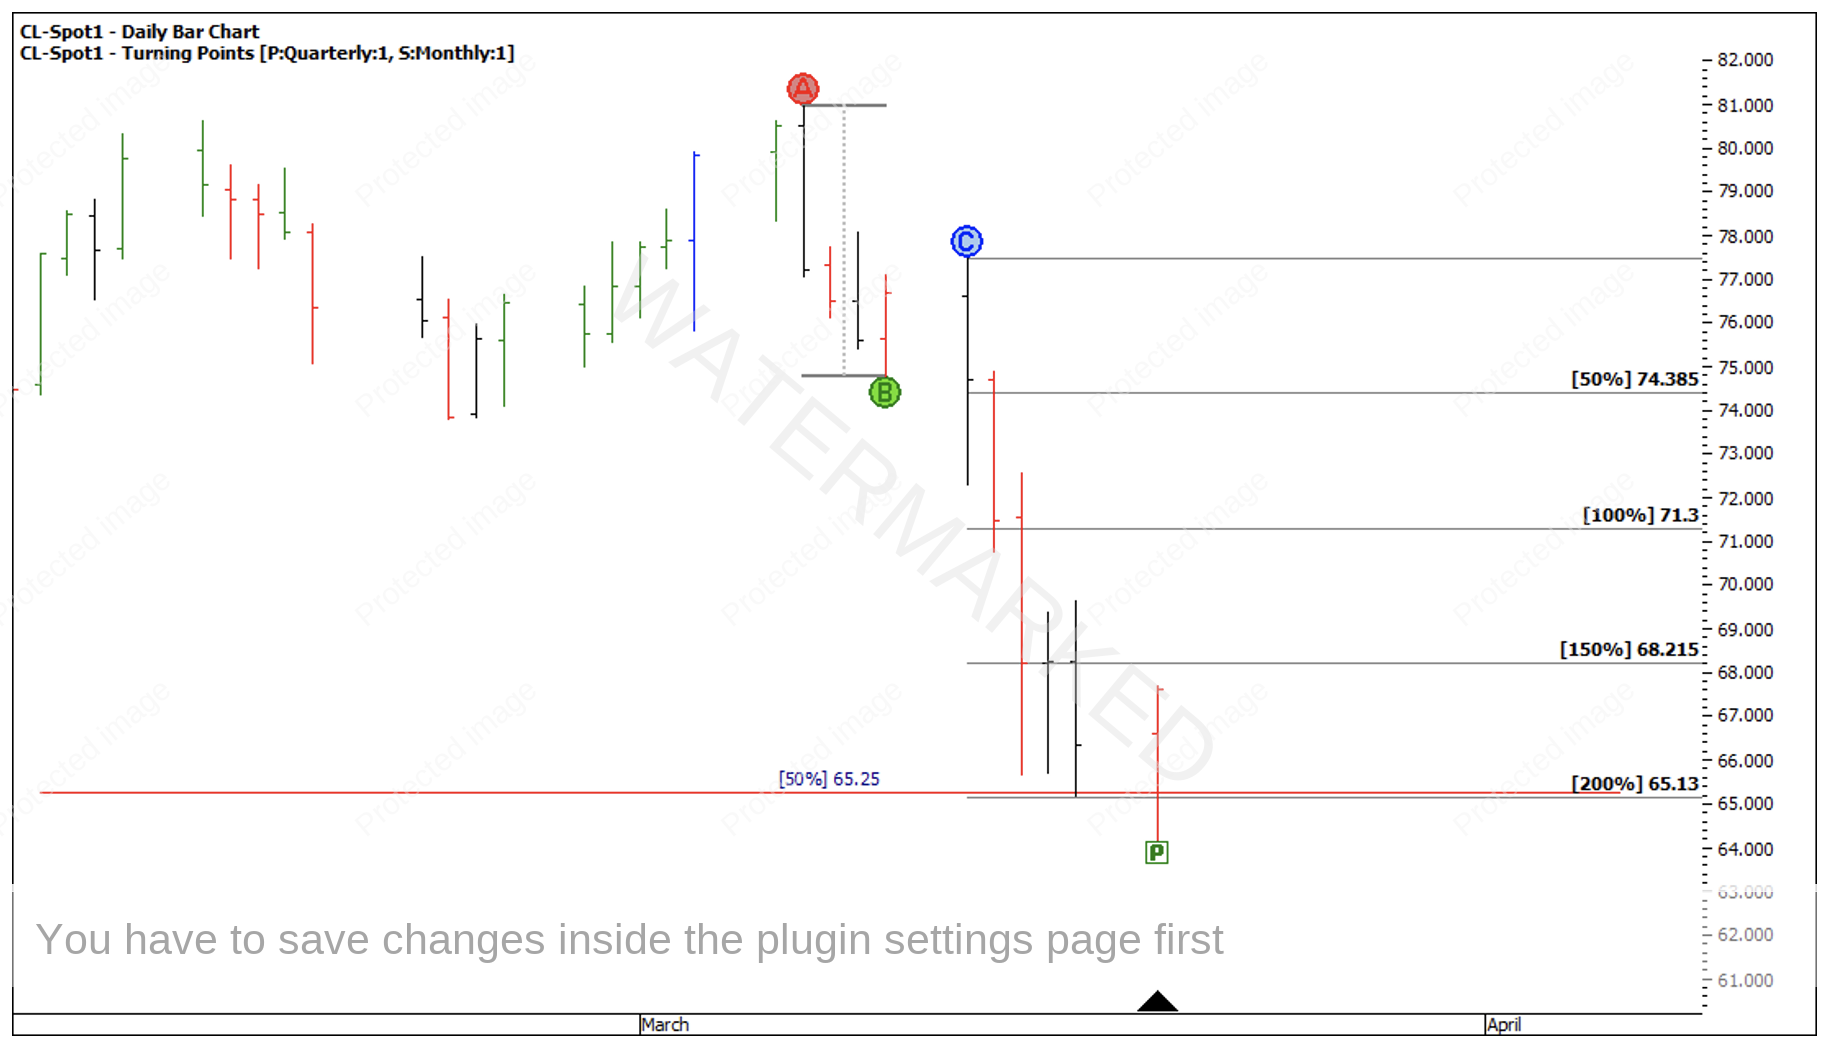
Of this last weekly swing, the 200% of a slightly bigger daily First Range Out gave a price target of $65.13.
Chart 5 – Daily First Range Out Milestones
When you look at the extreme points of the cluster, there is about 3% difference which makes it hard for an intra-day entry. However, the day of the extreme low, 20 March 2023, was a ‘Key Reversal’ signal bar after a contracting daily swing down.
Chart 6 – Cluster Variation
As the April 2023 futures contract came to an end, you would have been better off looking to trade the May 2023 contract or, a combined CFD contract with no rollover.
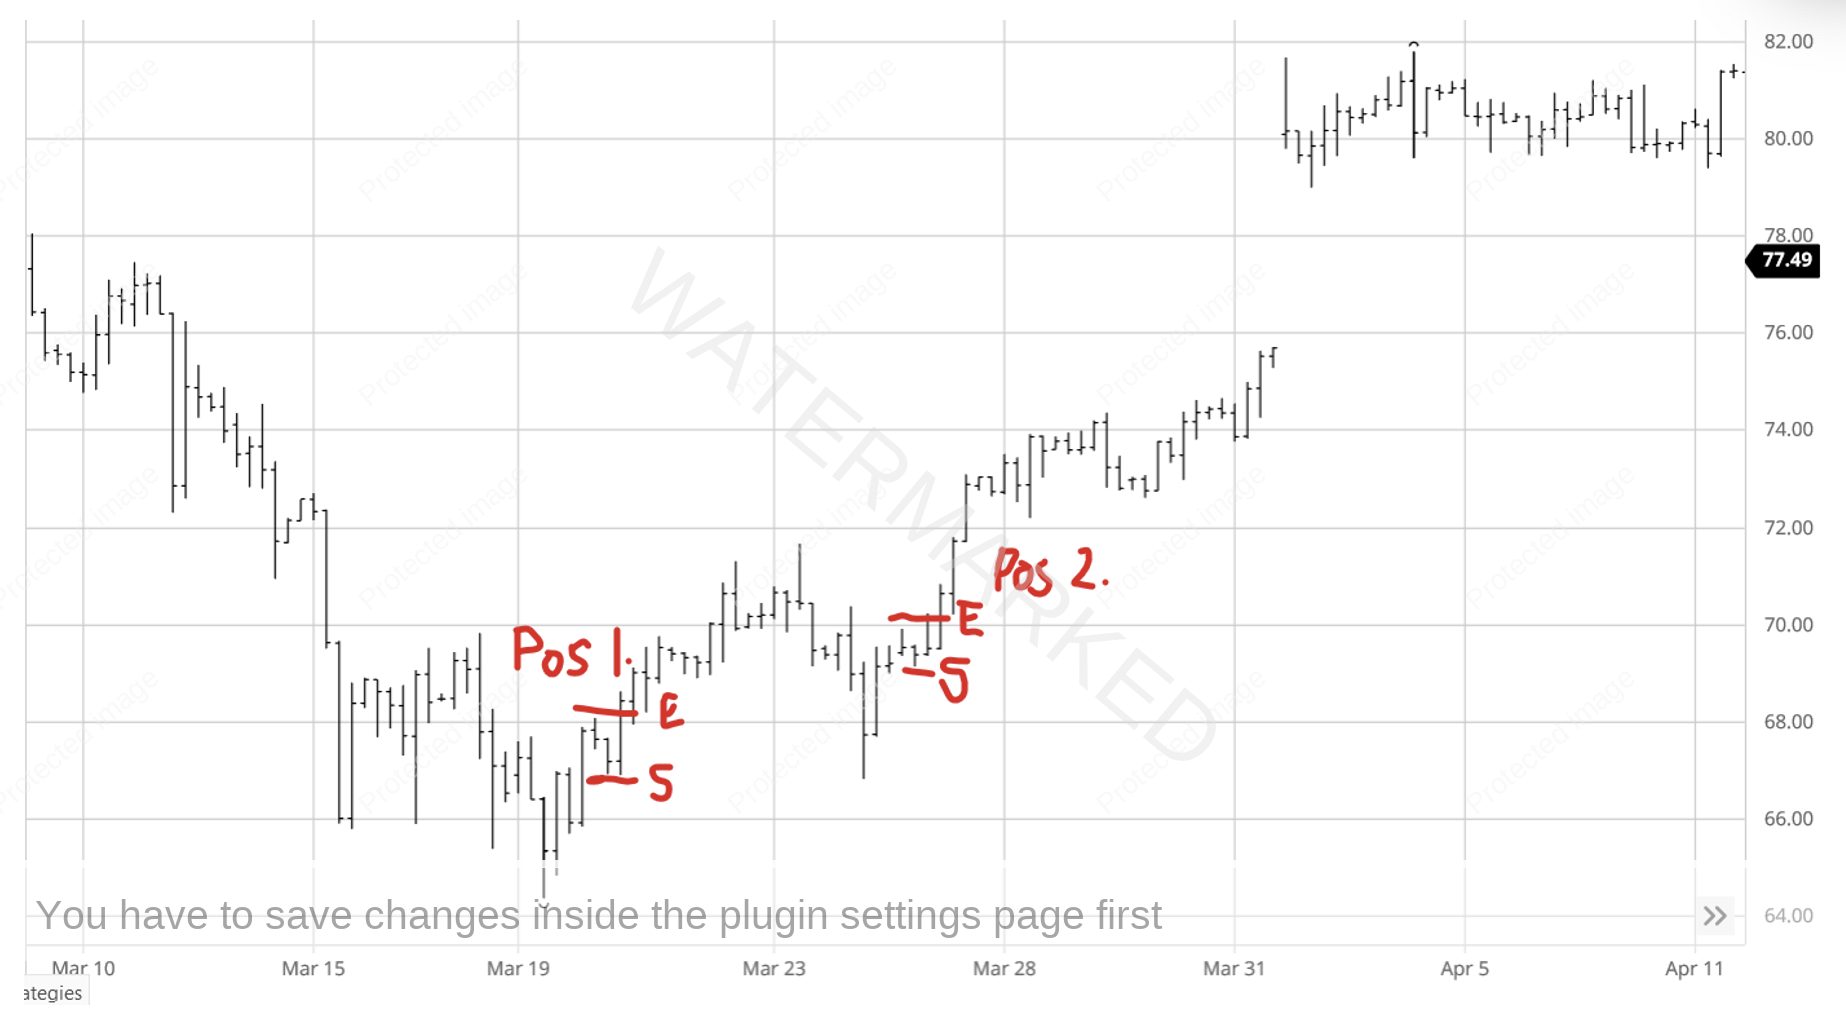
It would really pay to look at the 4-hour bar chart to identify any possible ways of entering into this market. In the below chart I have labelled two potential areas that are worth considering.
Chart 7 – 4 Hour Swing Chart Entries
Position 1:
Out of the extreme low, enter as the 4-hour First Range Out swing top is broken after the B-C retracement was less than 50%, with a stop 10 points behind the 4-hour swing low.
I sometimes experience and see very minor false breaks at times that just kick you out of a trade and then rocket off without you. In this instance, giving the market 10 points extra wiggle room kept you in the trade.
An entry at $68.09 and a stop at $66.80 gives a risk of $1.29 per contract or CFD.
Position 2:
Out of the Daily First Higher Swing Bottom, enter as the 4-hour First Range Out swing top is broken after the B-C retracement is less than 50%, with a stop 10 points behind Point C.
This entry at $69.93 with a stop at $69.03 gives a total risk of $0.90 per contract or CFD.
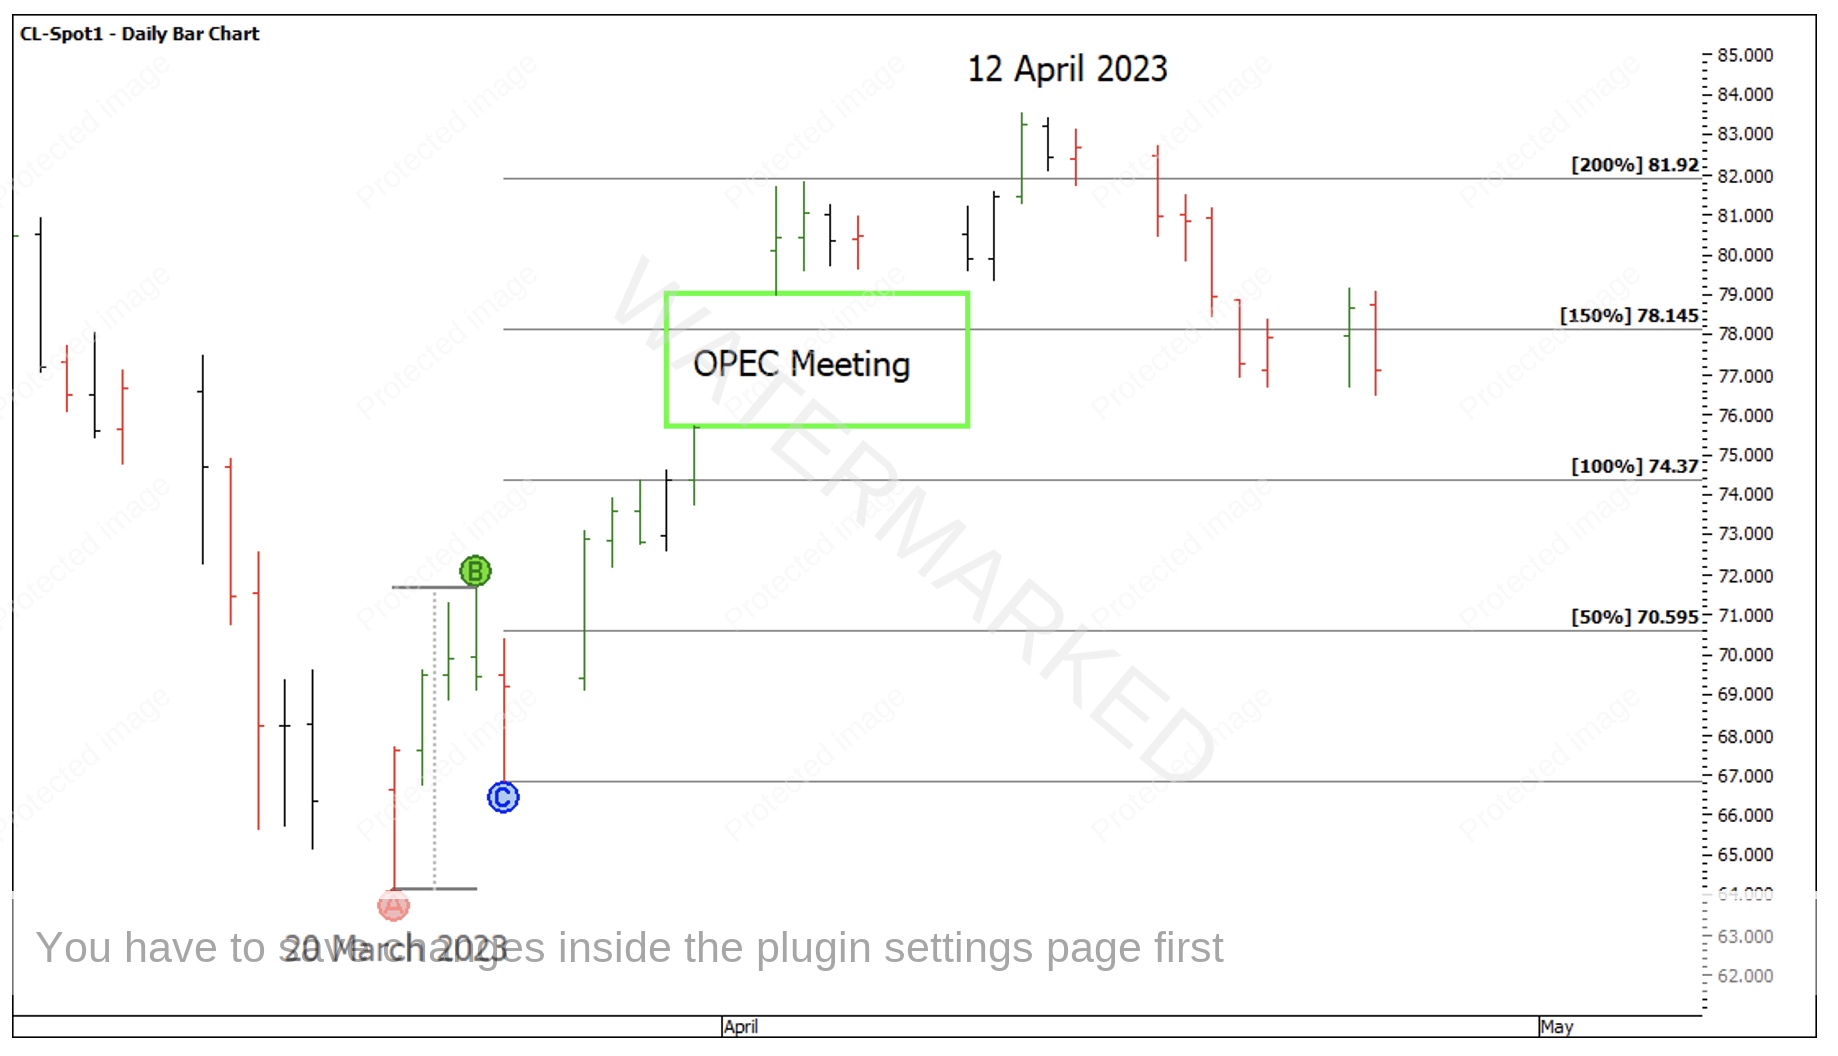
On 3 April 2023, Oil opened with a gap up after an announcement that Oil production was going to be reduced. After 5 narrow range trade days, Oil reached the 200% milestone and a potential profit target area.
Chart 8 – Daily First Range Out Milestones
Doing the sums based on a 200% milestone exit target:
Position 1: $81.92 – $68.09 = $13.83/1.29 = 10.7 to 1
Position 2: $81.92 – $69.93 = $11.99/0.90 = 13.3 to 1
Total Profit = $25.82 or 24 to 1!
Exiting a profitable trade can be hard, especially when you think you may be trading a monthly, quarterly or even yearly swing turn. However, if you bank profits at an area of probable short-term change in trend like the above 200% milestone, you can achieve your goal and sit out of any pullbacks and wait for the next trading opportunity to do it all over again.
Happy Trading
Gus Hingeley
