What You Can Measure You Can Manage
Welcome to the month of April and like me some of you are wondering where the year has gone! I have been flat out with the day-to-day humdrum of our family and business lives. This included celebrating an important milestone or anniversary you could say. The passing comment I would make often in seminars was if you don’t think anniversaries are important just forget one! This was typically taken to mean the big ones like weddings and the like.
Gann and David would talk about the power of anniversaries and markets can often drop you clues, insights or even “X marks the spot” information when defining the places to watch for changes in trend. To keep it even simpler the only way to really drive those 10, 20 or 30 X trades where X is risk, is to be comfortable identifying a change in trend on the bigger picture.
My eldest son has just turned 18, a major anniversary, and he is well on the way to developing an entrepreneurial mindset. He wants multiple streams of income so he can have a recession proof existence and a lot of this thinking he has developed on his own, but I imagine the charts on the walls he has been around since he was born may have rubbed off somewhere along the way. We have been having progressive discussions around trading (now that he can open his own account) and he asked me for some insights on the SPI which ended in a lesson I gave him on the simple shapes markets make.
I’ll share the task I gave him with the hope that it helps shape your own thinking around the challenges and often the simplicity that markets can deliver. The title of the article is also a give-away on the task as I picked this up from many that I have worked with over the years in different businesses.
If you can’t measure something you can’t manage it, now of course not all aspects of business are data-driven. Emotional intelligence is often just as important; however, financial markets are not big believers in your emotions, so we use the numbers to understand our plan of attack.
As students of history, we must be experts at measuring the historical data before we are any chance of interpreting its future importance.
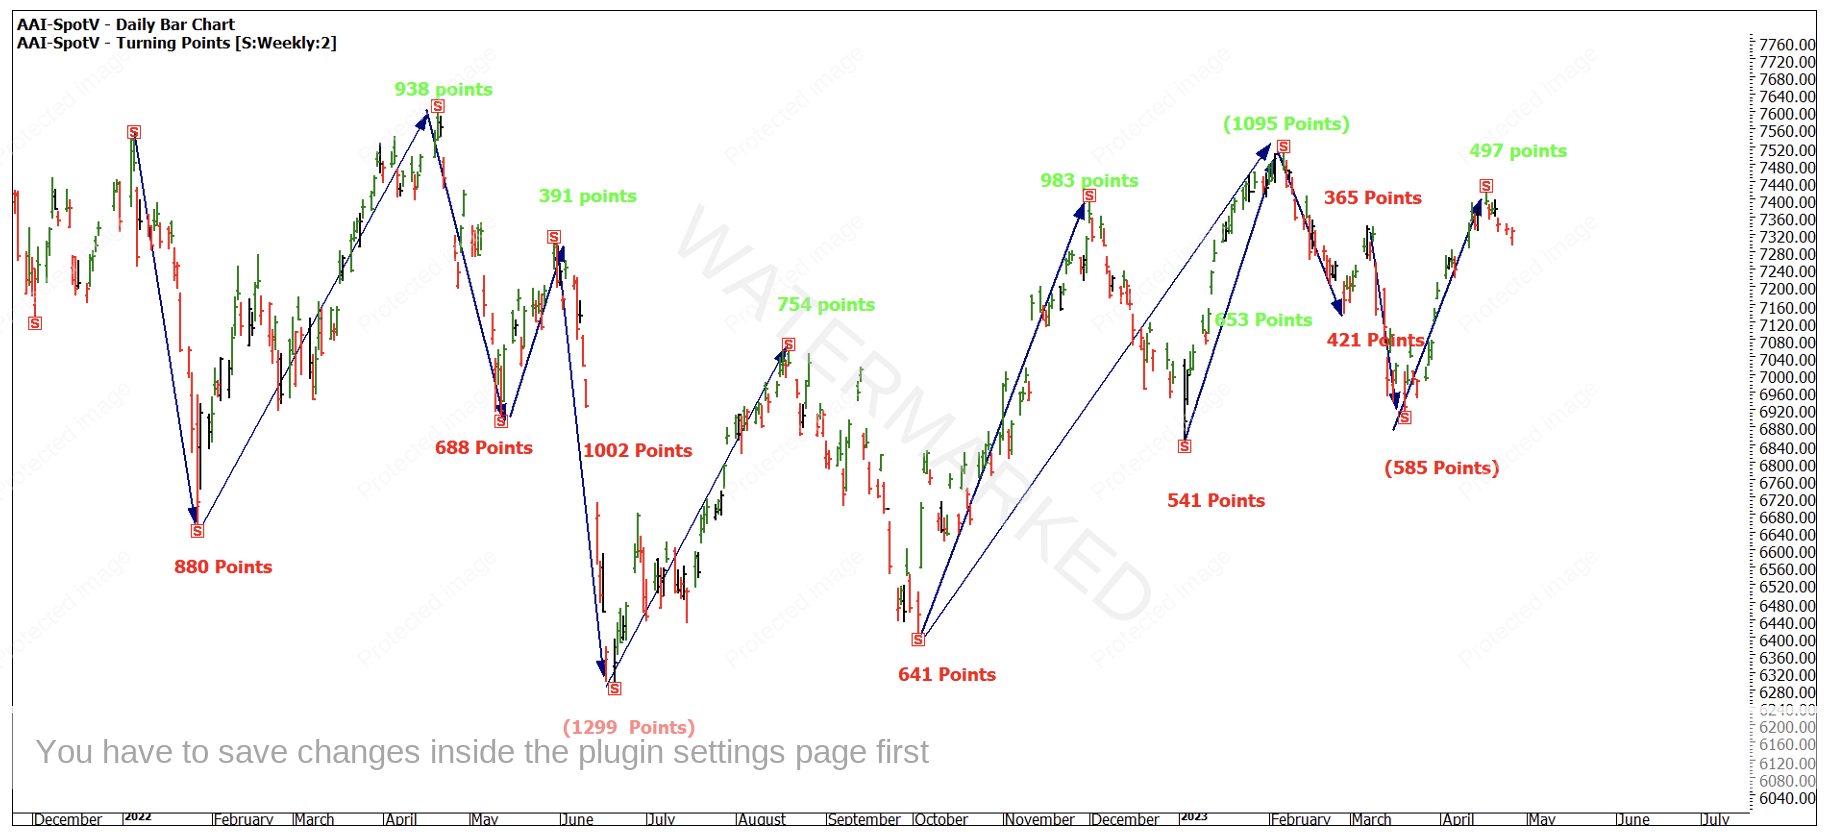
Chart 1 shows the SPI200 since the highs of 2022. January proved a volatile month and the market shed 13% of its value in less than a month.
Chart 1 – Daily Bar Chart AAI-Spotv
In most cases the 2-week turning point tool (from a 2-week swing chart) has captured all the major turns. That is not enough as there are a couple of smaller ranges within larger ranges (Wheels within Wheels) that are of value to us as well.
Imagine there was no software to measure ranges quickly and this was a process of dragging ranges off a hand drawn chart. The numbers as you transcribe them onto a data sheet or trading book (like David did) cement in the brain in that process.
You should also learn to understand what is normal or abnormal when it comes to ranges to understand if the market can repeat or has it run too far one way or the other to repeat again.
The exercise I set up for my son was to make some projections around the current March to April 2023 run on the SPI. Will the 17th of April high be taken out in the next leg up? If so, where would you expect the pullback to find support? If your analysis is correct, how would you trade it?
A quick study will see several simple clues.
- ranges are repeating or very close to it.
- The price ranges are numbers we have been told to look for eg 365, 540.
- Many are percentages of each other i.e., 50% or 150%
What we are doing is all work from David’s Price Forecasting lessons from the Number One Trading Plan. This text was the one that really got me excited early on and can often be less utilised when there is a rush to succeed.
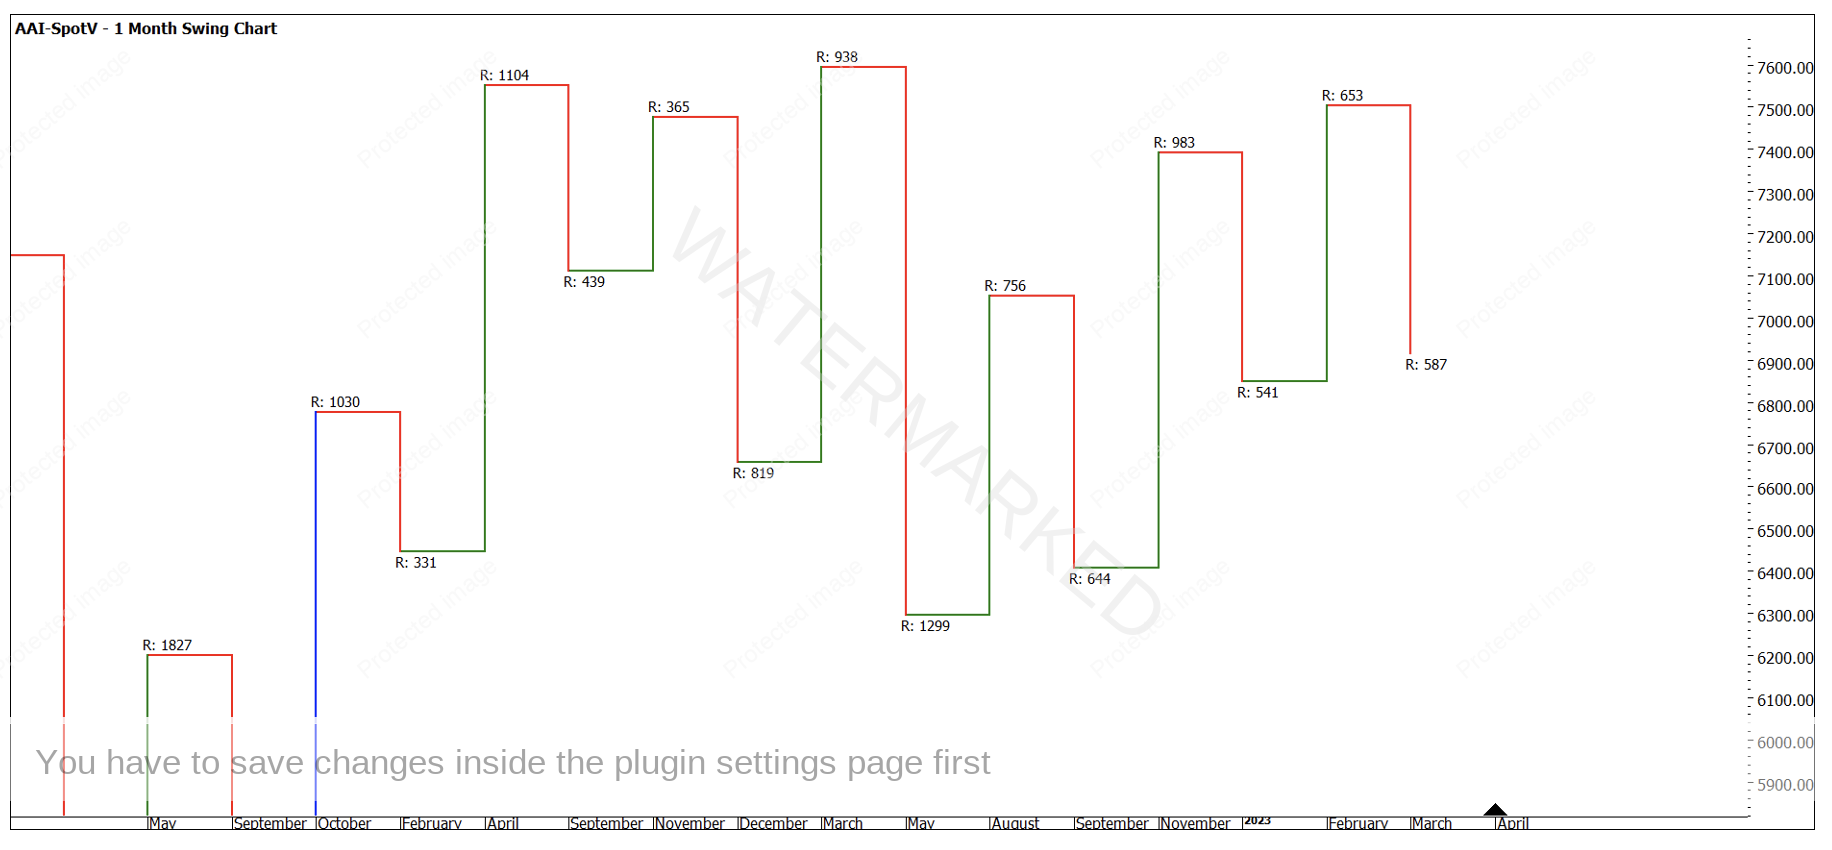
Chart 2 is the SPI200 again as a monthly swing chart. Given I have manually measured ranges there are some small discrepancies between the two charts. We see the market is in an uptrend with 3 clear up swings since the low in May 2022. The current upswing is contracting, and the downswing is expanding.
Chart 2 – Monthly Swing Chart AAI-Spotv
How confident are we that the next swing will be strong enough to break the previous high? We don’t really have to have an opinion right now; we just need to have scenarios that ask what if? If this happens, how will my trading plan come into play? Now that we have measured it, we can manage it.
We can add further analysis but with the same principles, we can obtain the data and then sit back and interpret the next actions. Could we measure the ranges in Time as well as Price? What do the Lows and High’s Resistance Cards for this market tell us?
Given the state of the world and all the crazy headlines we see daily, it’s hard to know what cycle we are in for humanity; are we growing and expanding, or are we shrinking and contracting? If we can measure the swings, we have a much better chance to see the bigger changes in trend rather than the day-to-day noise.
Your challenge is to add further analysis over the top and test how you could have traded this market over the last 18 months. The SPI can be a challenging market when it moves sideways, that last 18 months have offered long and short trades and given us trends. My wish is for boring consistent trends that repeat and repeat, until then I will have to keep measuring to manage.
Good Trading
Aaron Lynch

