The SPI Doing SPI Things!
The next best thing to making money is not losing it, so when the next high quality trading opportunity comes around, you’re starting off with a strong capital and emotional base.
This brings me to the SPI and its most recent movements that have been a bit sideways for the past two weeks. However, that doesn’t mean there wasn’t a decent trading opportunity that returned a 10 to 1 Reward to Risk Ratio.
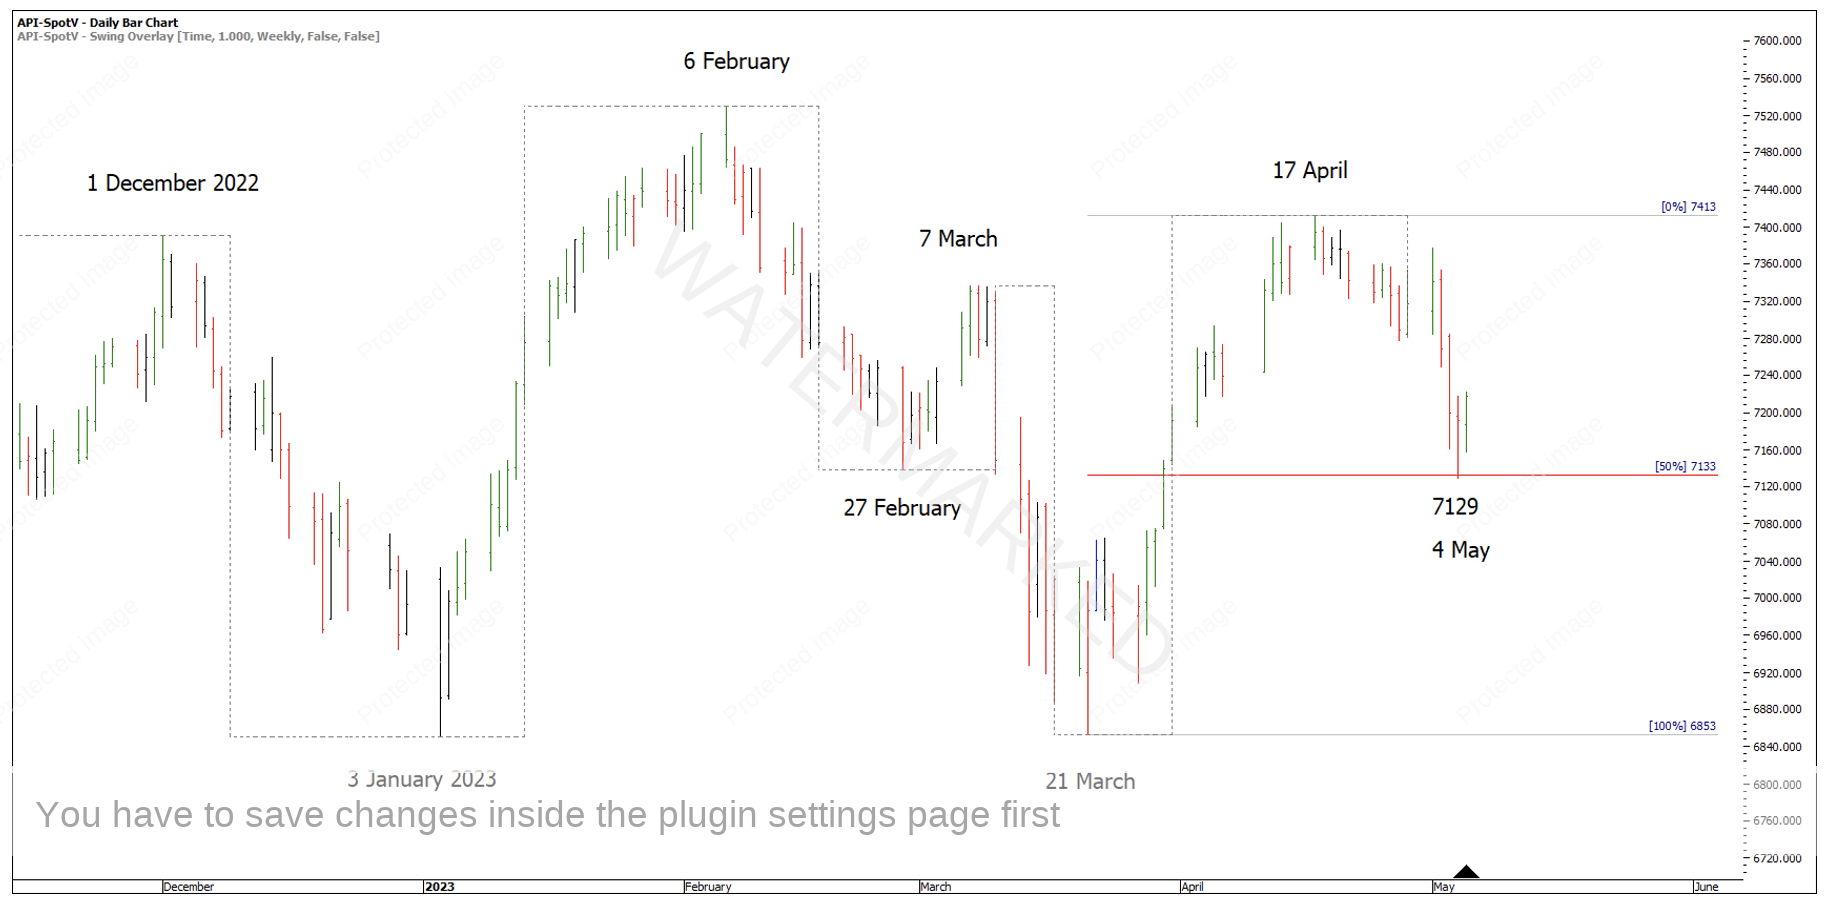
The SPI made a low on 4 May 2023 at 7129 which is within 4 points of an exact 50% retracement of the weekly swing. Looking at some of the recent monthly turning points, the early in the month Time by Degrees dates have been producing regular turns. See Chart 1 below.
Chart 1 – 4 May Low
Before you read on, feel free to do your own analysis to identify a cluster and how you may have traded it. As you will see, if you had entered into the market on Friday 5 May, you could have exited the following Monday with a 10 to 1 Reward to Risk Ratio profit.
I’m not saying you would have known to exit on the Monday, but if part of your trading strategy was to bank profits at 10 to 1, then it was possible!
But don’t take my word for it! If you’re interested, open up the SPI200 June 2023 futures contract in barchart.com and set the chart to a 4-hour bar chart and see for yourself.
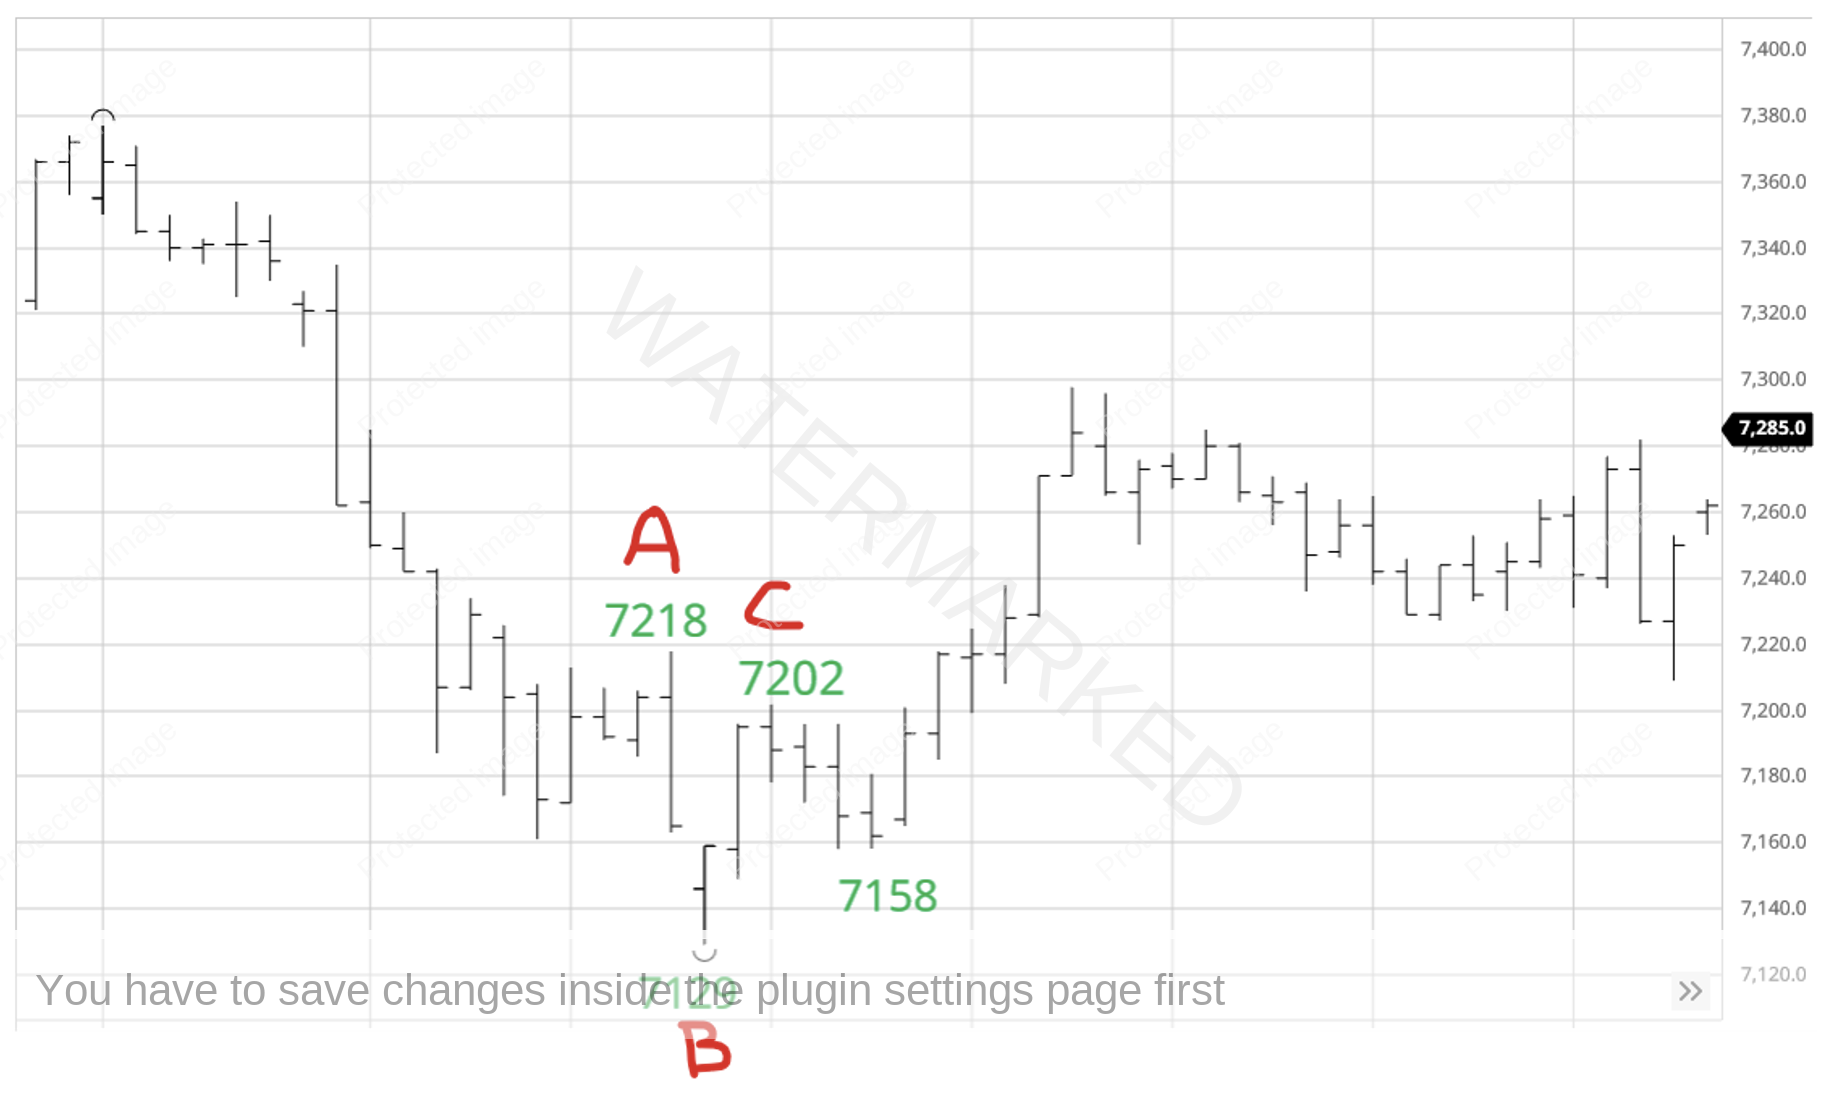
Chart 2 – 4 Hour First Range Out
After an initial 4 May low, the SPI put in a 73 point, 4 hour First Range Out followed by a 44 point retracement or Retest. Looking at where the First Higher Bottom might come in, you could use a Gann retracement tool or the previous range milestones.
An exact 50% retracement would have been 7166, or 50% of the above ABC would be 7158 (rounding up to the nearest point).
In this case the SPI lowed exactly on 7158. So, how could you have known that the 4-hour swing was over? You could drop down a time frame and look for signs of completion on a 1-hour swing chart.
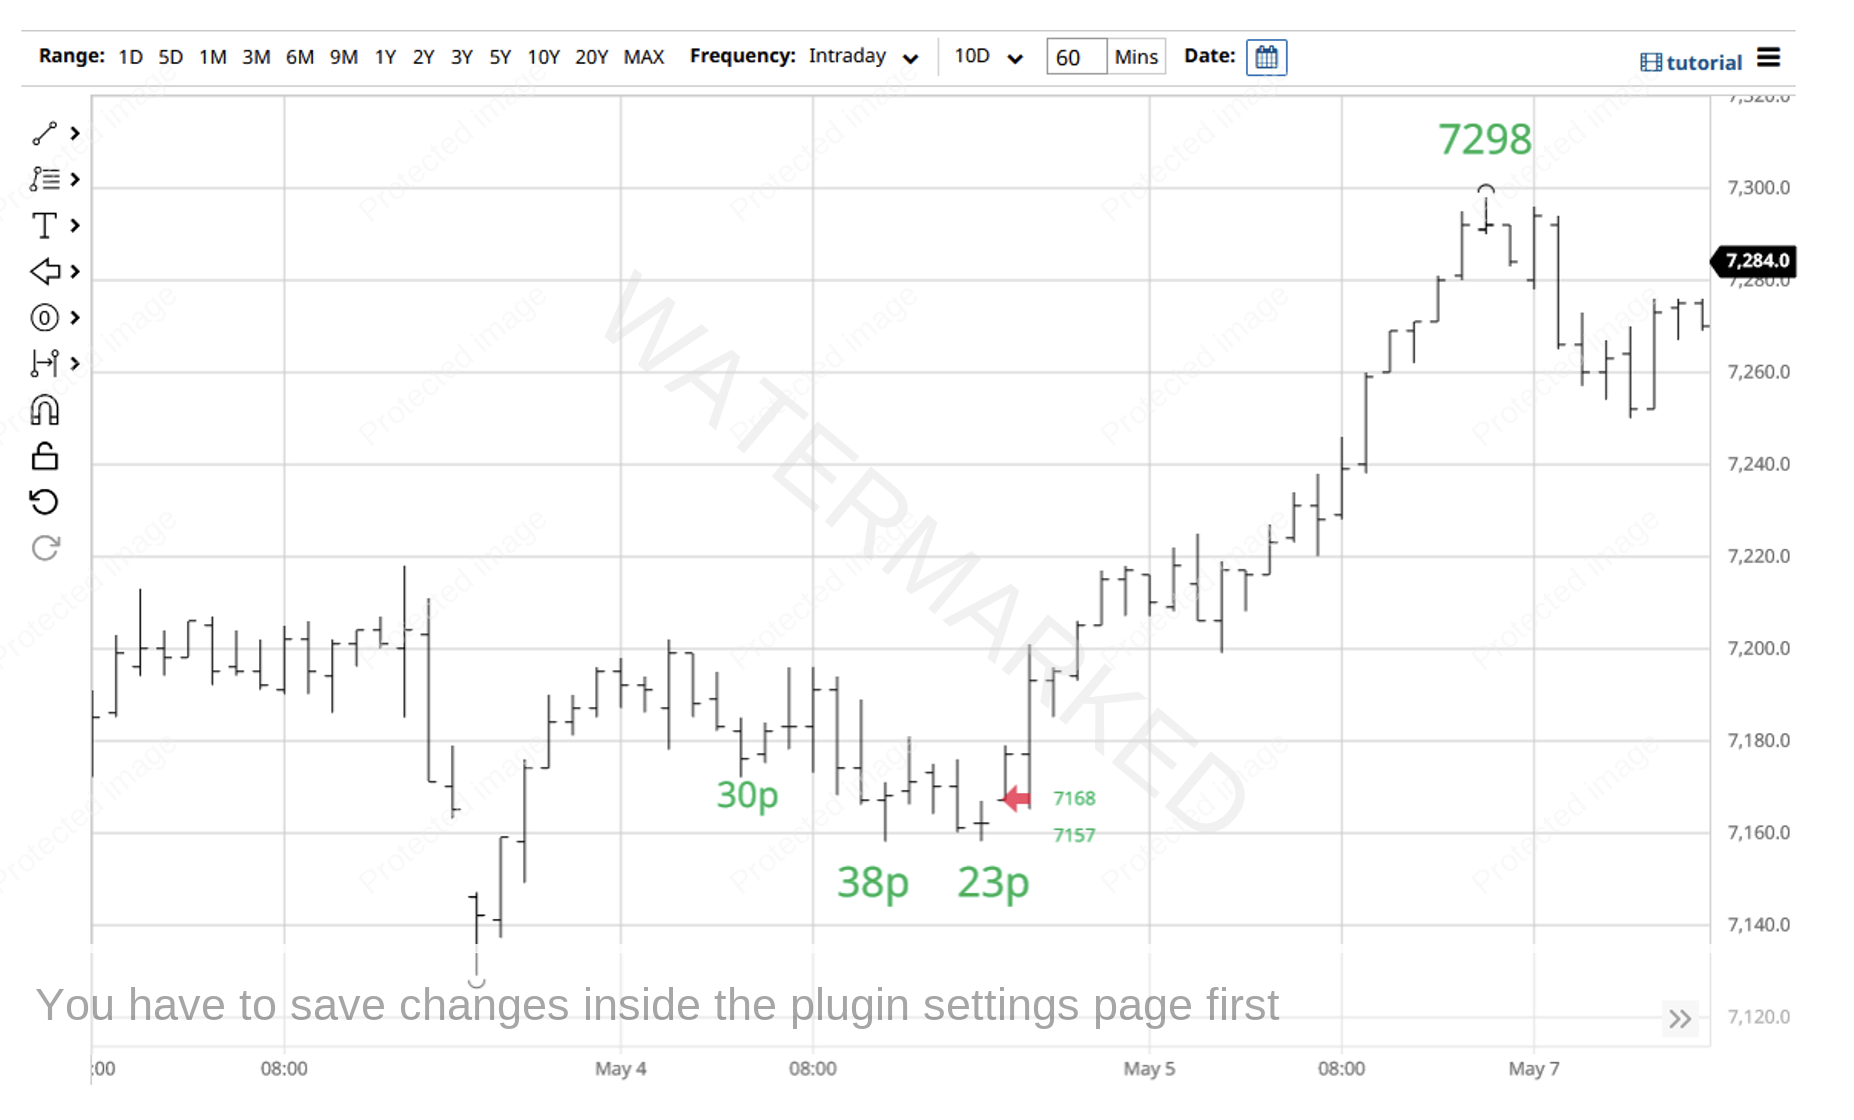
It really is worth studying Chart 3 below, applying form reading skills like Sections of the Market, and identifying other key milestones that form the cluster around 7158. I see elements such as three, 1-hour sections down, double bottoms and a repeating 1-hour swing range into the low to name a few. Also, a very small 1-hour entry bar that would have given you 11 points of risk if you had entered as the 1-hour swing chart turned up.
With an entry at 7168, and a stop at 7157 (11 points) the SPI only has to move 110 points to take a 10 to 1 trade. Target = 7168 + 110 = 7278. The market made an interim high at 7298 on Monday 8 May.
Chart 3 – 1 Hour Bar Chart Entry
The SPI has been in a narrow trading range since then, showing us expanding daily swings in both directions. With such a lacklustre move out of the 4 May low, either the SPI just isn’t ready to go up or this up move just isn’t going to be a strong one.
With the ability to sit out and wait for a better trade opportunity, we can watch for our next Time by Degrees dates and see if they eventuate into a Classic Gann Setup.
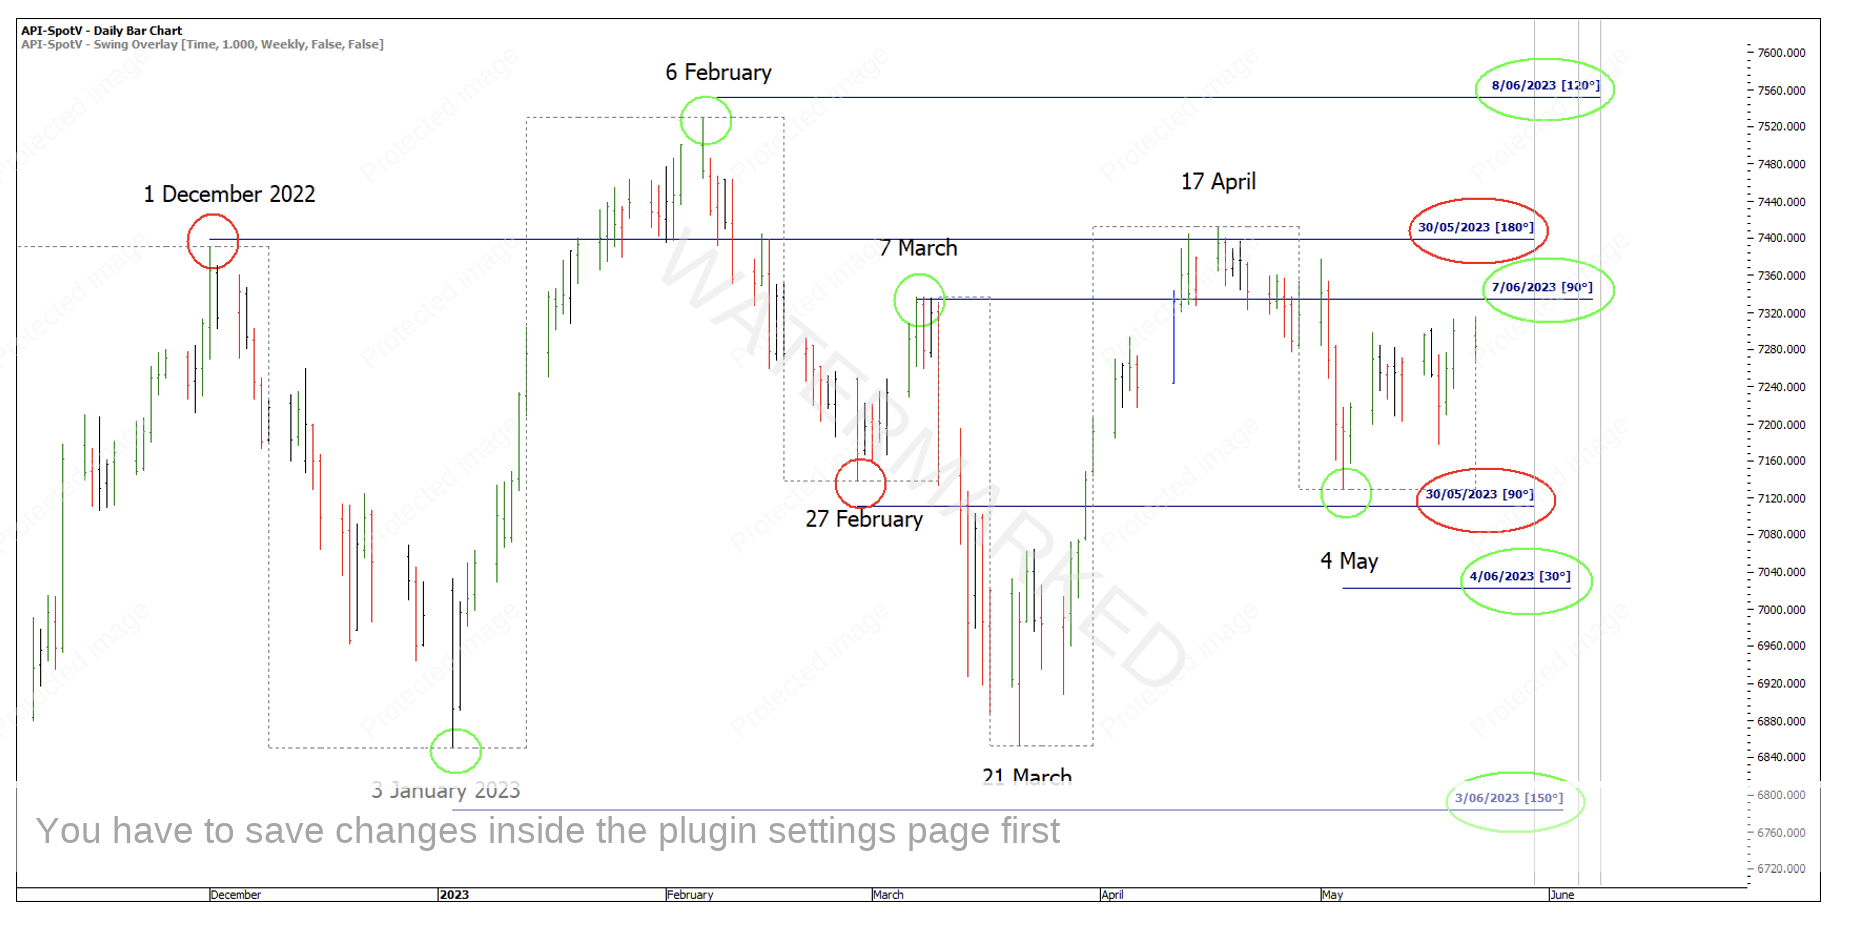
The next two areas of interest for me will be the 90 and 180 degree points giving 30 May (Circled in Red), and the Green Time by Degree dates ranging from 3 June to 8 June. Considering June 3 and 4 is a weekend, and the exact 15 degree point is Tuesday, 6 June, I prefer to use June 5 to 8 as my window. The swing charts at the time will tell us if we’re looking for a top or bottom!
Chart 4 – Next Key Time by Degree Dates
Happy Trading
Gus Hingeley


