A Cycle of Time
In the W.D. Gann Stock Market Course, W.D. Gann summarises each year within the decade as to what kind of market to expect. We are now in the third year of this decade which W.D. Gann describes as;
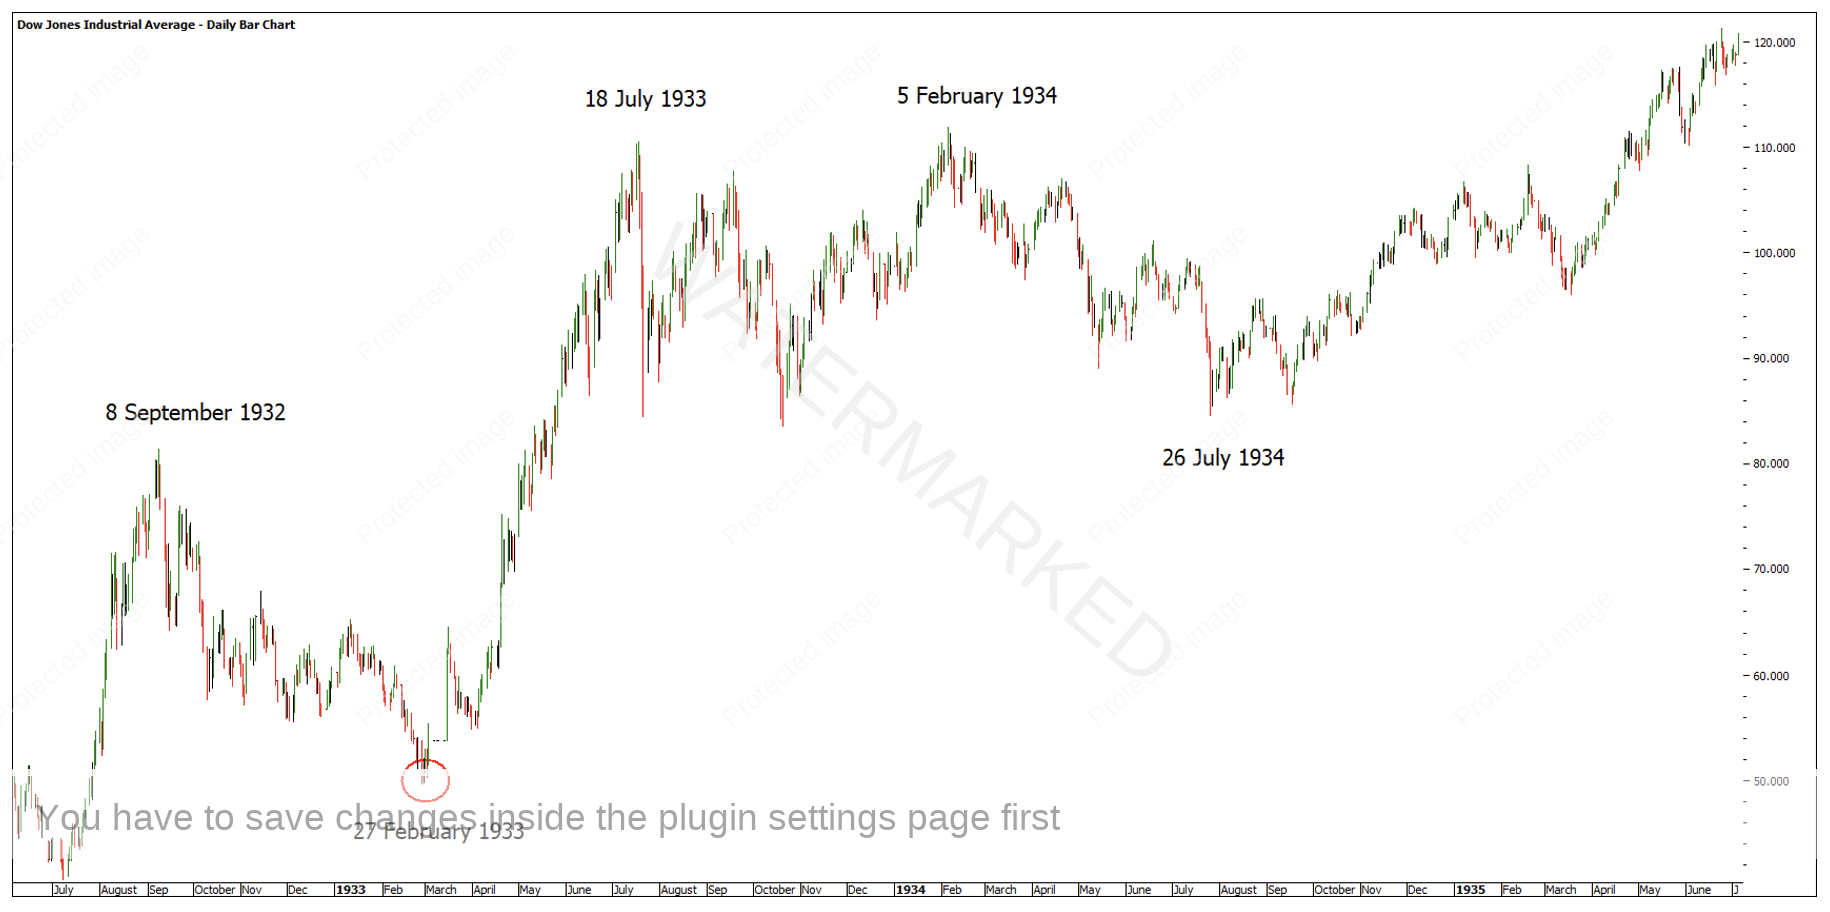
“…..Starts a bear year, but the rally from the second year may run to March or April before culmination, or a decline from the second year may run down and make bottom in February or March, like 1933”
His explanation for the fourth year in the decade is:
“The fourth year is a bear year, but ends the bear cycle and lays the foundation for a bull market”.
There are always exceptions to the rule but if you go back over the entire history of the Dow Jones (ticker code INDU), you can look at 113 years of data and decide for yourself how accurate the above statements are. W.D. Gann suggests that we look at 1933 which is in Chart 1 below.
Chart 1 – Dow Jones Industrial Average 1933 – 1935
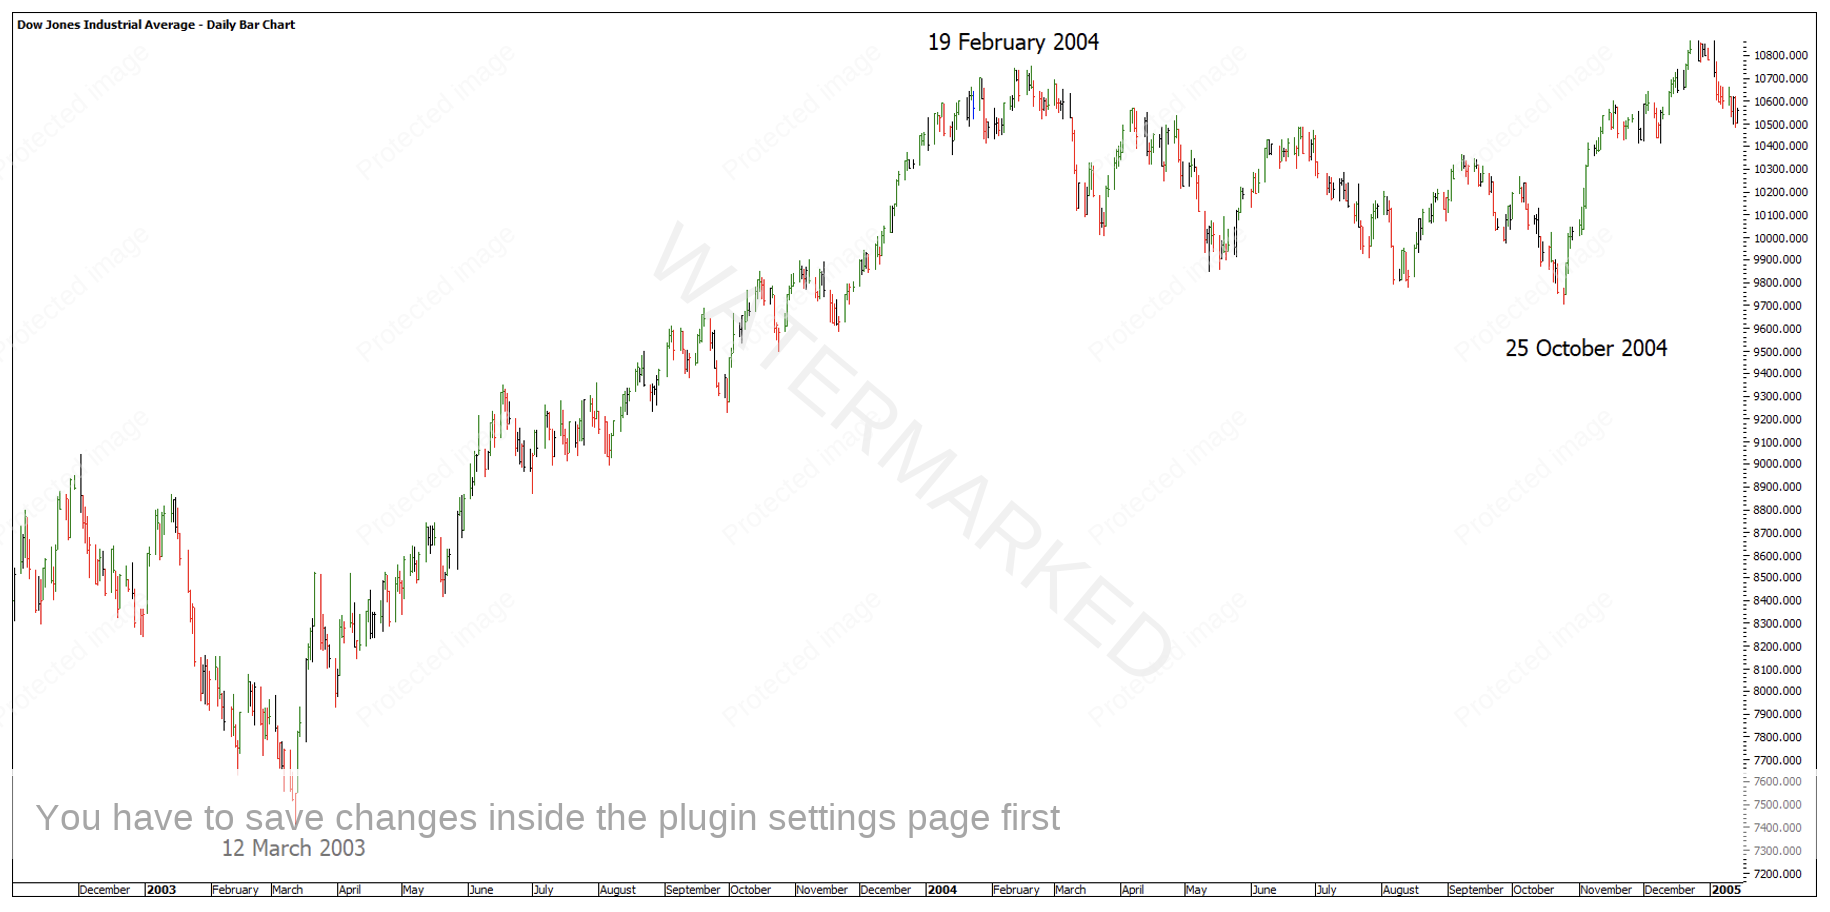
2003 to 2004 is another example of a March low and rally, followed by a 2004 bear market year.
Chart 2 – Dow Jones Industrial Average 2003 to 2005
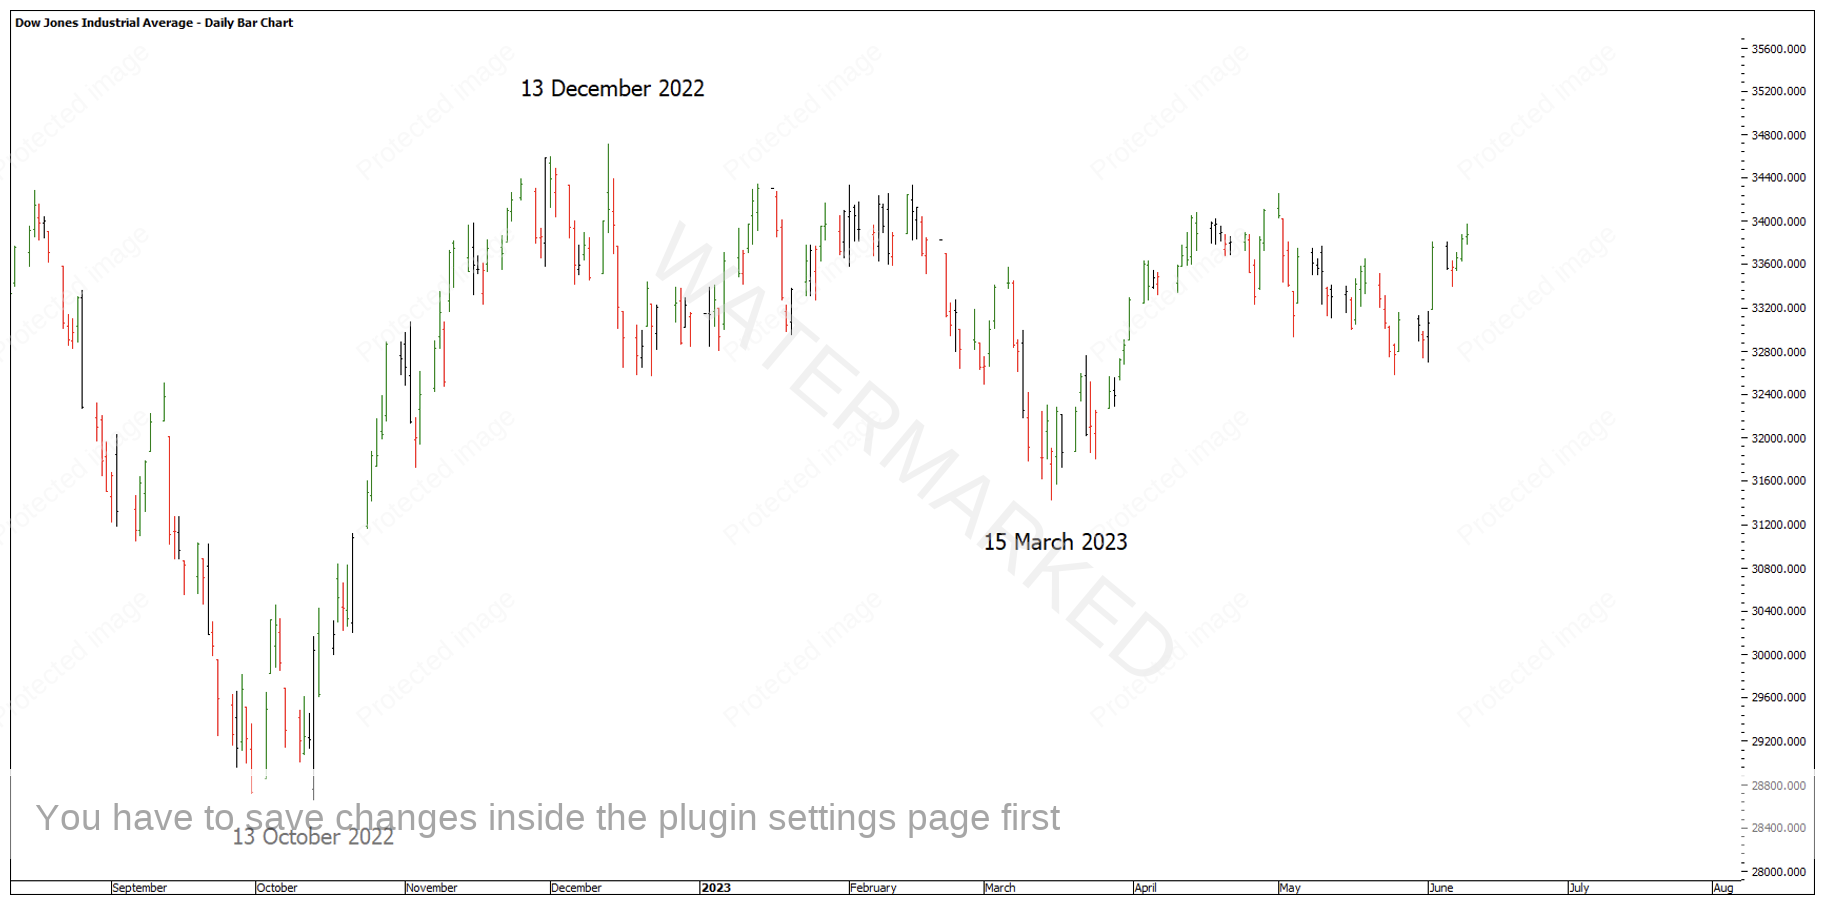
Looking at the current year on the Dow Jones, this seems to fit the bill of “a decline from the second year may run down and make bottom in February or March”.
Chart 3 – Dow Jones Industrial Average 2022 to 2023
As the Dow Jones and the SPI200 futures are different markets, I think it’s necessary to analyse them independently.
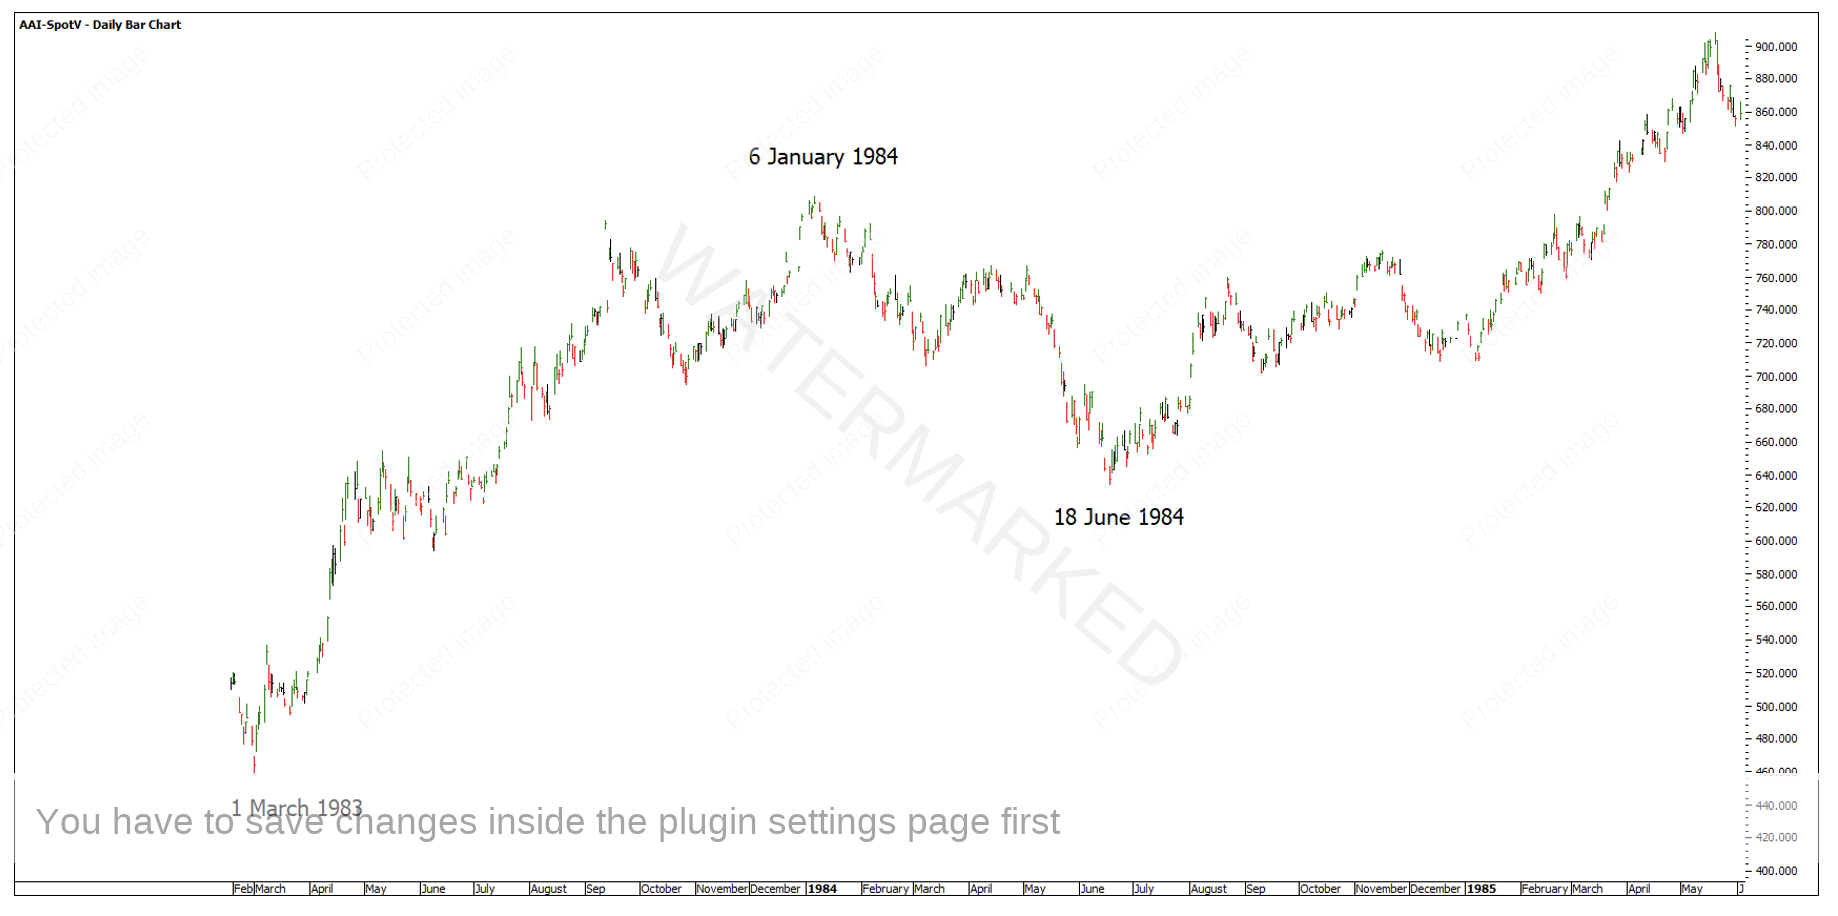
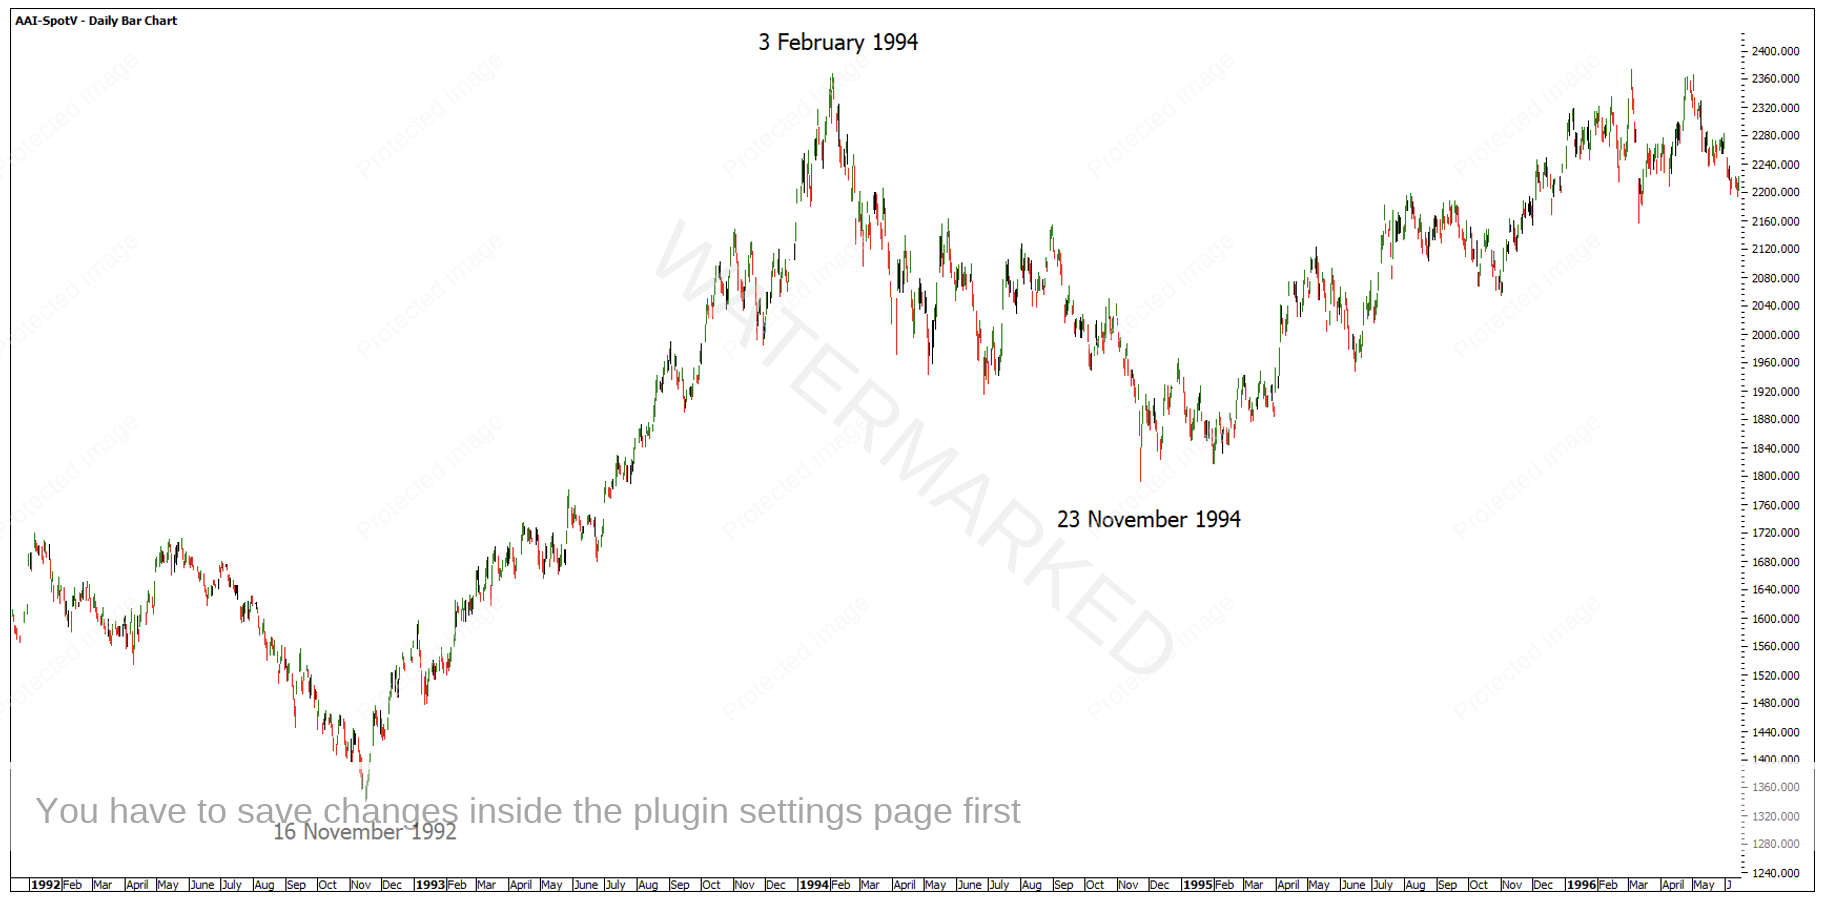
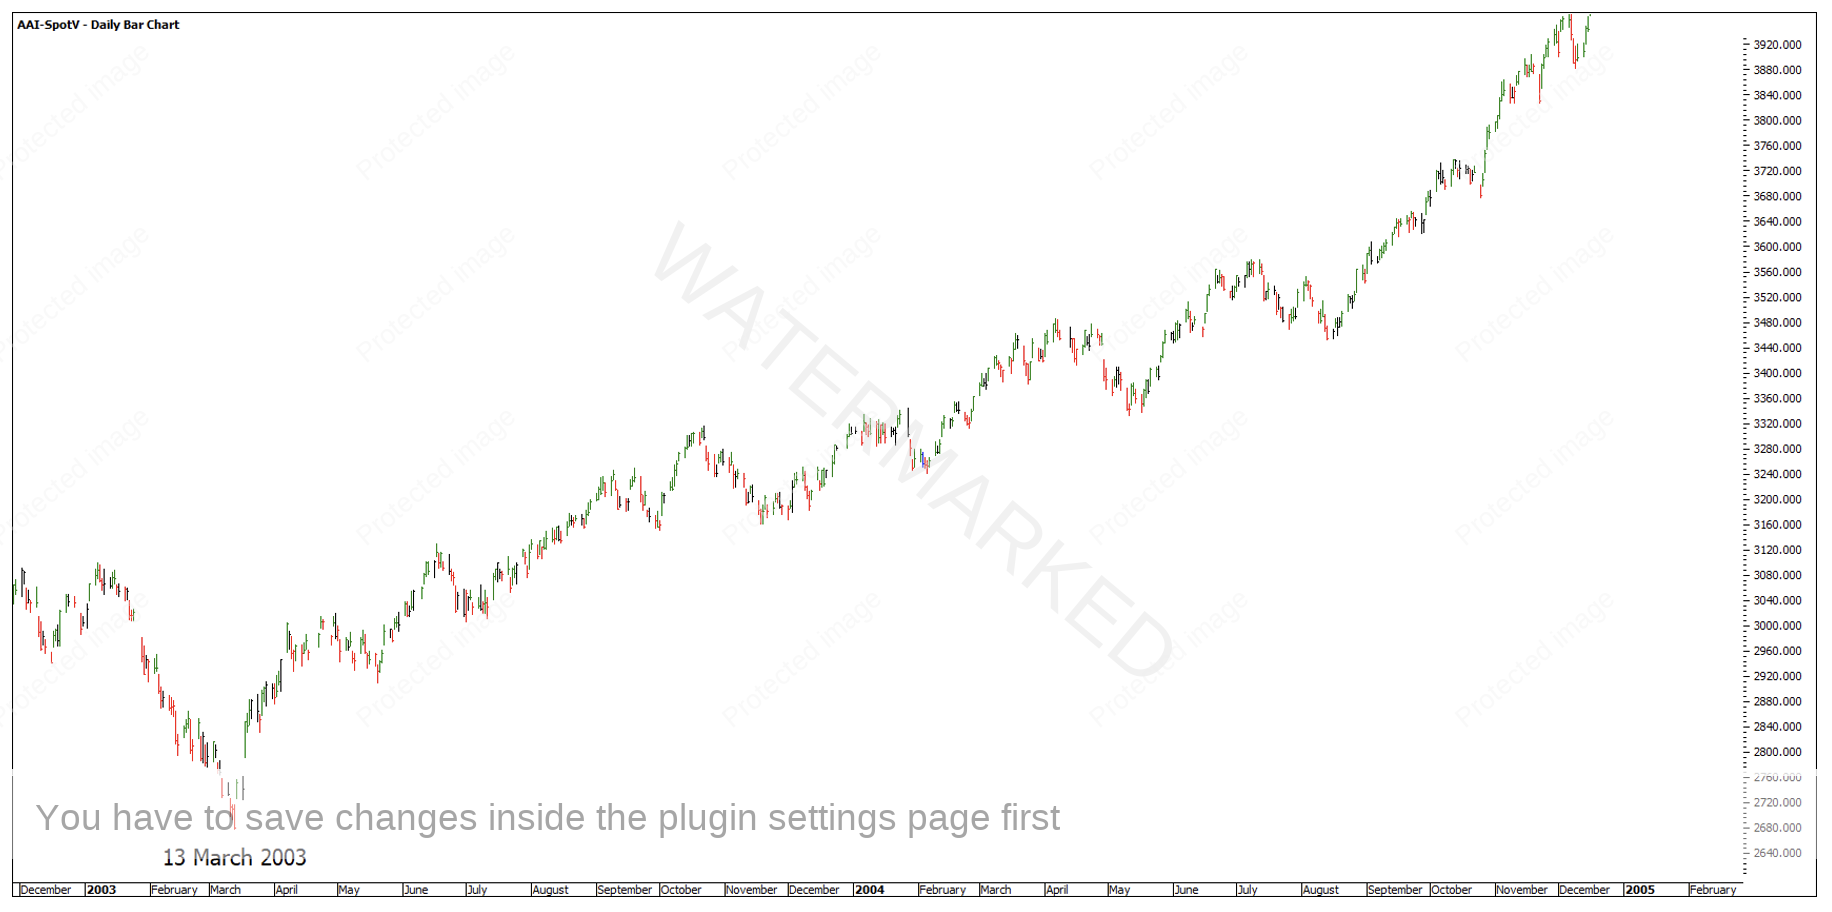
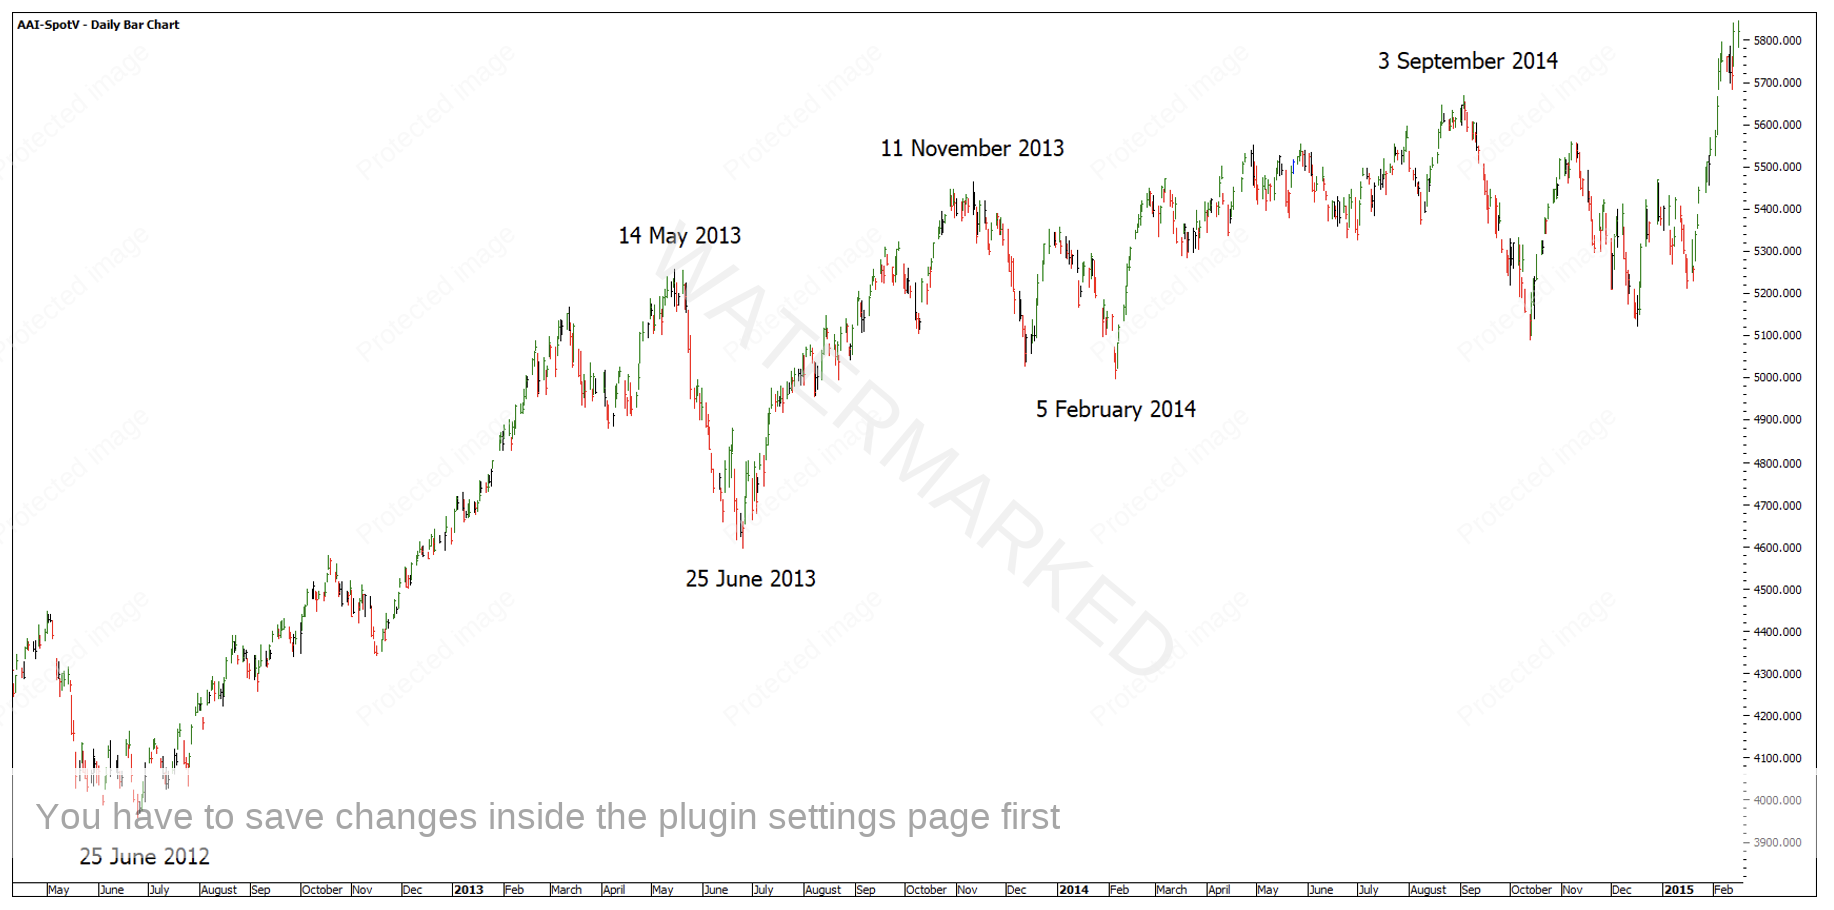
The below charts show the past 4 decades on the SPI200.
Chart 4 – 1983 to 1985
Chart 5 – 1992 to 1996
Chart 6 – 2003 to 2005
Chart 7 – 2012 to 2015
The main things noticed are:
1983 – Bull Market – 1984 Bear Market
1993 – Bull Market – 1994 Bear Market
2003 – Bull Market – 2004 Bull Market
2013 – Bull/Bear Market – 2014 Bull/Bear Market
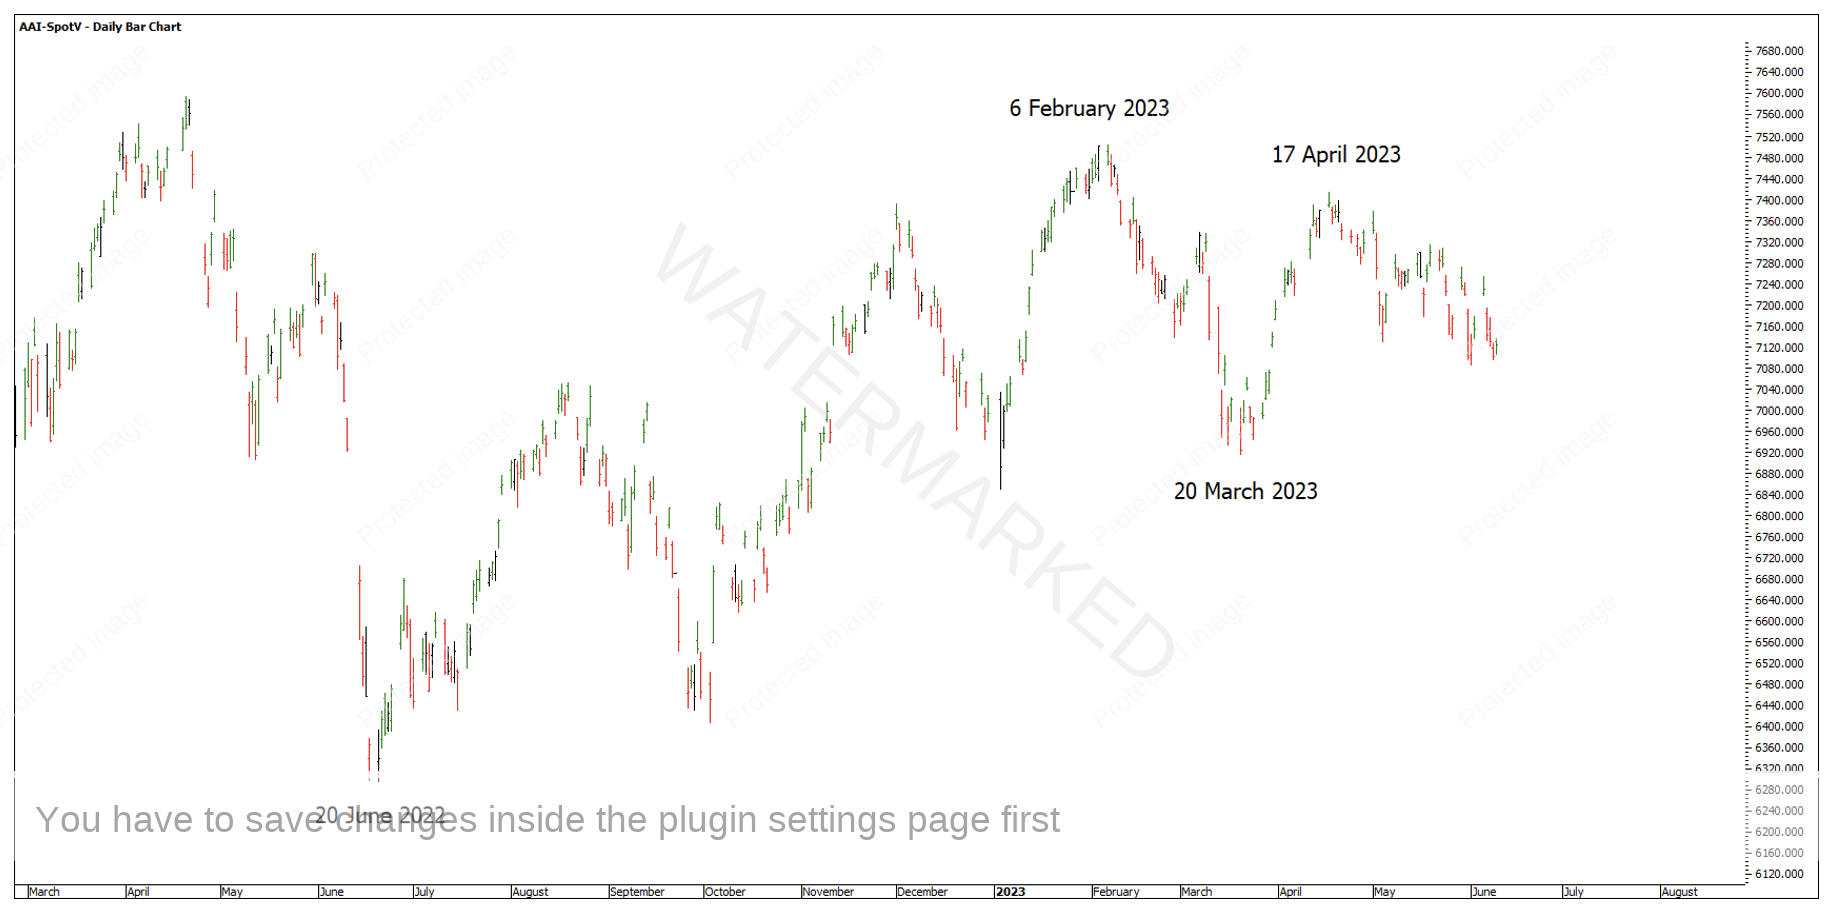
Like 2012 – 2013, the SPI has made a June 2022 low, followed by a few clean sections, however the overall direction has been a sideways trend for the best part of 2 years. The pattern of the SPI is also a bit different to that of the Dow Jones.
Chart 8 – 2022 to Current Market
Master Time Cycles gives you a broad roadmap for the year ahead, although you need more than that to get within 10-20 points of a daily, weekly or monthly turning point, or Classic Gann Setup, to execute a high Reward to Risk Ratio trade.
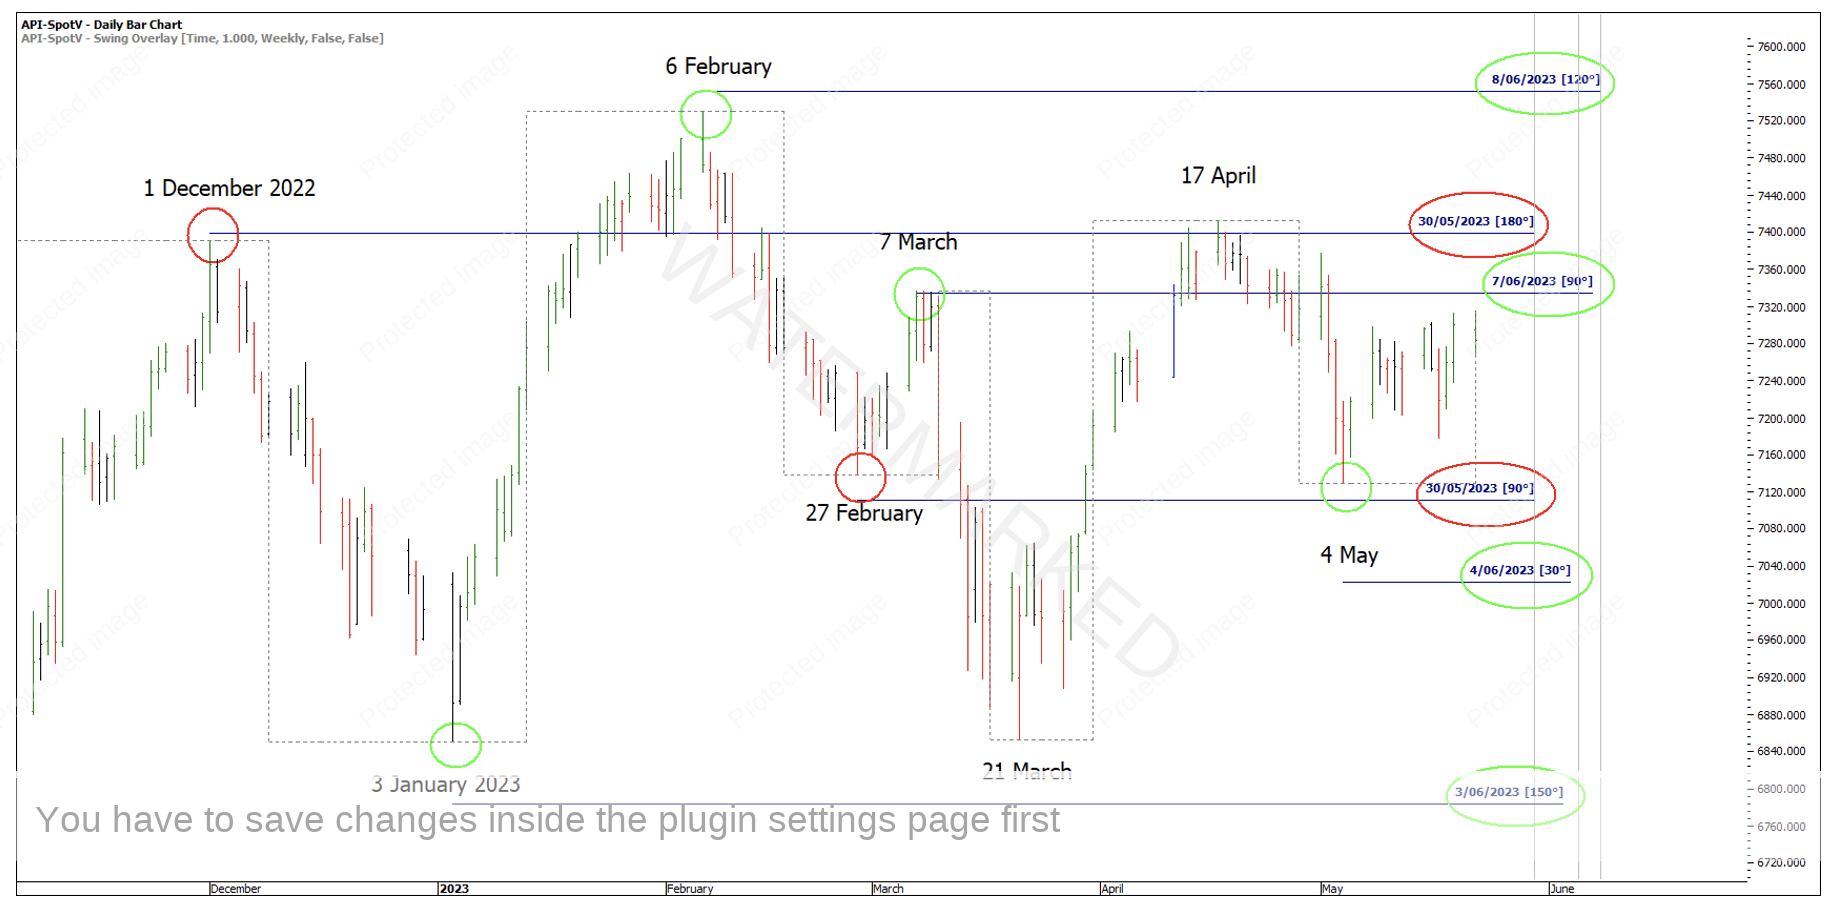
Referencing last month’s Platinum article, the next key Time by Degree dates to watch were 30 May and 6 June.
Chart 9 – Time by Degree Dates
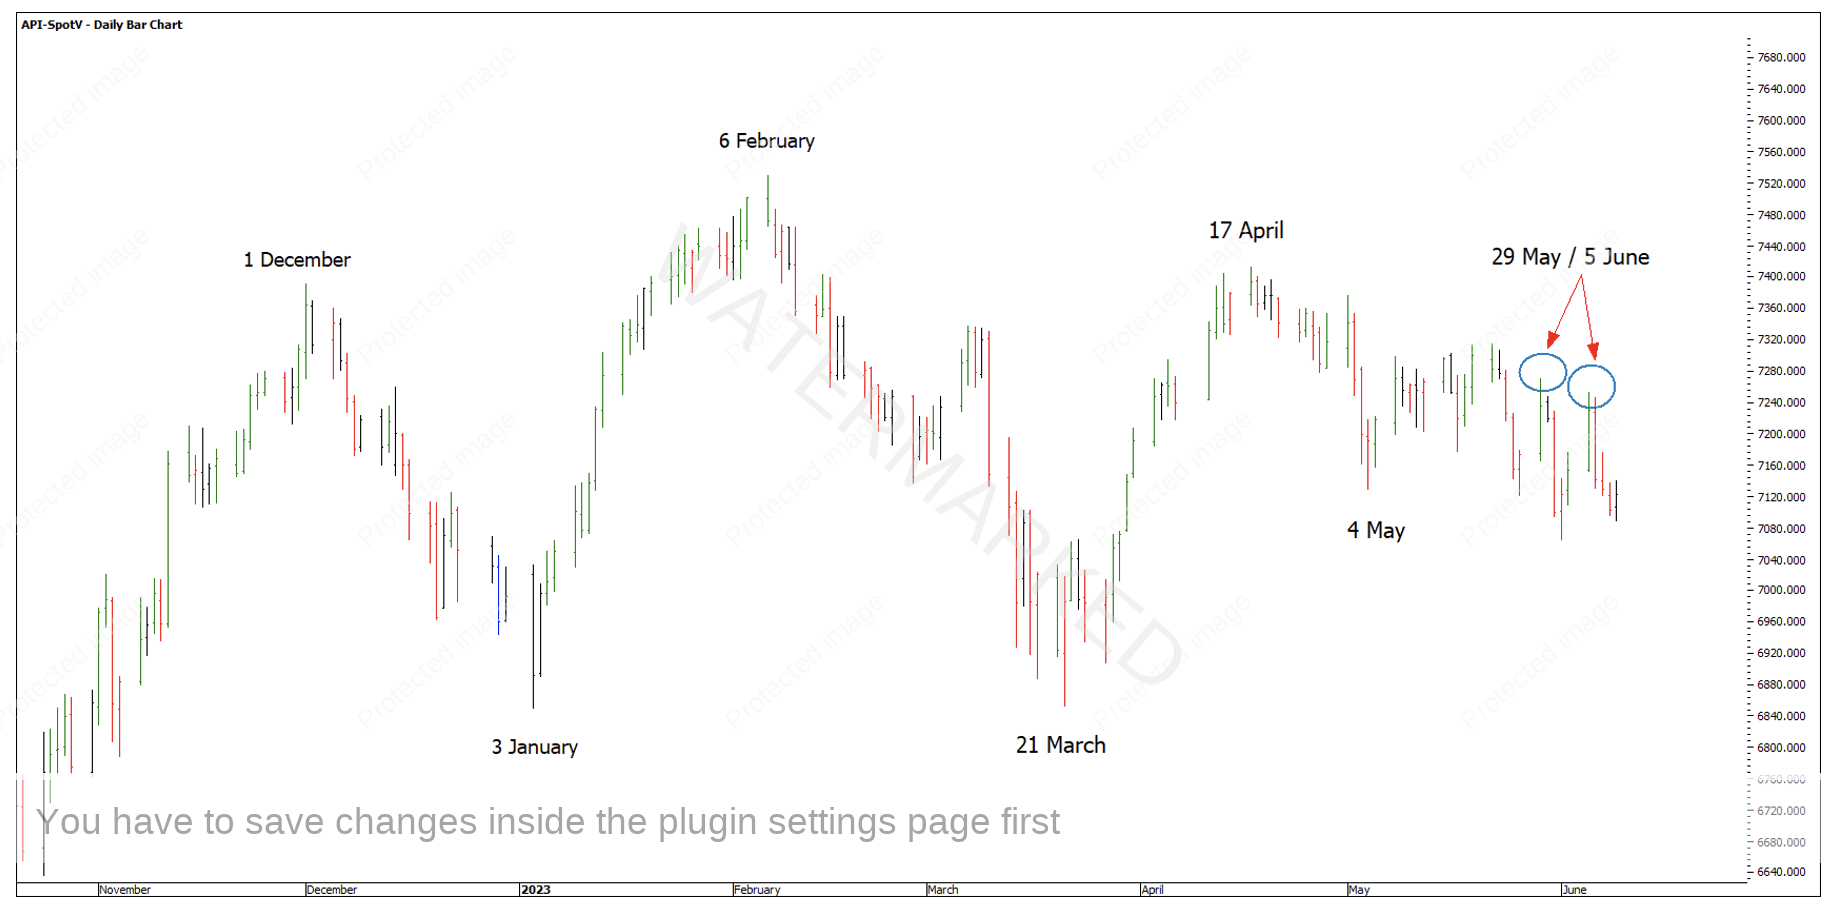
At first glance these two Time by Degree dates seem to have been daily lower swing tops and don’t provide us with a clear Classic Gann Setup.
Chart 10 – Time by Degrees
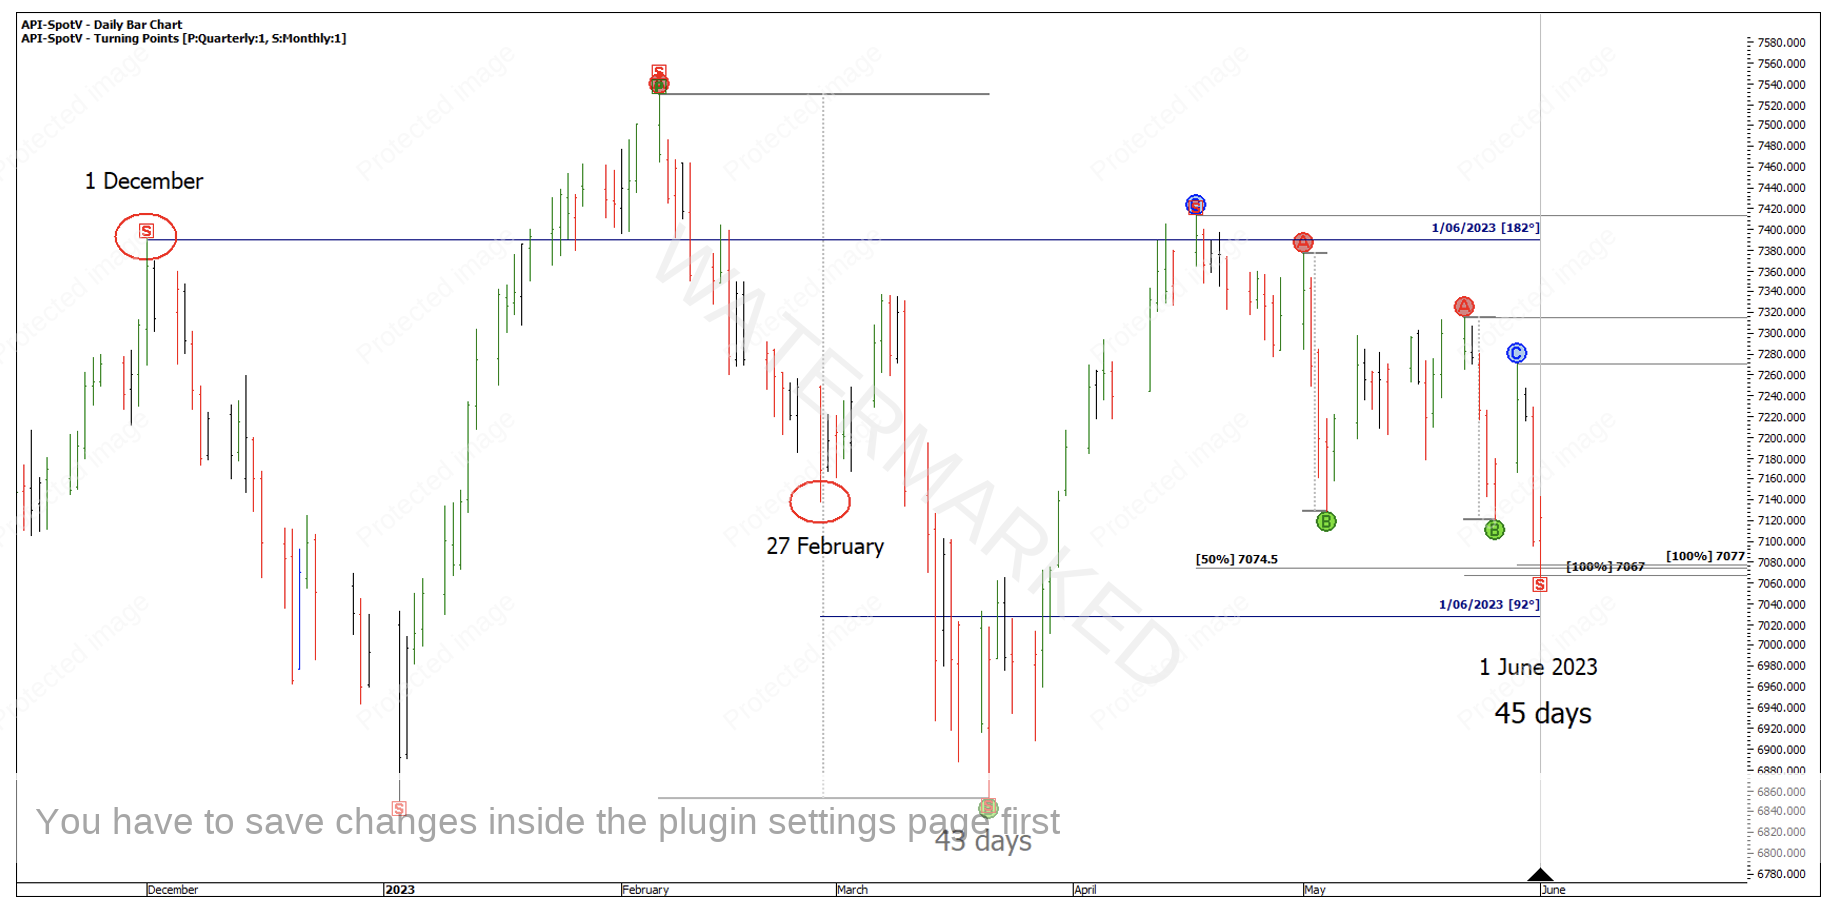
However, could the 1 June low be the 90 and 180 turning points that came in two days late? Using Price Forecasting there is a potential cluster at:
- 50% of the previous monthly swing down at 7074.5
- 100% in time of the monthly swing of 45 days compared with 43 days
- 100% of weekly section two at 7067
- 100% of the last daily swing at 7077
Chart 11 – Classic Gann Setup?
A ‘textbook entry into this trade proved slightly more difficult with the smaller 4 hour and 1 hour swing charts showing expanding ranges to the downside. This followed by a deep daily swing retracement may have proved hard to hang into.
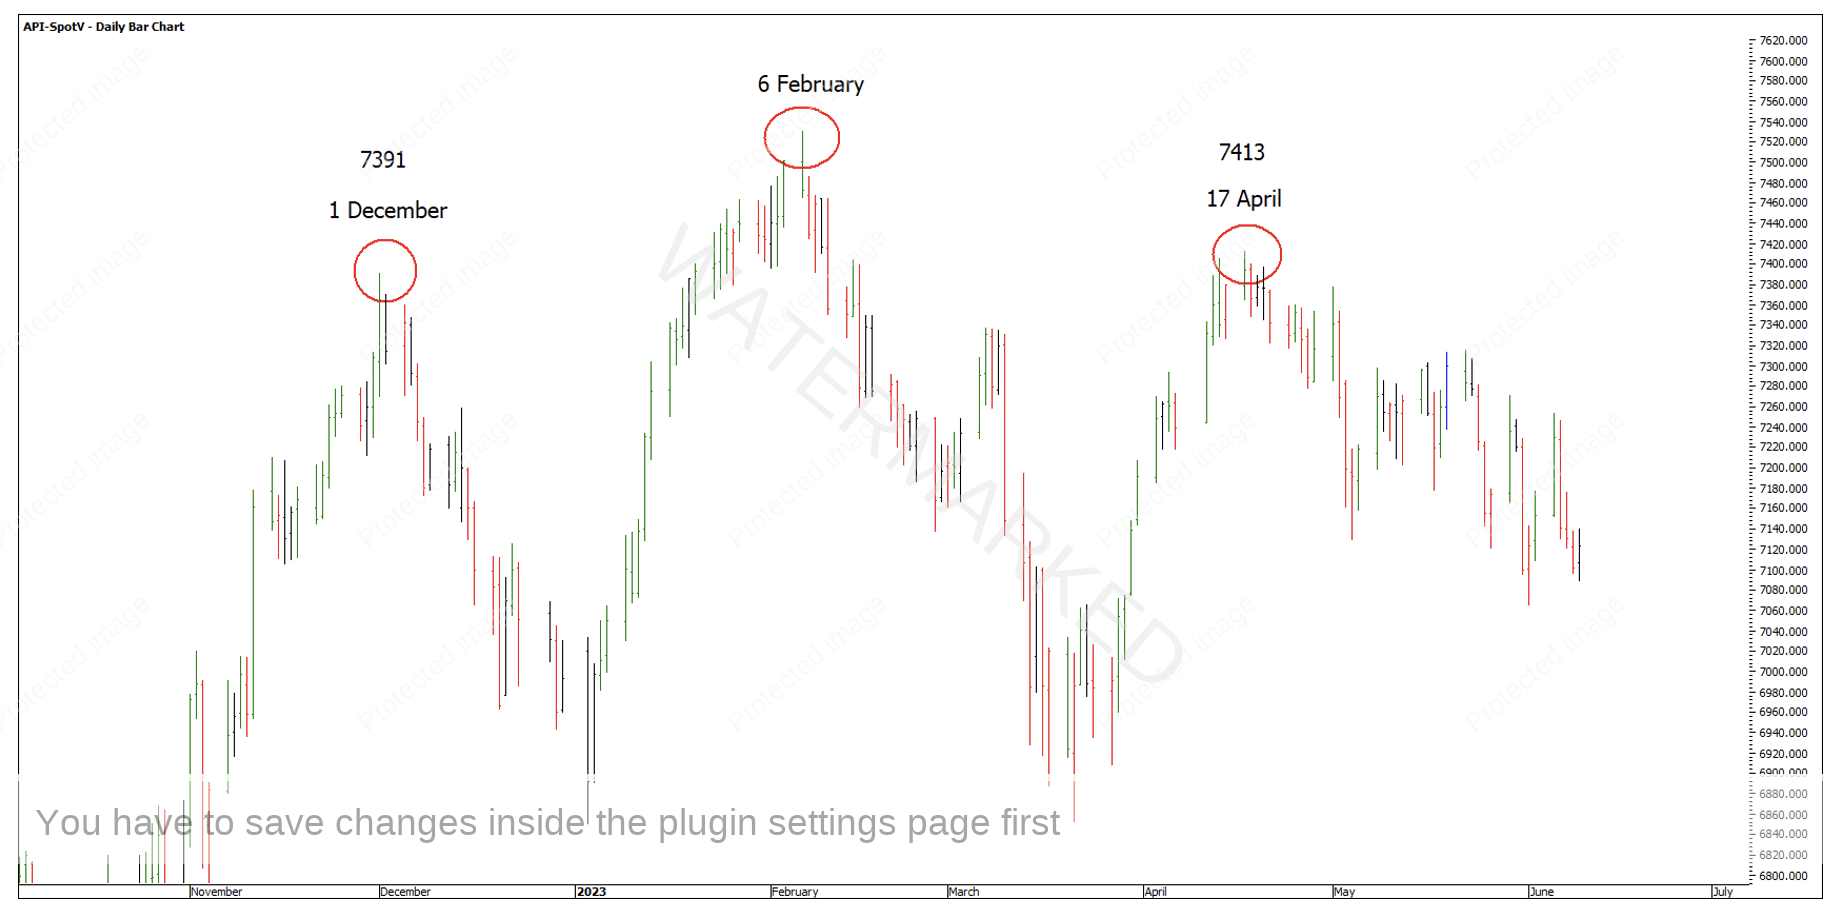
There is always the potential for other scenarios to play out like double bottoms, continued sideways or even more downside like the head and shoulders pattern may suggest.
Chart 12 – Head and Shoulders Pattern
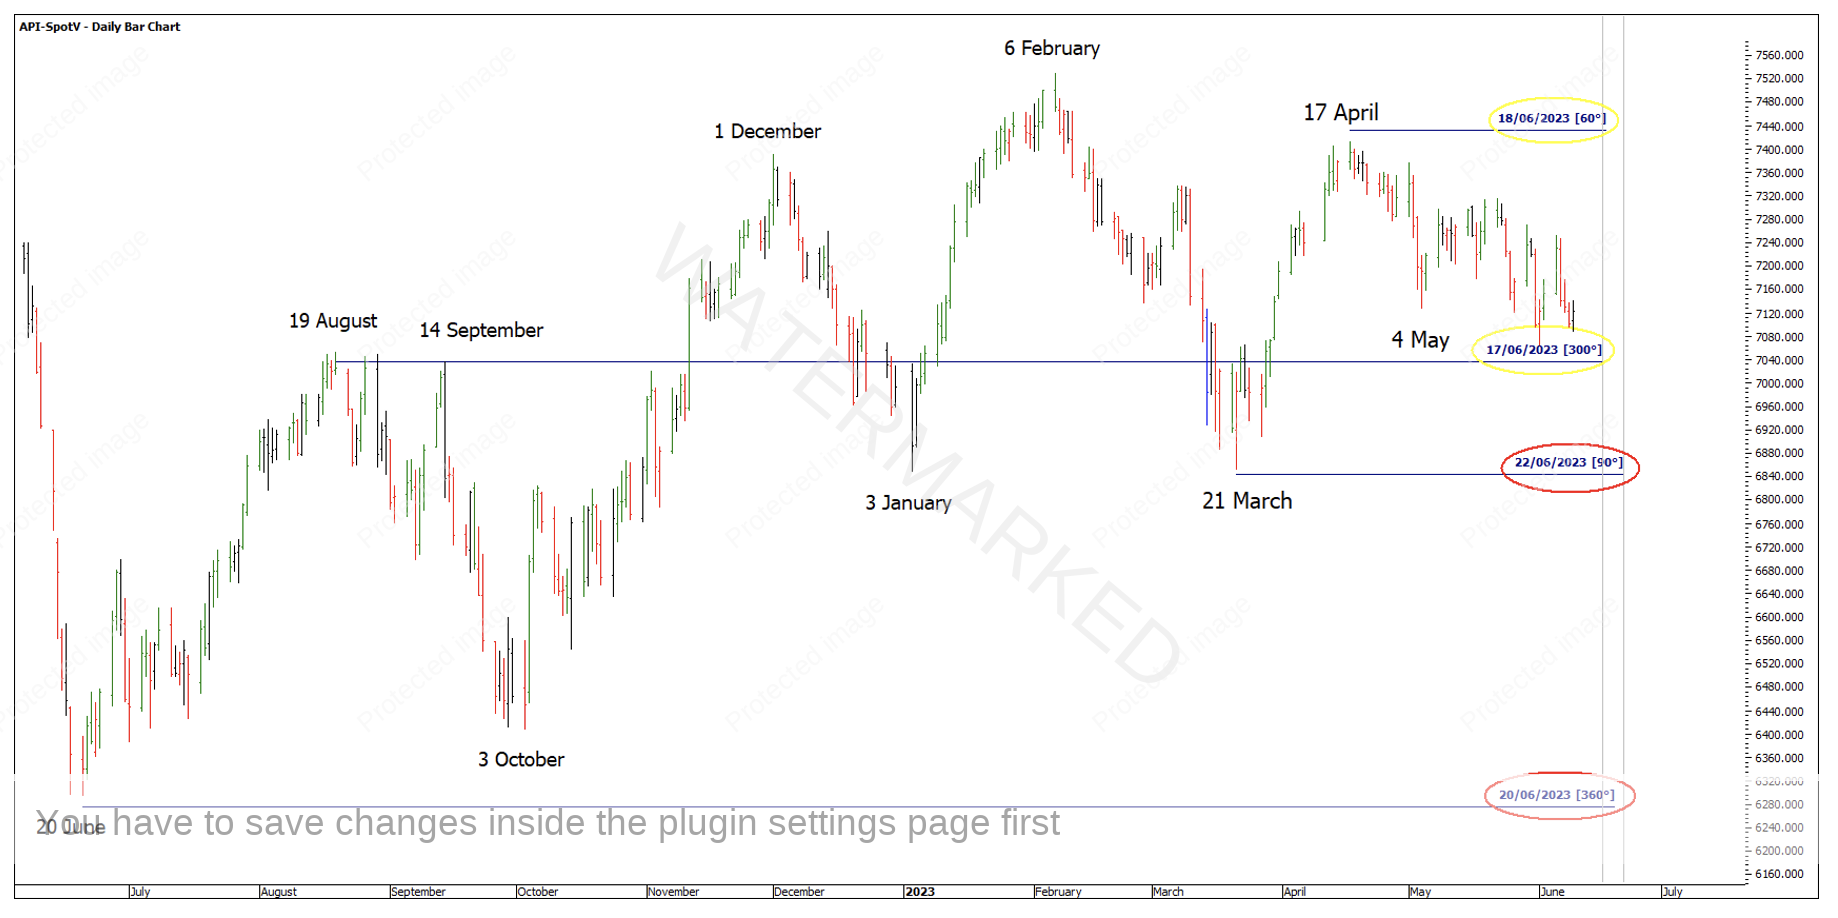
Whether or not the current 1 June low holds or not, we can look to the next Time by Degree dates to watch for another trading opportunity. Friday 16 June is the next Yellow Birth of the Contract Time by Degrees date and Thursday 22 June is the next Red Time by Degrees day.
Chart 13 – Next Time by Degrees Dates
Happy Trading,
Gus Hingeley
