Swing (Trade) with the Times
On Page 59 of the Ultimate Gann Course, Chapter 3 – Swing Charts – How to Make the Most Money Out of the Market, David Bowden writes,
“GO WITH THE MAIN TREND, AND NEVER BUCK IT”
On Page 76, David gives us a way of ‘Timing the Swing Chart’. This lesson on Balancing Time and Time Trend Analysis is such a powerful one, with the whole chapter filled with absolute gems of wisdom!
Combining Price Forecasting, Sections of the Market, Time by Degrees, Time Trend Analysis and Form Reading can really put us on the front foot, helping us to call the next big turn and more importantly, help us trade it!
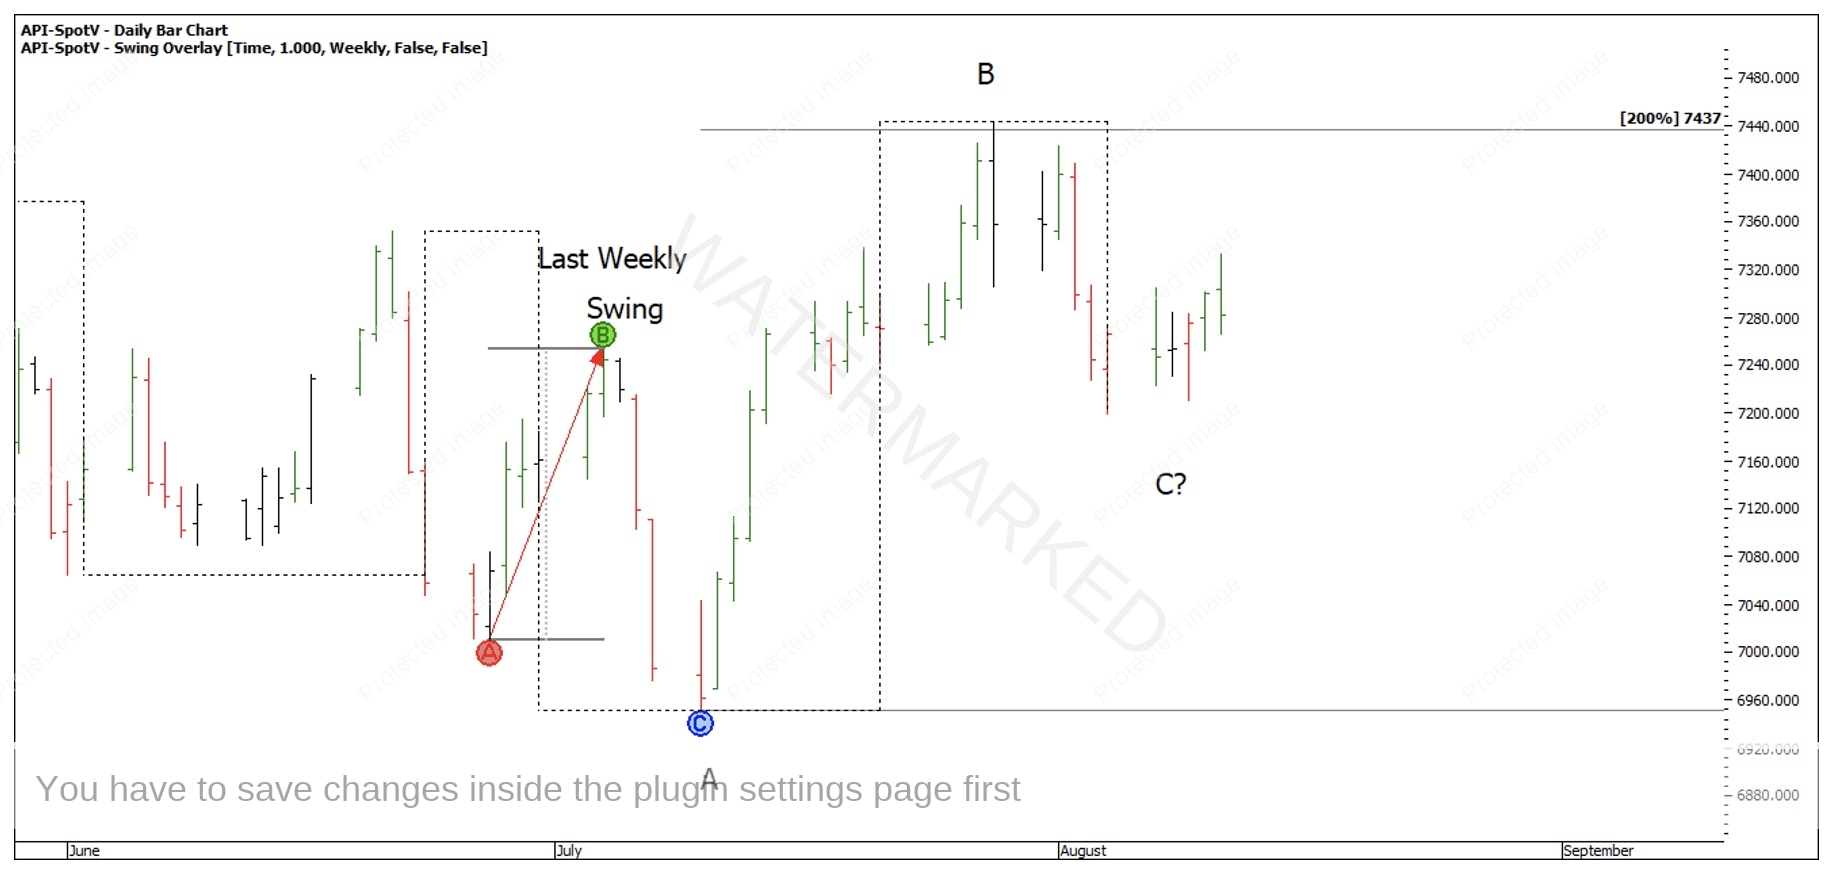
Chart 1 below shows the current weekly swing overlay on the SPI200. Hopefully this pattern looks very familiar! Just be aware that the last weekly swing isn’t displayed in the swing overlay due to the weekly outside bar.
Chart 1 – SPI200 Weekly Swing ABC
The SPI has made a weekly swing range up which is a 200% Overbalance in Price compared with the last weekly swing range, which would indicate a change in trend, and I can now look to call the Estimated Point C, otherwise known as the Weekly Retest.
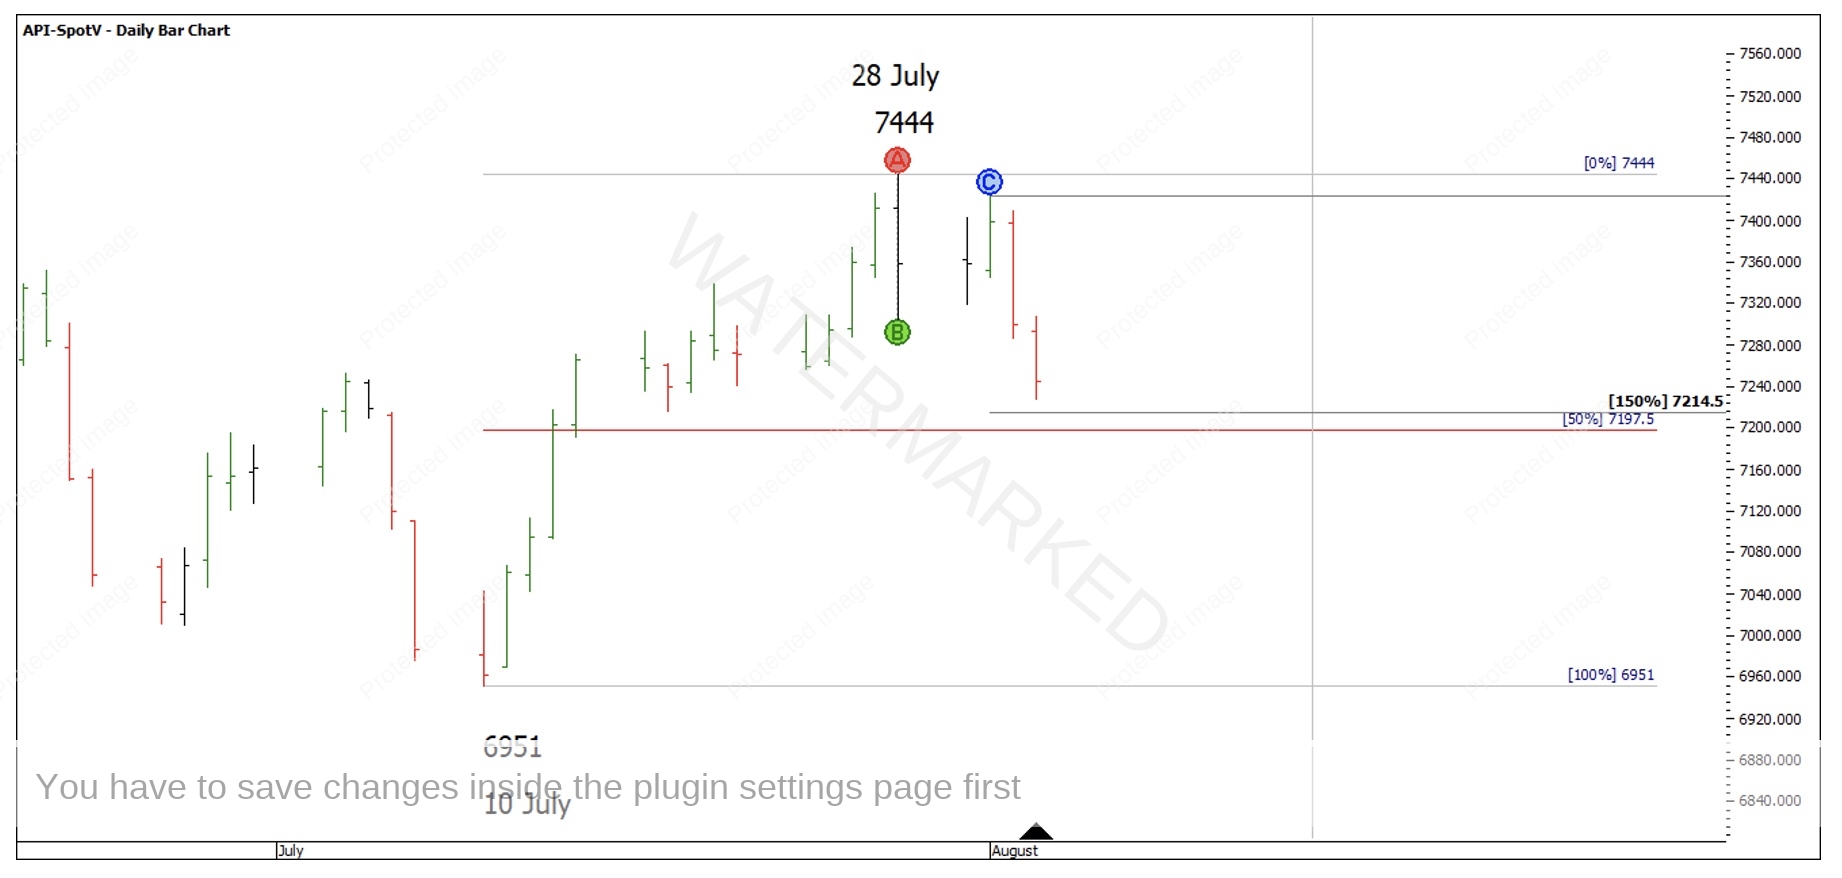
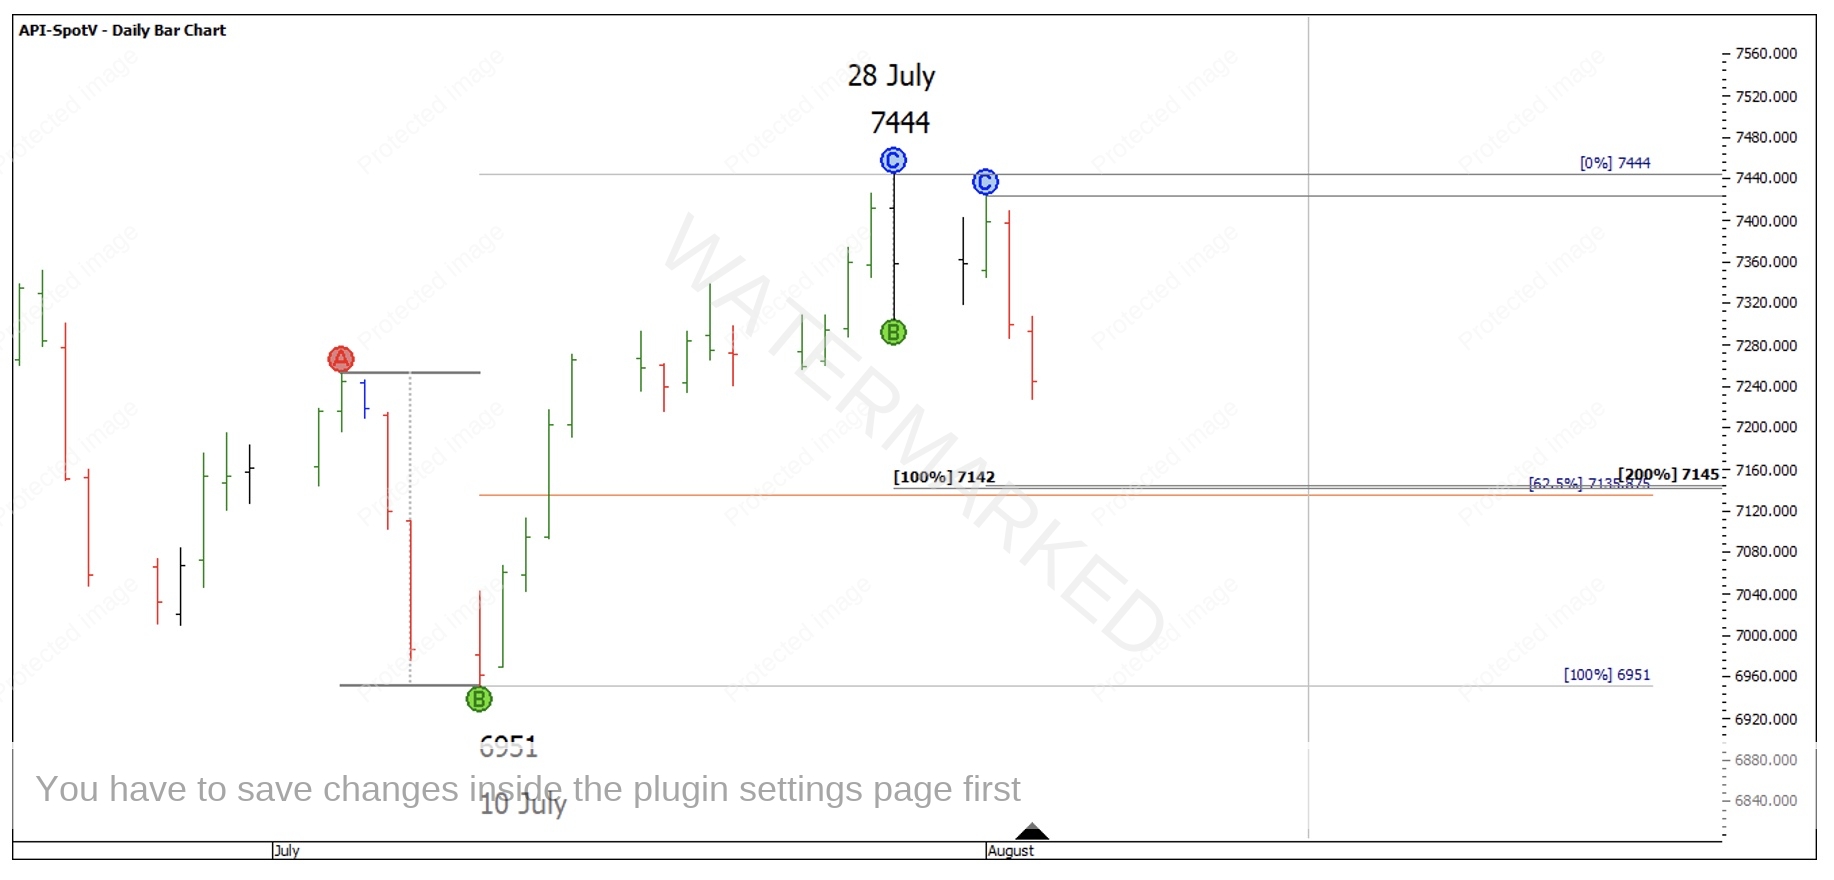
The two main price clusters that I see are displayed in Chart 2 and Chart 3 below.
Chart 2 – 150% of First Range Out Cluster
Chart 3 – 200% First Range Out Cluster
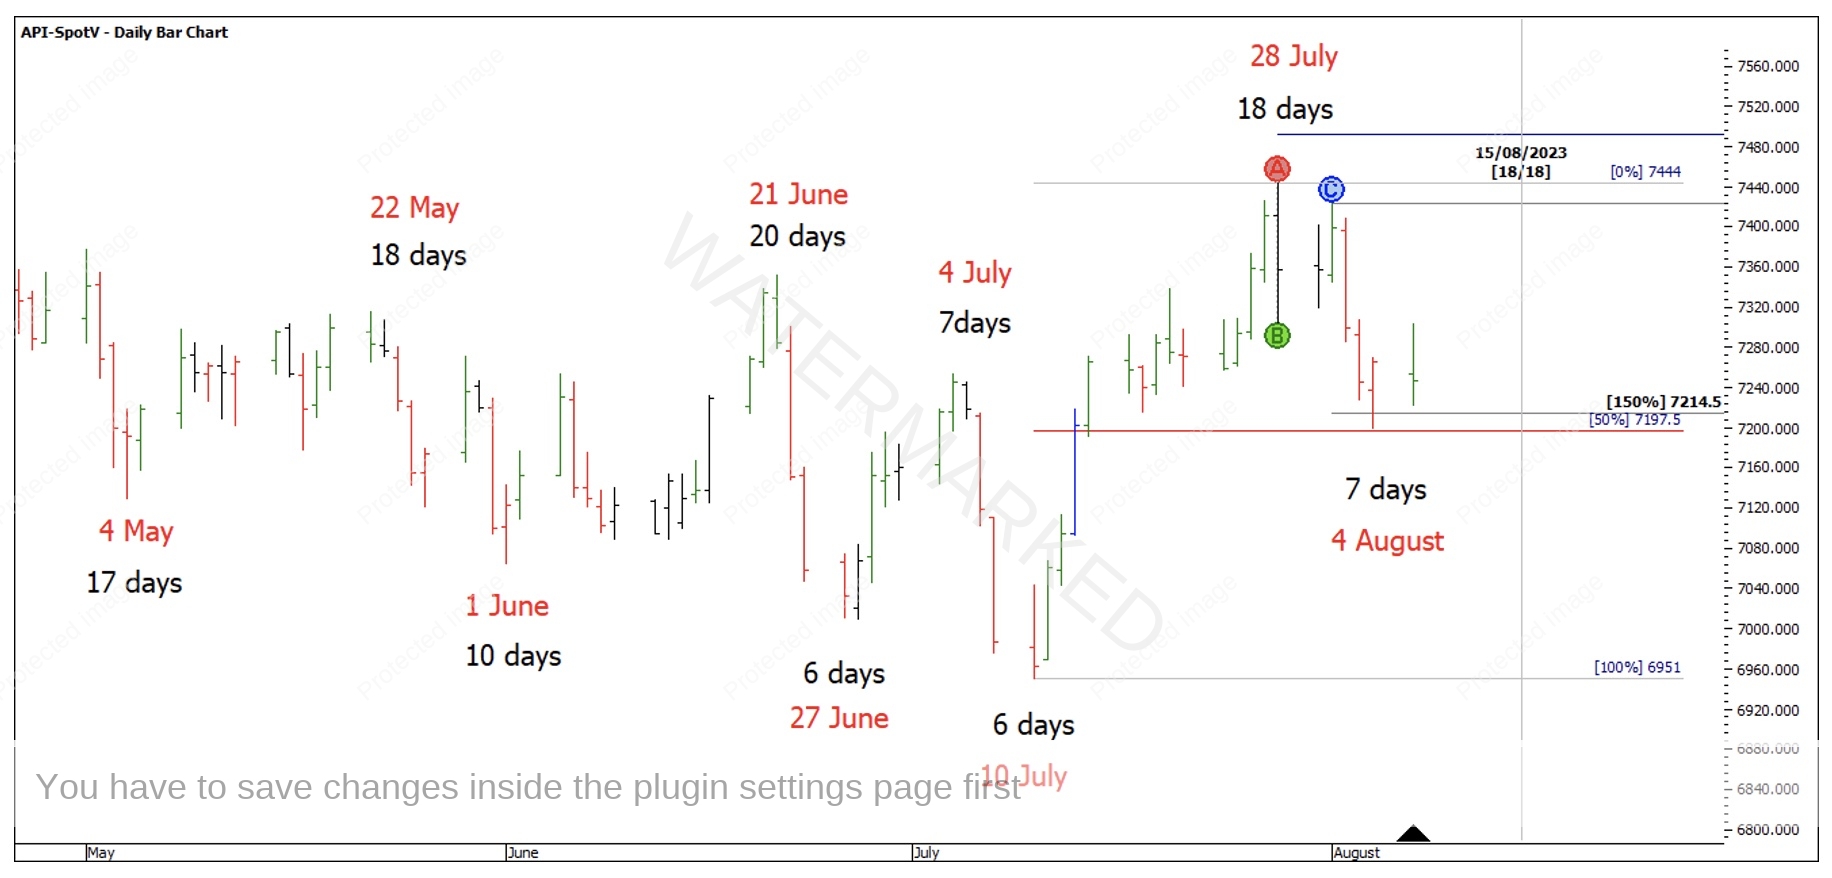
In Chart 4 below, I’ve added in Time Trend Analysis, and where the Market has been turning.
Chart 4 – Time Trend Analysis and Time by Degrees
Take a moment and look at the repetition of dates and times. Personally, I was watching 7140 around the middle of August with great interest! However, the one piece of the puzzle that seemed to be missing was Time by Degrees for the 15th.
Looking at Chart 4 above, could 4 August be the weekly swing low? It has Time Trend harmony of 7 days down and is Time by Degrees from 4 July, 1 June and 4 May. The only problem at the time was the daily swing chart was still showing an expanding second swing down and a contracting daily swing up.
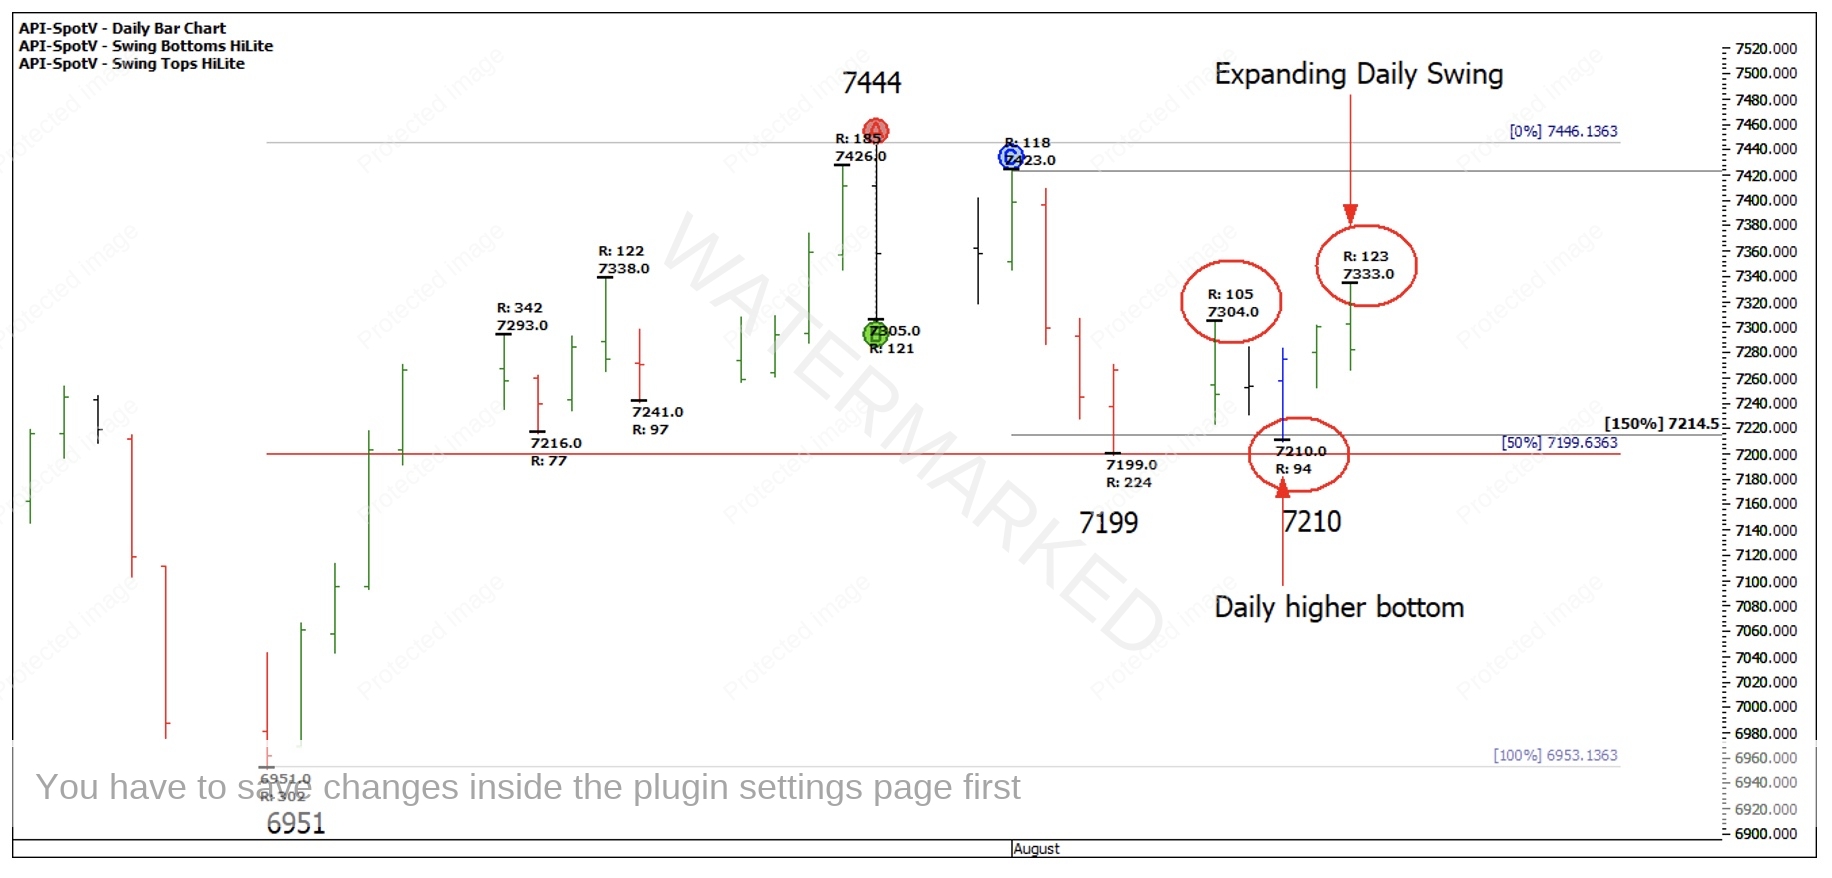
Fast forward a couple of days, we saw a daily higher bottom at 7210 which is a contracting range down, followed by the first expanding daily swing up of 123 points. Interesting!
Chart 5 – Form Reading the Current Swings
Could this be a case of a market hitting a cluster at the right time (Time by Degrees and Time Trend) but requiring time to ‘catch up’ before price moves away from a higher bottom?
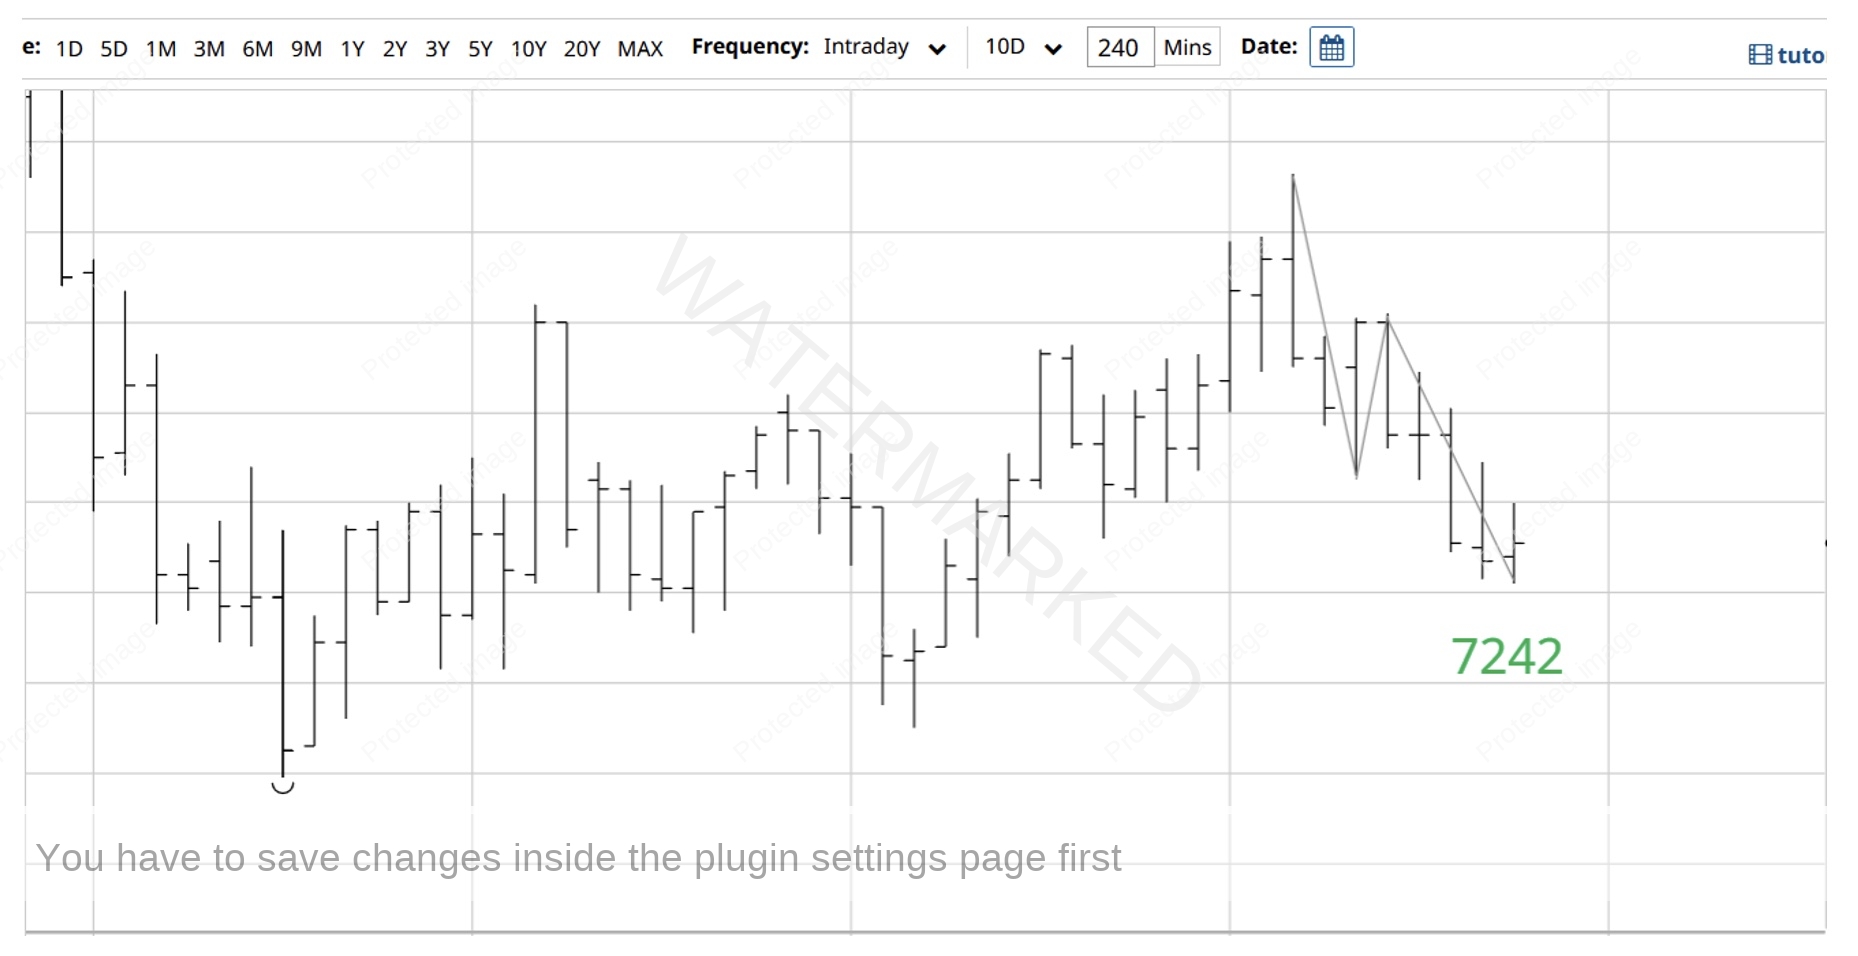
Looking at the 4-hour bar chart of the current daily swing down into Friday night’s low of 7242, you can see the SPI is in a second 4 hour swing down that is currently contracting. As long as the daily swing pull back is less than 94 points it would then be a contracting daily swing down after an expanding swing up, as well as being a second higher bottom! Even if 7242 is not broken, it will still show up the Monday 14 August bar and be within one day of balancing of the bigger 18-day time frame.
Chart 6 – 4 Hour Bar Chart Ranges
Now if we use the Advanced Swing Trading Rules and in particular the Type 2 trades, we can look for a low-risk entry to get set.
Instead of using a daily swing chart as our entry, we could use the above 4 hour or even 1 hour First Higher Swing Bottom or Overbalance in Price ‘Type 2’ entry. This would then mean we are using a 1 or 4 hour swing to enter and trade a potential weekly swing range and be trading in the direction of the main trend. And if the market drops a little bit further, remember that we have the 7197 area that is the 50% retracement, and a potential Double Bottom setup, also on Balancing of Time.
By the time this article is published, the trade may have moved away, however it’s still a very relevant setup in the current market that we can watch unfold in real time.
As always, the market can go up, down, sideways and a combination of all three!
Happy Trading,
Gus Hingeley
