Financial Stocks – A Follow Up
Last month I discussed the Financials index in the US, and I am still, after many years, inspired by how Gann’s work brings together trading outcomes based on cycles and history repeating. The ability to foresee an individual stock can be done, but when we look at an index that combines hundreds of the main US banking businesses, we really should have no chance of predicting what’s next if the markets are a complete random walk. That being said, the outcome has been quite different.
A quick review of last month’s article will hold you in good stead as I left you with a chart that showed the level of 772.67 as a price target to watch. This was a 100% repeat of the First Range Out from the March 2023 low.
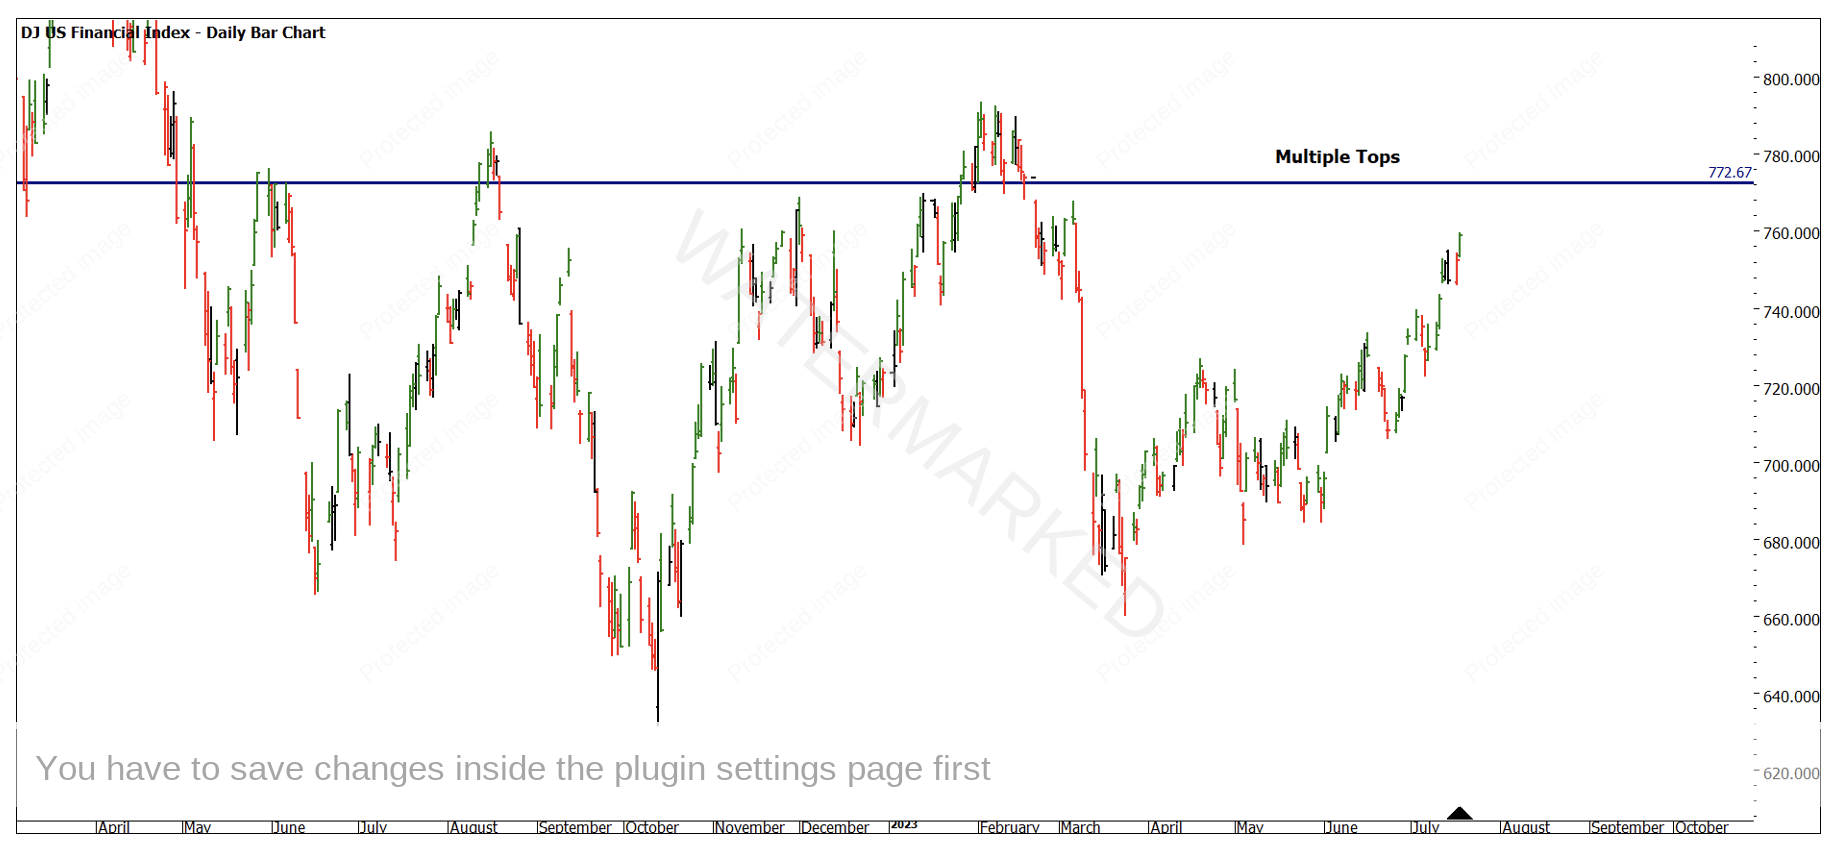
Chart 1 – Daily Bar Chart DJUSFN
Remember that when we have a price (or time pressure point) we have the options of trading into that area or waiting for a potential reversal. This can offer two potential trades i.e., into and out of the area of interest.
In Chart 2 we can see how the price action has rallied into that price cluster and then offered an Outside Reversal Day. When presented with a signal day around targets they can often be used as a trigger for actioning a trading plan.
The sentiment of the market around the cluster shows the Inside Day/Outside Day patterns, the other area to note was that the market could not close above the 100% level around what is the current high.
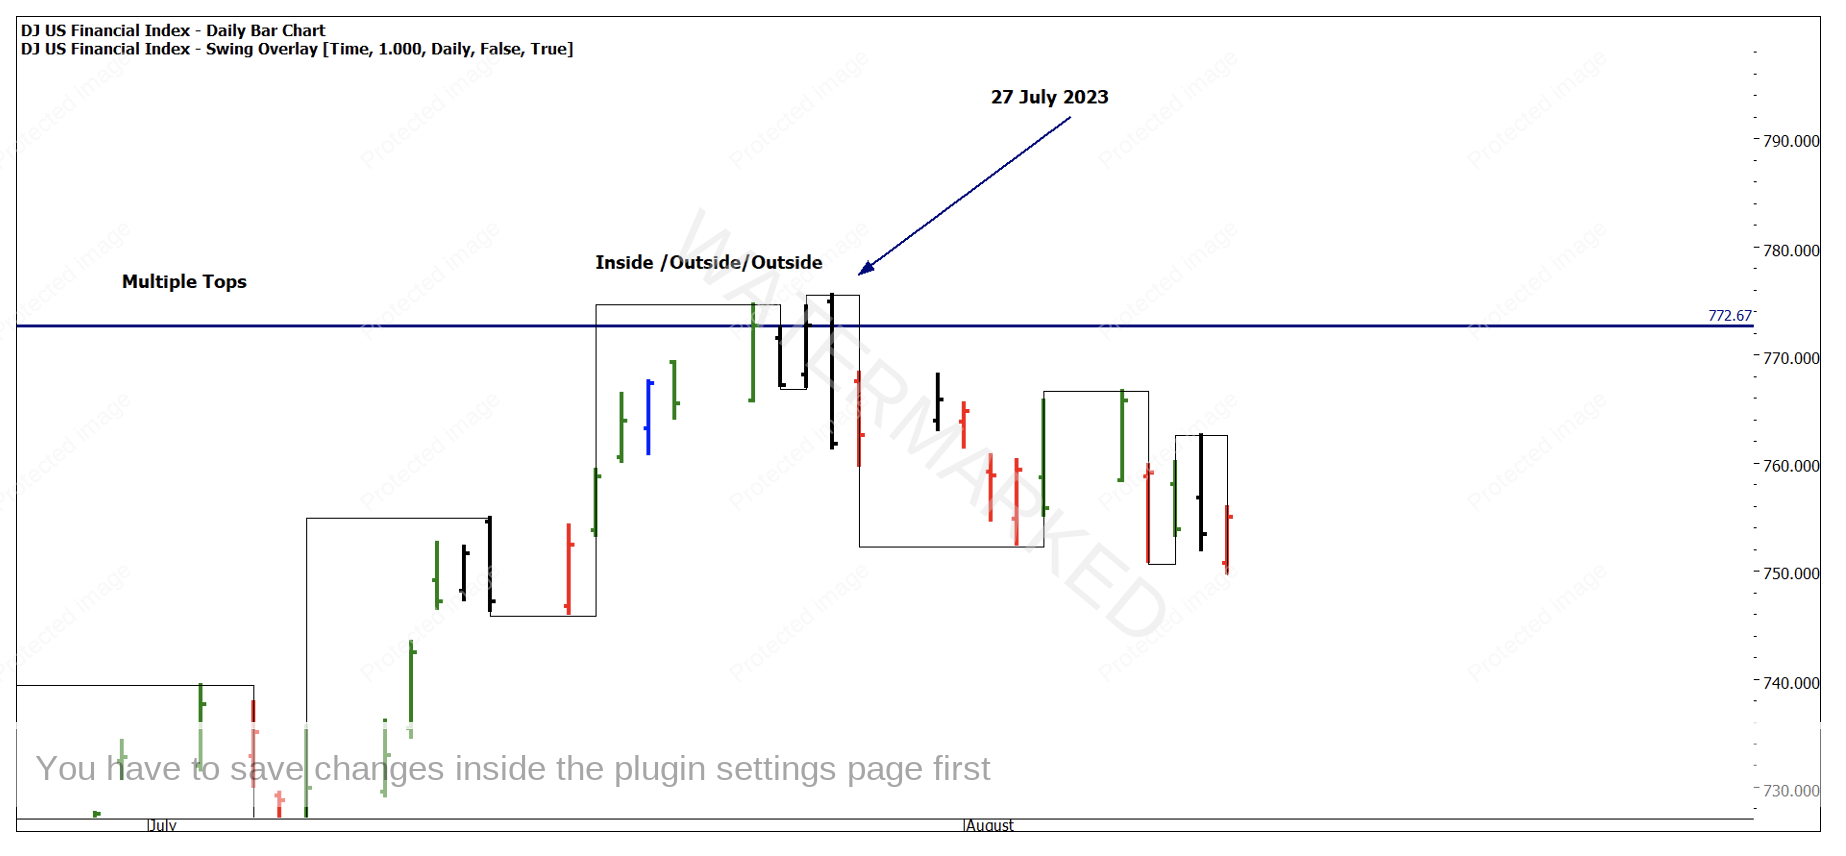
Chart 2 – Daily Bar Chart DJUSFN
Since the high on the 27th of July the market has sold down but not in an overly aggressive fashion. This may mean that the high is a pause in what is the major trend, or we need to see something more develop to the downside. Chart 3 shows somewhat of a mirror to the downside in what we have seen to the upside. If the price action moves lower, there is a series of bottoms around the 665 level that could provide a broad base of support.
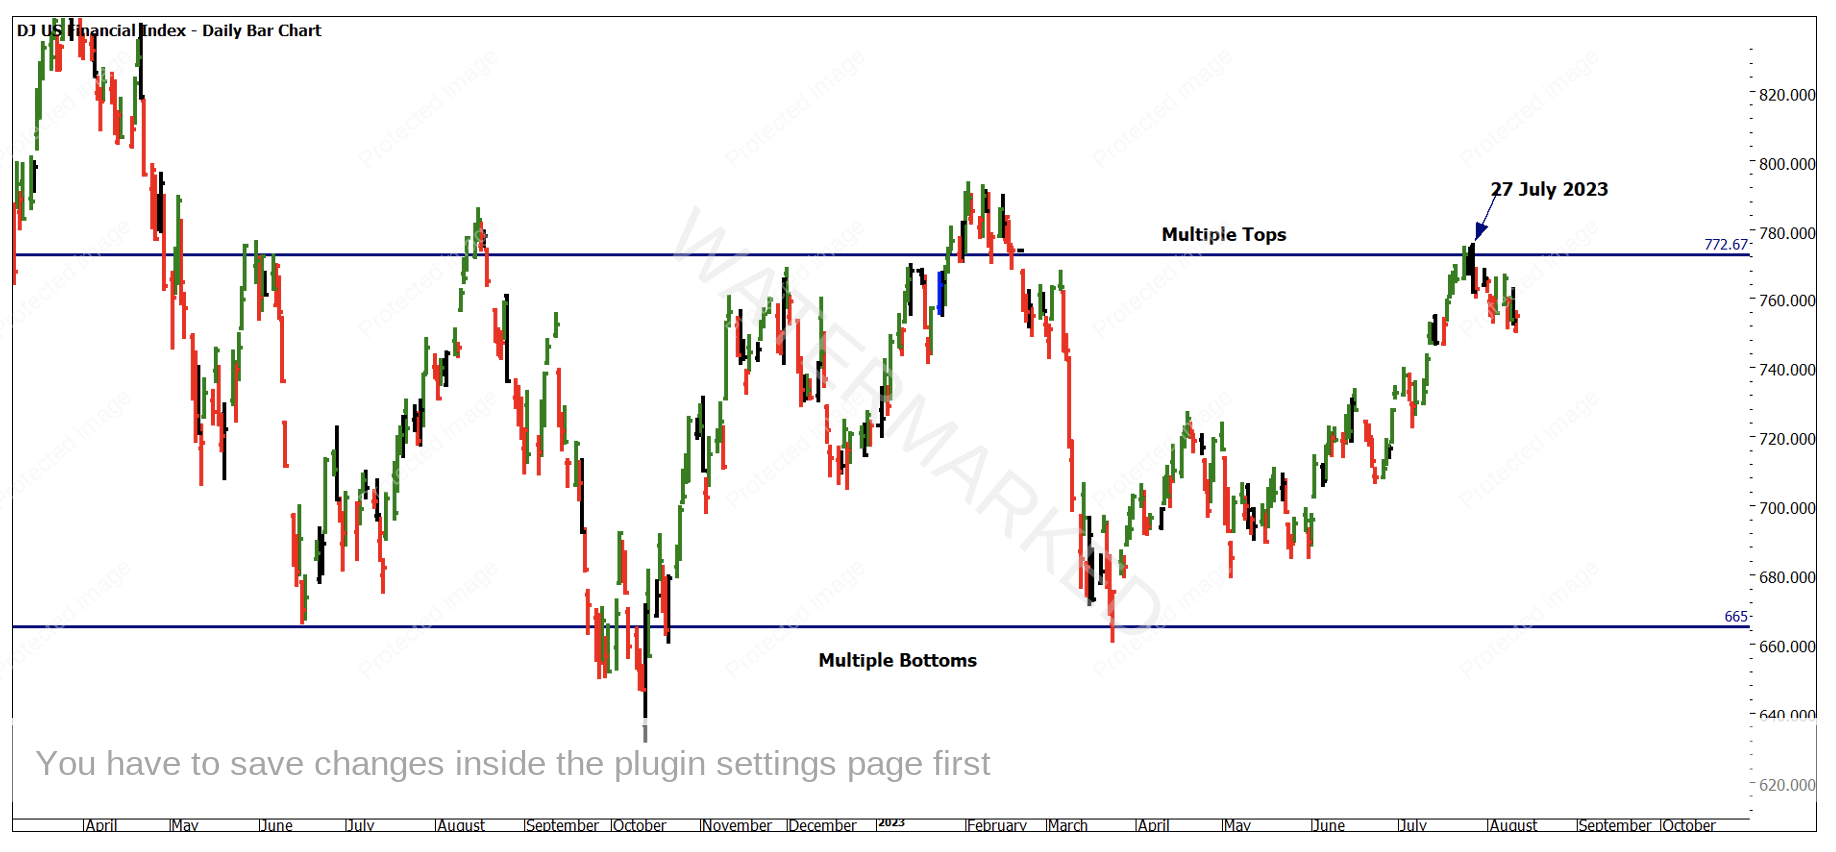
Chart 3 – Daily Bar Chart DJUSFN
For those studying the second dimension aspects of Gann you should be able to pull out some repeating time frames that run into the 27th of July as another anchor to build a plan around.
Finally, when we tackle work on an index we should be aware of what makes up the index, so refer back to the top 10 list that was provided in last month’s article. Many of those on the list have held up quite well on the long side, that is, they have not fallen away. The two that stand out as underperformers are both in the investment banking space, Morgan Stanley and Goldman Sachs.
You could use your analysis of the index to provide insights into the underlying stocks and how they interact. I suggest you study the two charts below and see if there were opportunites to follow using our cycle analysis.
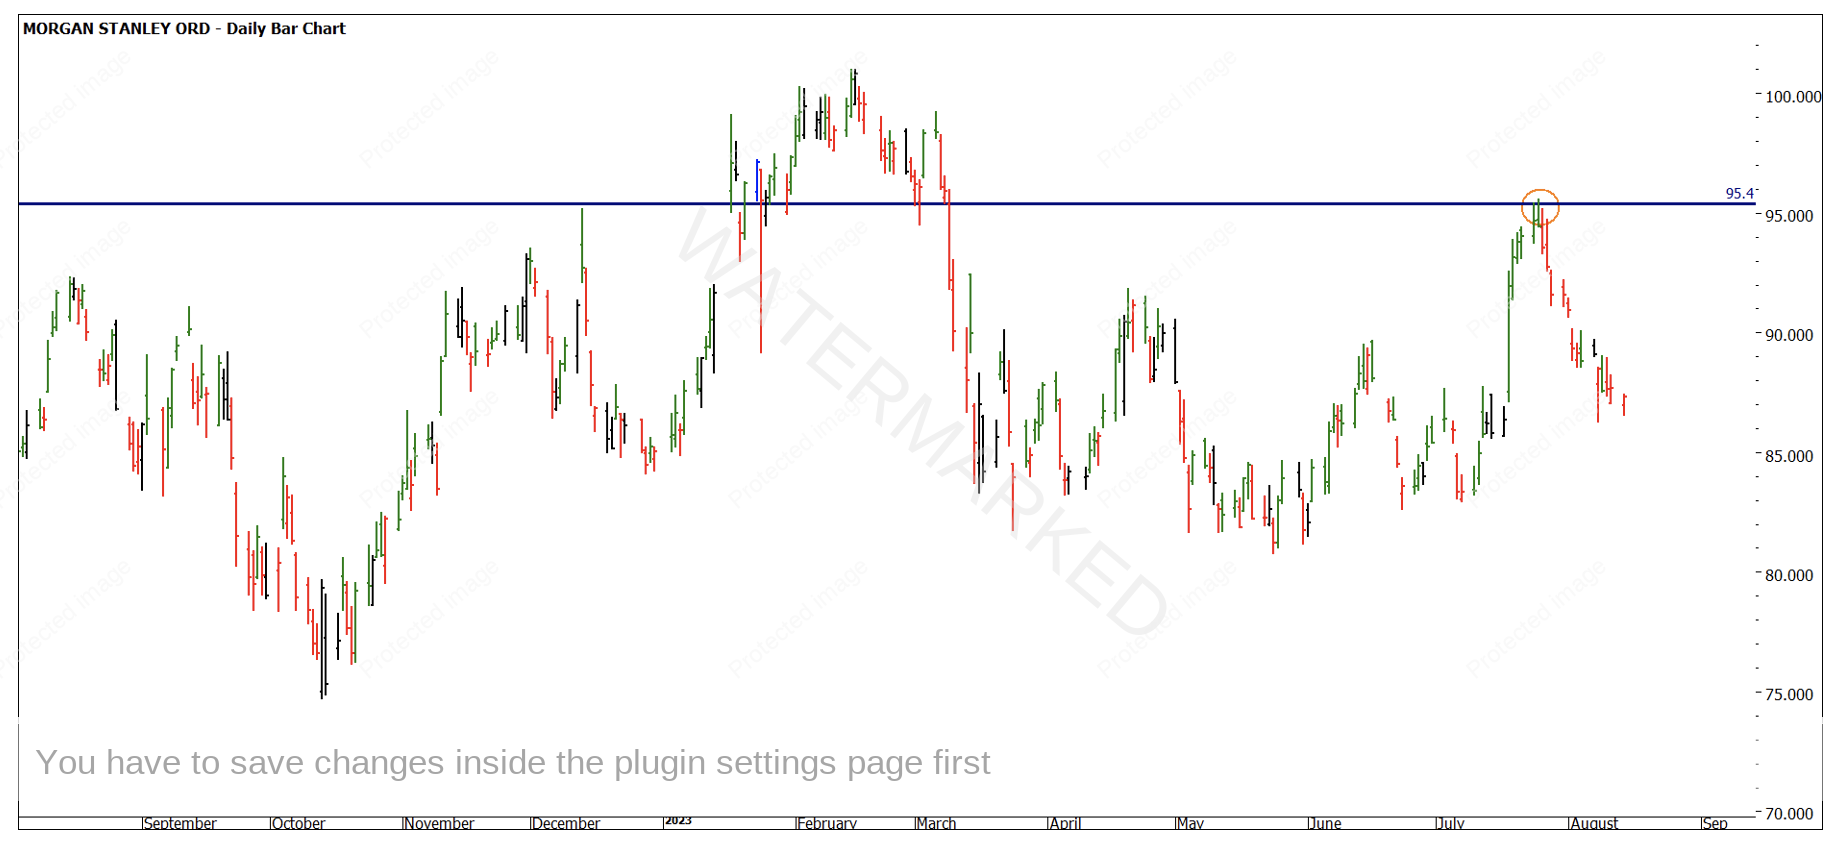
Chart 4 – Daily Bar Chart Morgan Stanley
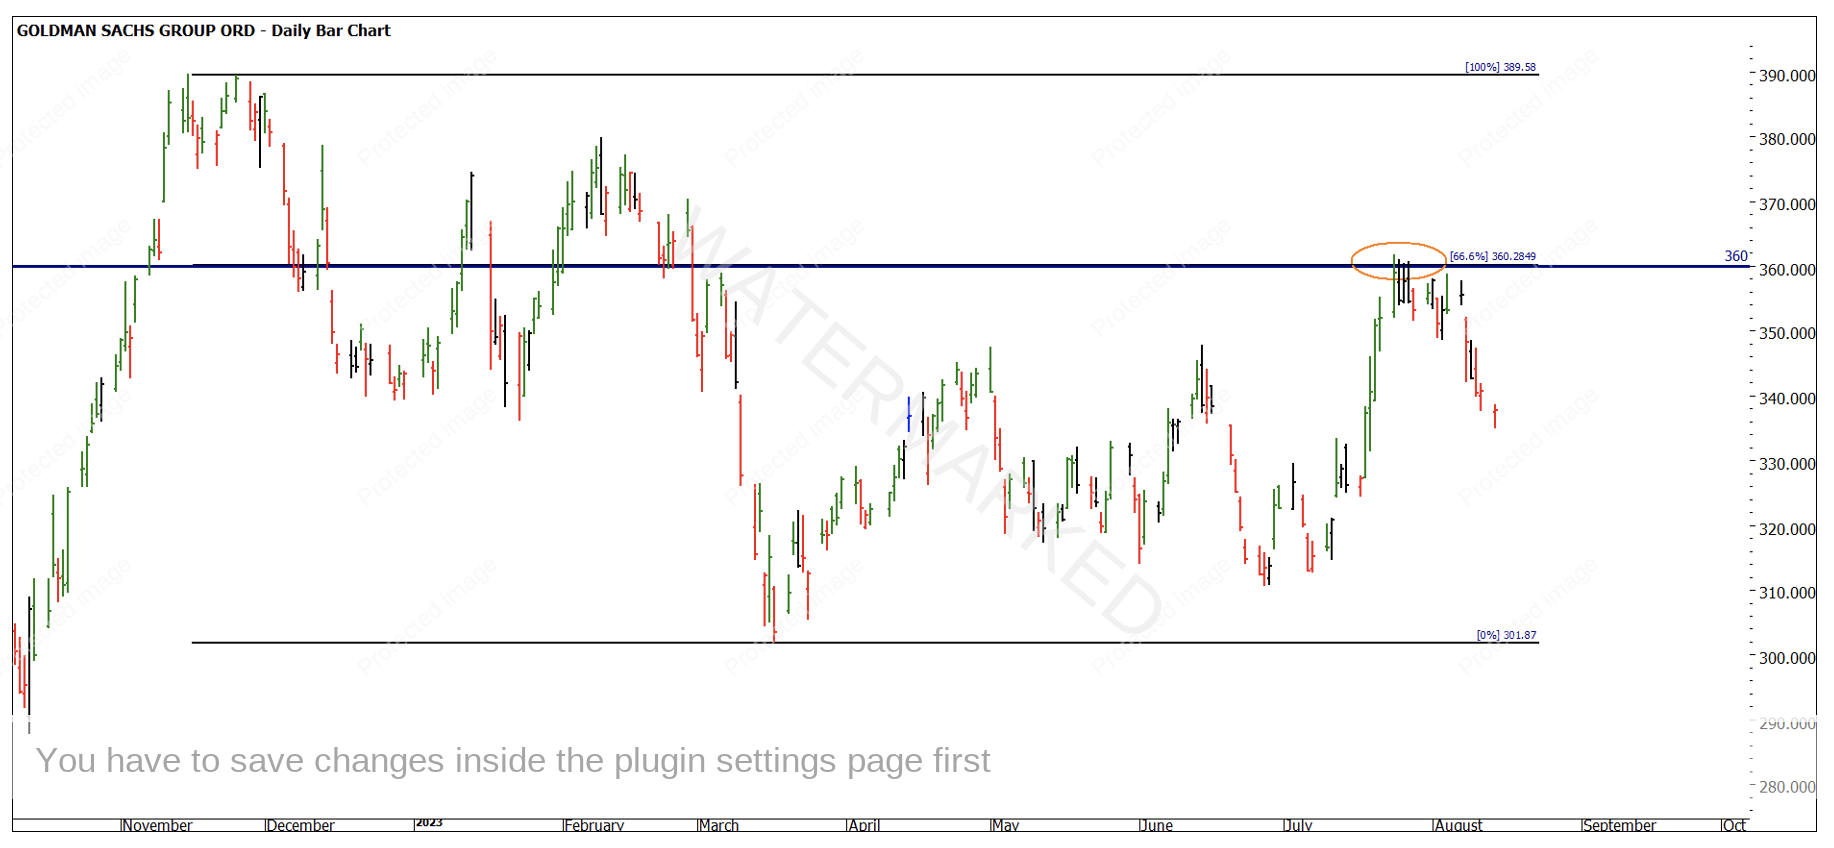
Chart 5 – Daily Bar Chart Goldman Sachs
The spectre of interest rates and inflation is potentially becoming tamed here in Australia but a spot fire in the US last month flared and we may have some time yet before globally all the same major economies are on the same path.
Good Trading
Aaron Lynch