Sugar – Milestones
This article fully recreates a price cluster analysis from the Sugar futures market using the continuous Gann chart which links each successive year’s October contract for that market, chart symbol SB-Gann.V in ProfitSource. Also this month there are a number of general charting tips so be sure to tune in closely, and even go to the effort of reproducing the charts in this article using your own software, a worthwhile exercise especially if you are looking to become more acquainted with ProfitSource.
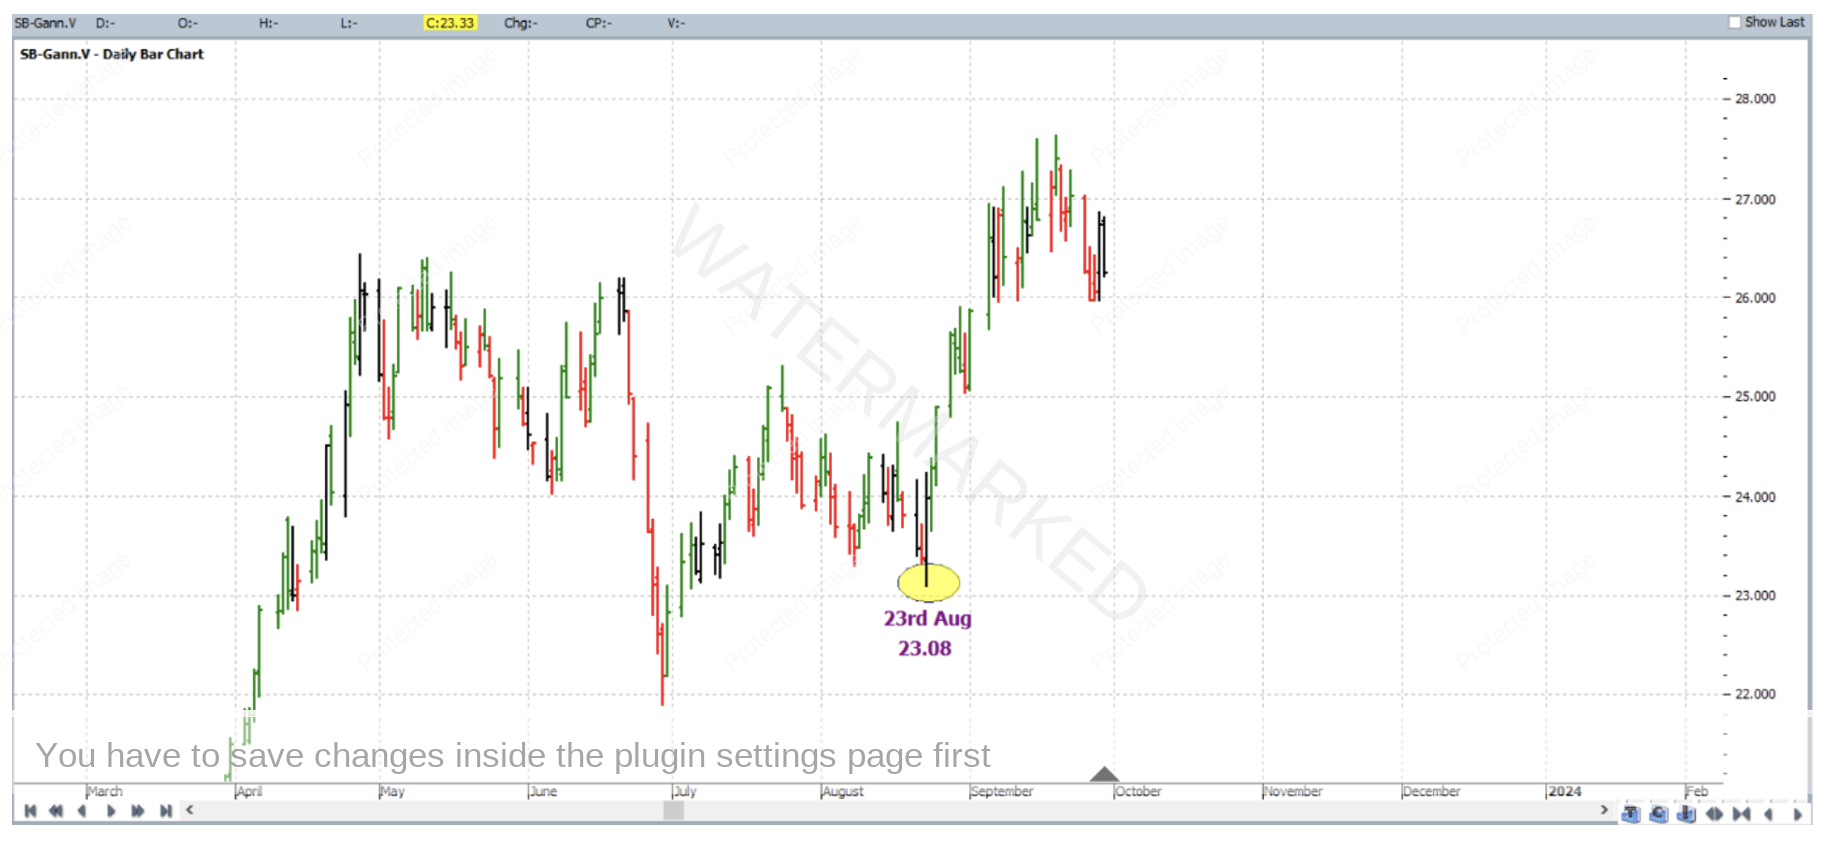
On 23 August 2023 the market made a low of 23.08 cents per pound, and no that’s not a typo – price and date happening to have the same numbers!
This was what we’d refer to as more of an intermediate low, rather than a major low. None the less, if we were interested in taking a trade around this time, were there any price reasons for the market to reverse at this level?
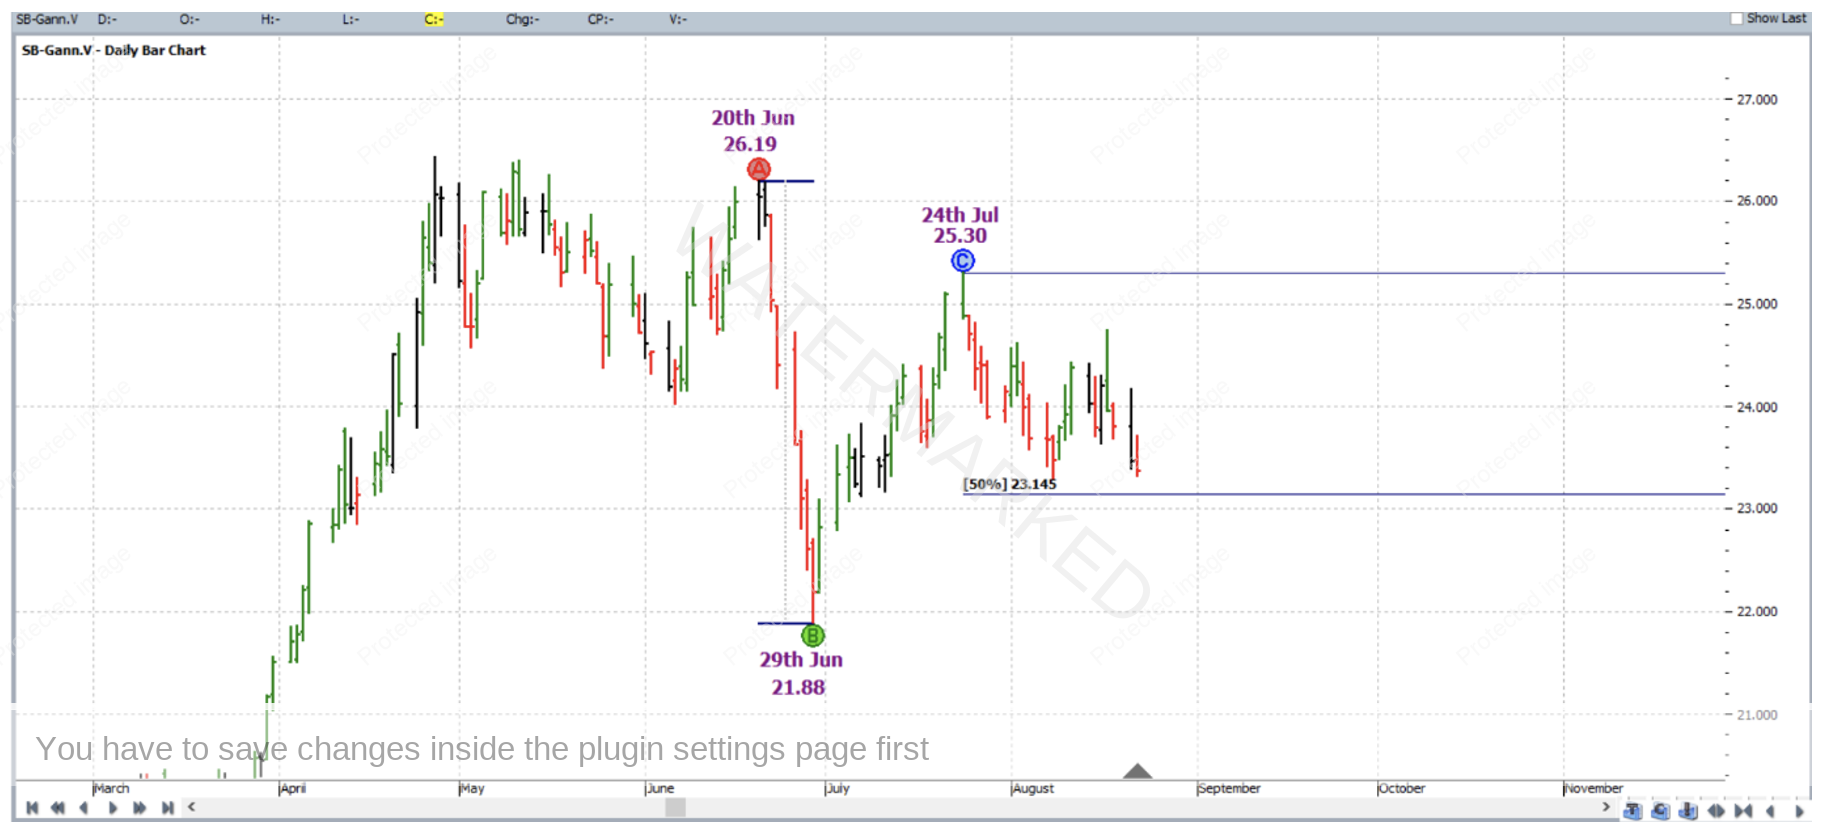
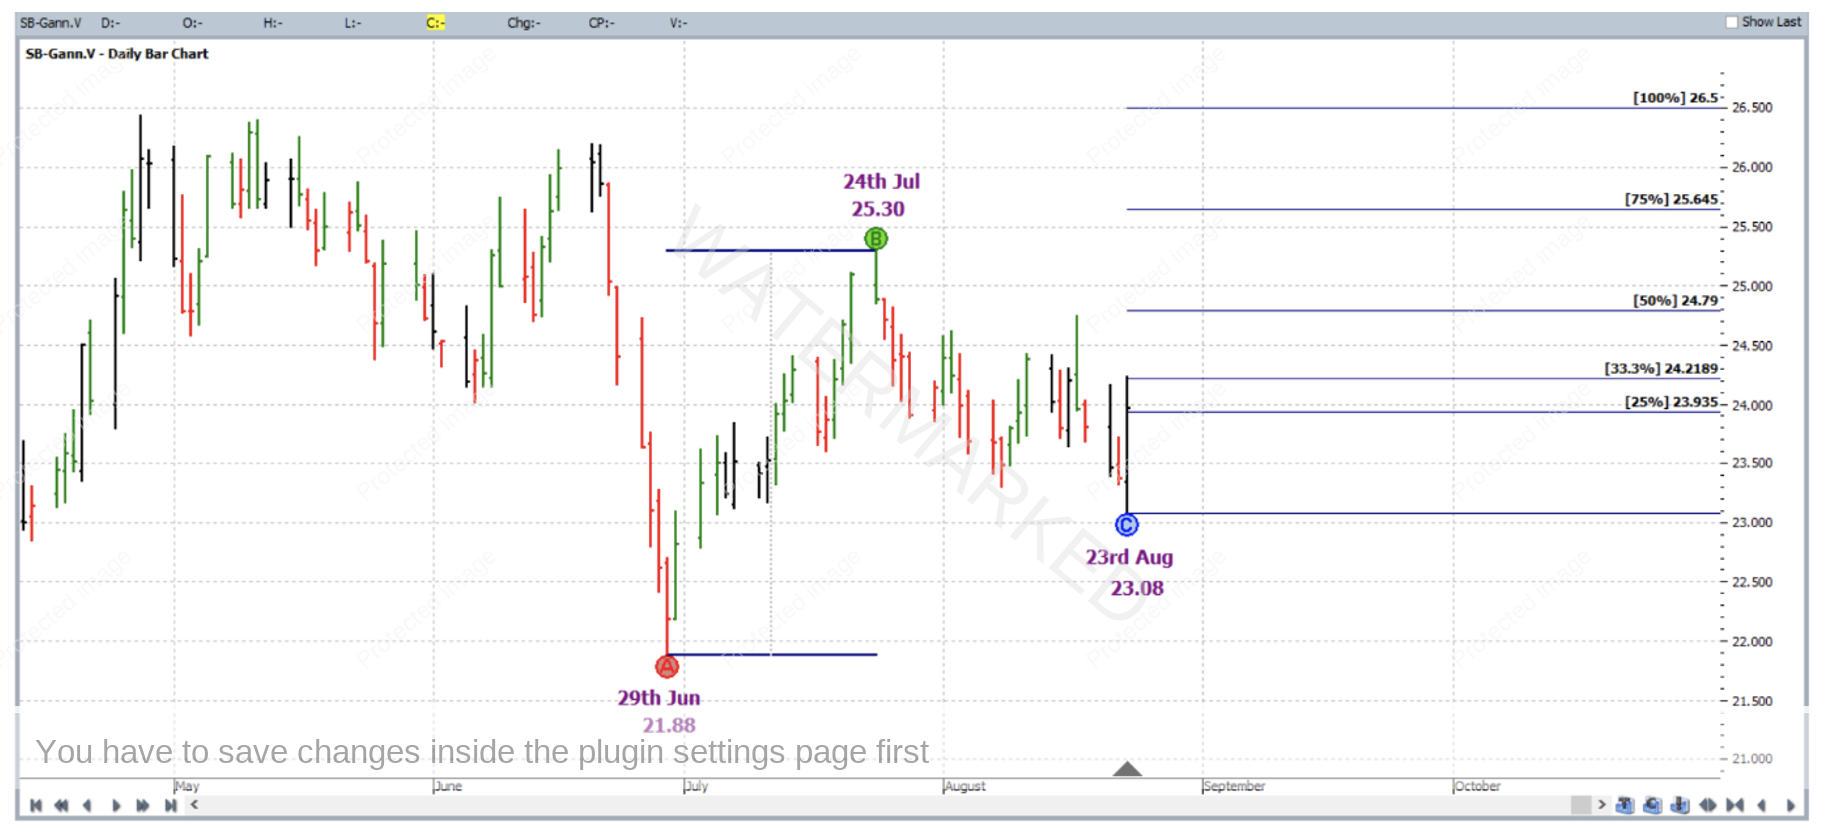
Let’s take a look at the market action in Walk Thru mode leading up until the day before the above mentioned low. First of all, the market was approaching the 50% milestone of the ABC application with Points A, B and C applied as follows:
Point A: 20 June 2023 high 26.19
Point B: 29 June 2023 low 21.88
Point C: 24 July 2023 high 25.30
The Points A, B and C in this case were successive turning points from the weekly swing chart.
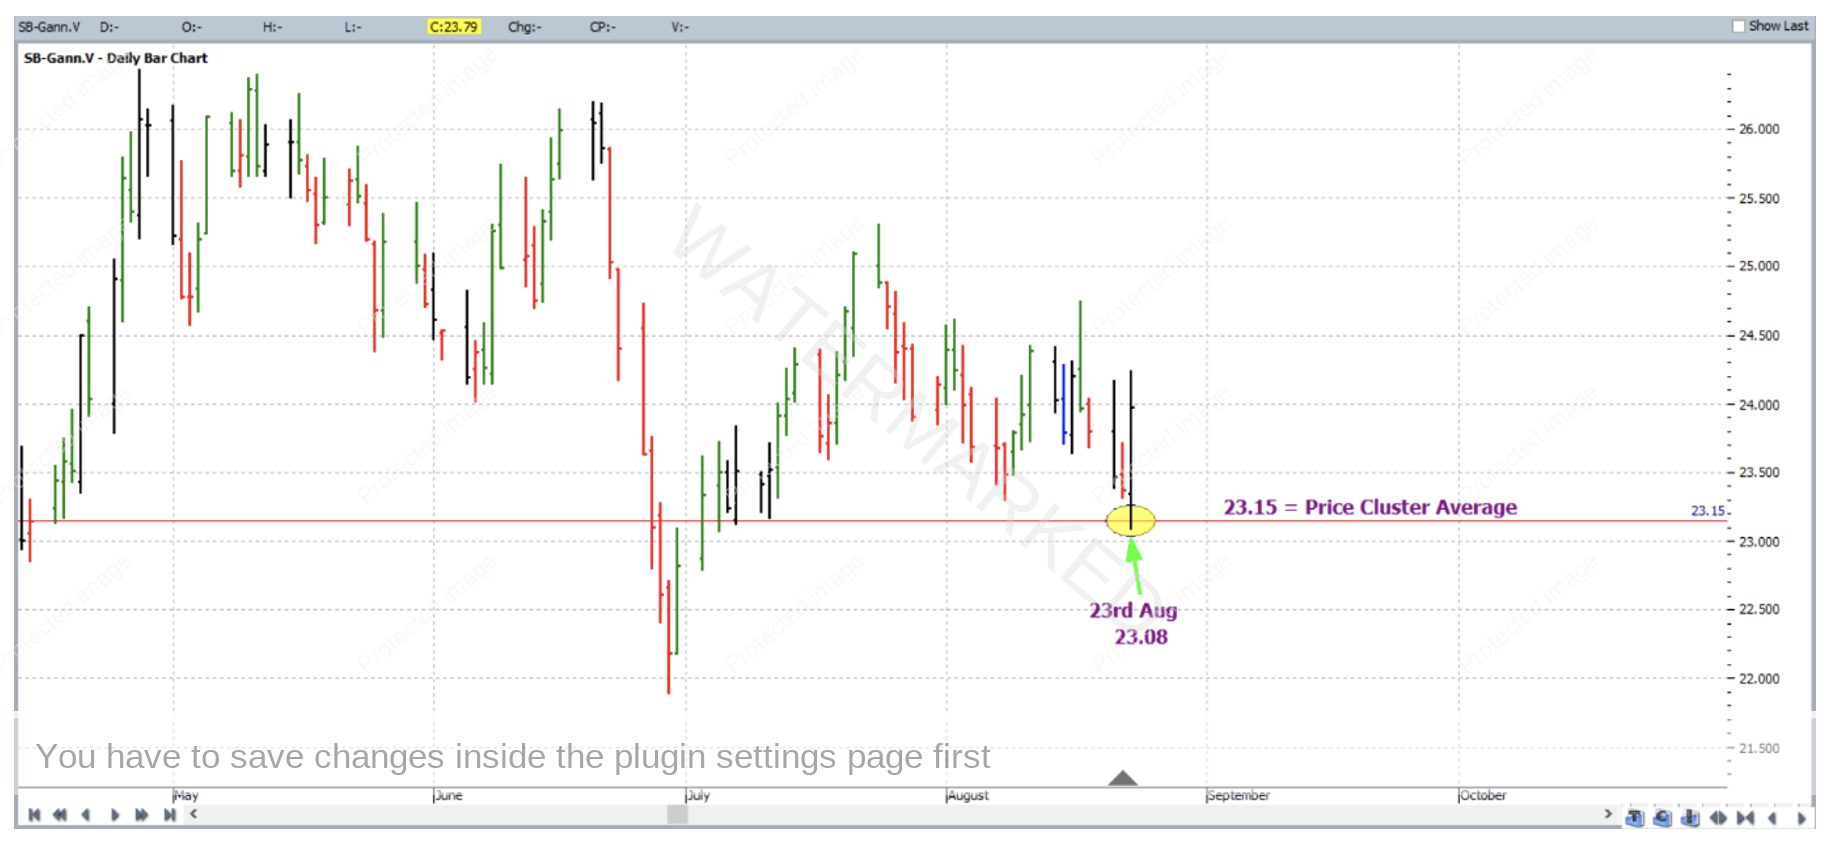
The 50% milestone itself was 23.15 (rounded up) and this is illustrated below.
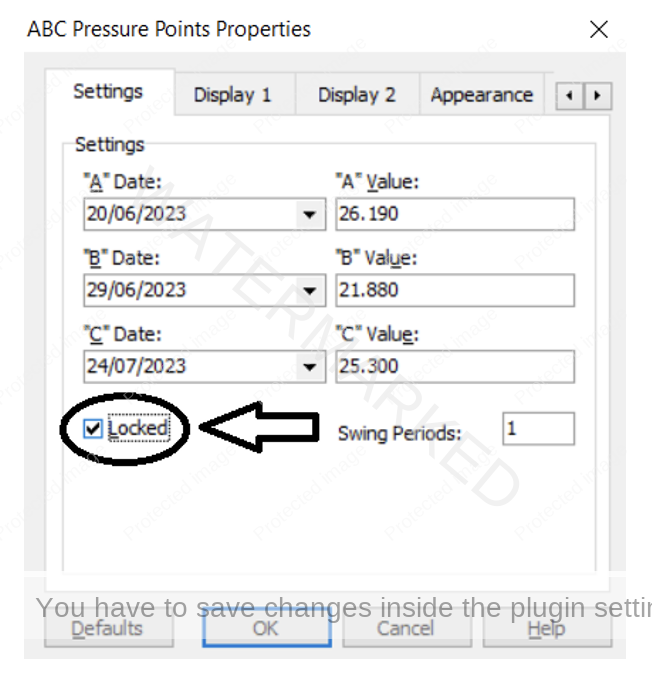
Note in the above chart that all milestones were switched off (by going to the tool’s Properties -> Display tab), with the exception of the 50% milestone. This was done for clarity purposes because as you will see a number of other analysis inputs will be added to the chart. Before that however, a handy thing to do is “Lock” this application of the ABC into place on the chart. This can be done by right clicking on any of the tool’s features/lines, going into its Properties box, and ticking the “Locked” box.
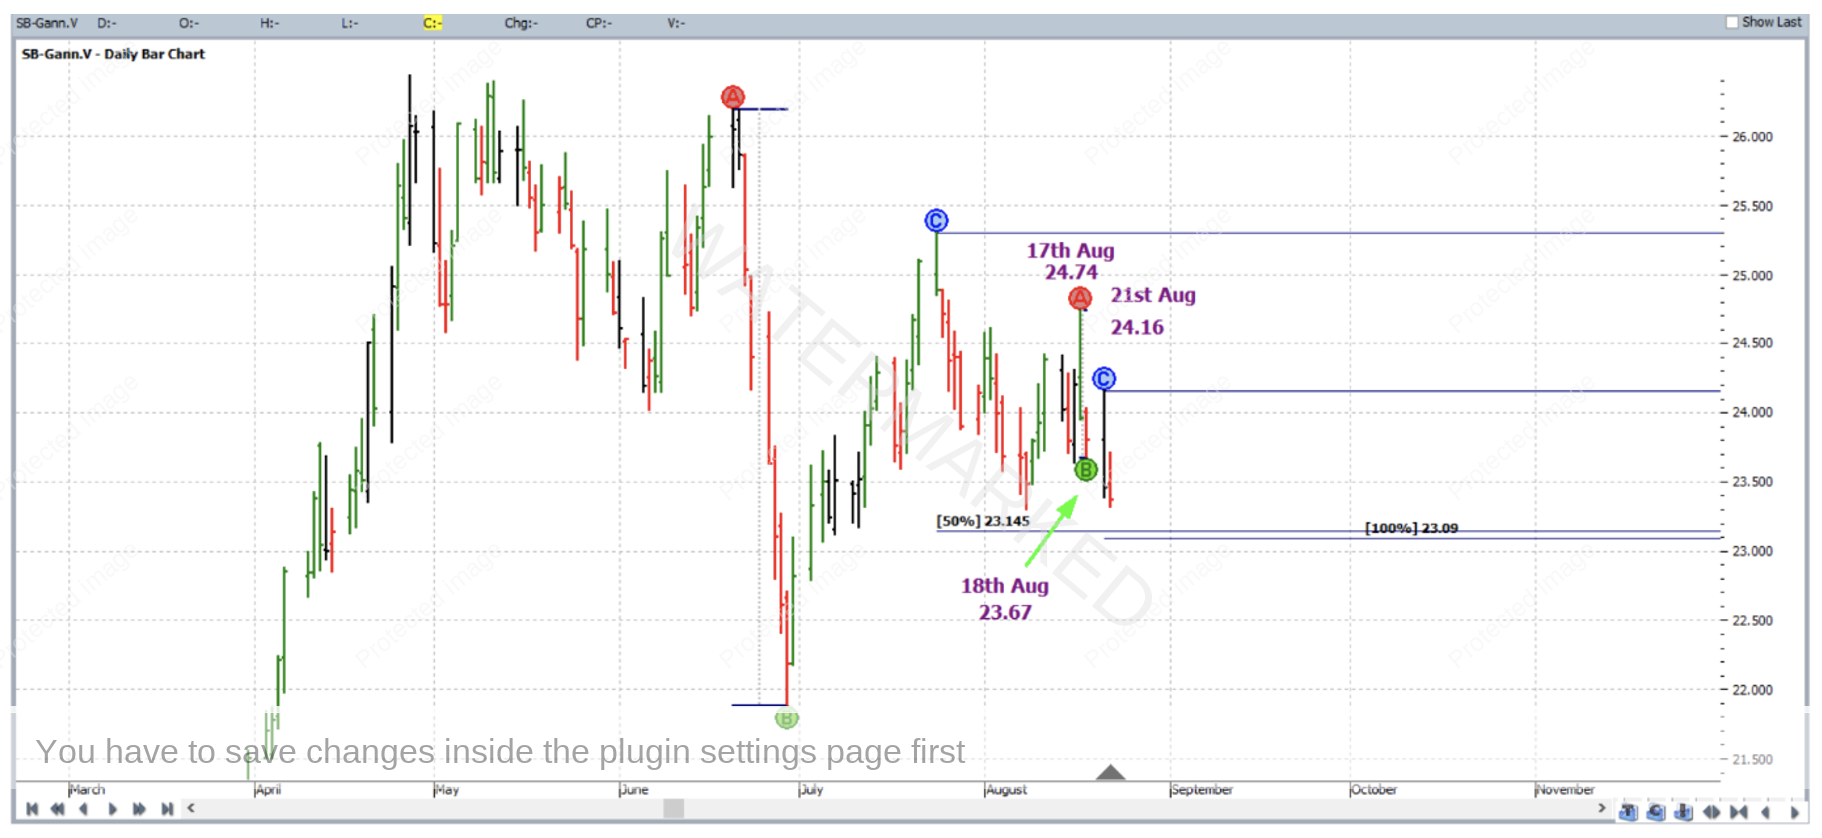
At the same time, this market was also approaching the 100% milestone of another ABC application. Points A, B and C were applied to successive turning points in the daily swing chart as follows:
Point A: 17 August 2023 high 24.74
Point B: 18 August 2023 low 23.67
Point C: 21 August 2023 high 24.16
The 100% milestone itself was 23.09 and this, the second input to a potential price cluster has been added to the chart. Again for clarity, all other milestones in this application were switched off except the 100% milestone.
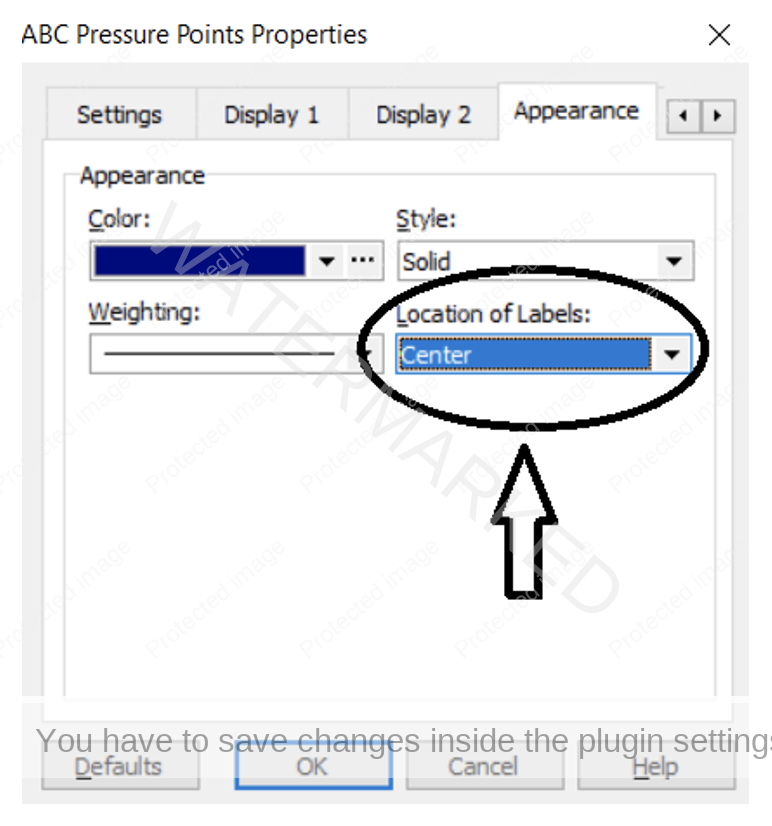
Another small but handy hint for constructing an analysis like this is to go into the ABC Drawing Tool’s Properties, go to the Appearance tab, and change the Location of Labels setting between Left, Right or Centre so that the milestone labels for each independent application of this tool do not overlap, or “crowd each other”. Therefore in the chart above so far, one application of the tool has its labels sitting to the Left, the other its labels positioned at Centre.
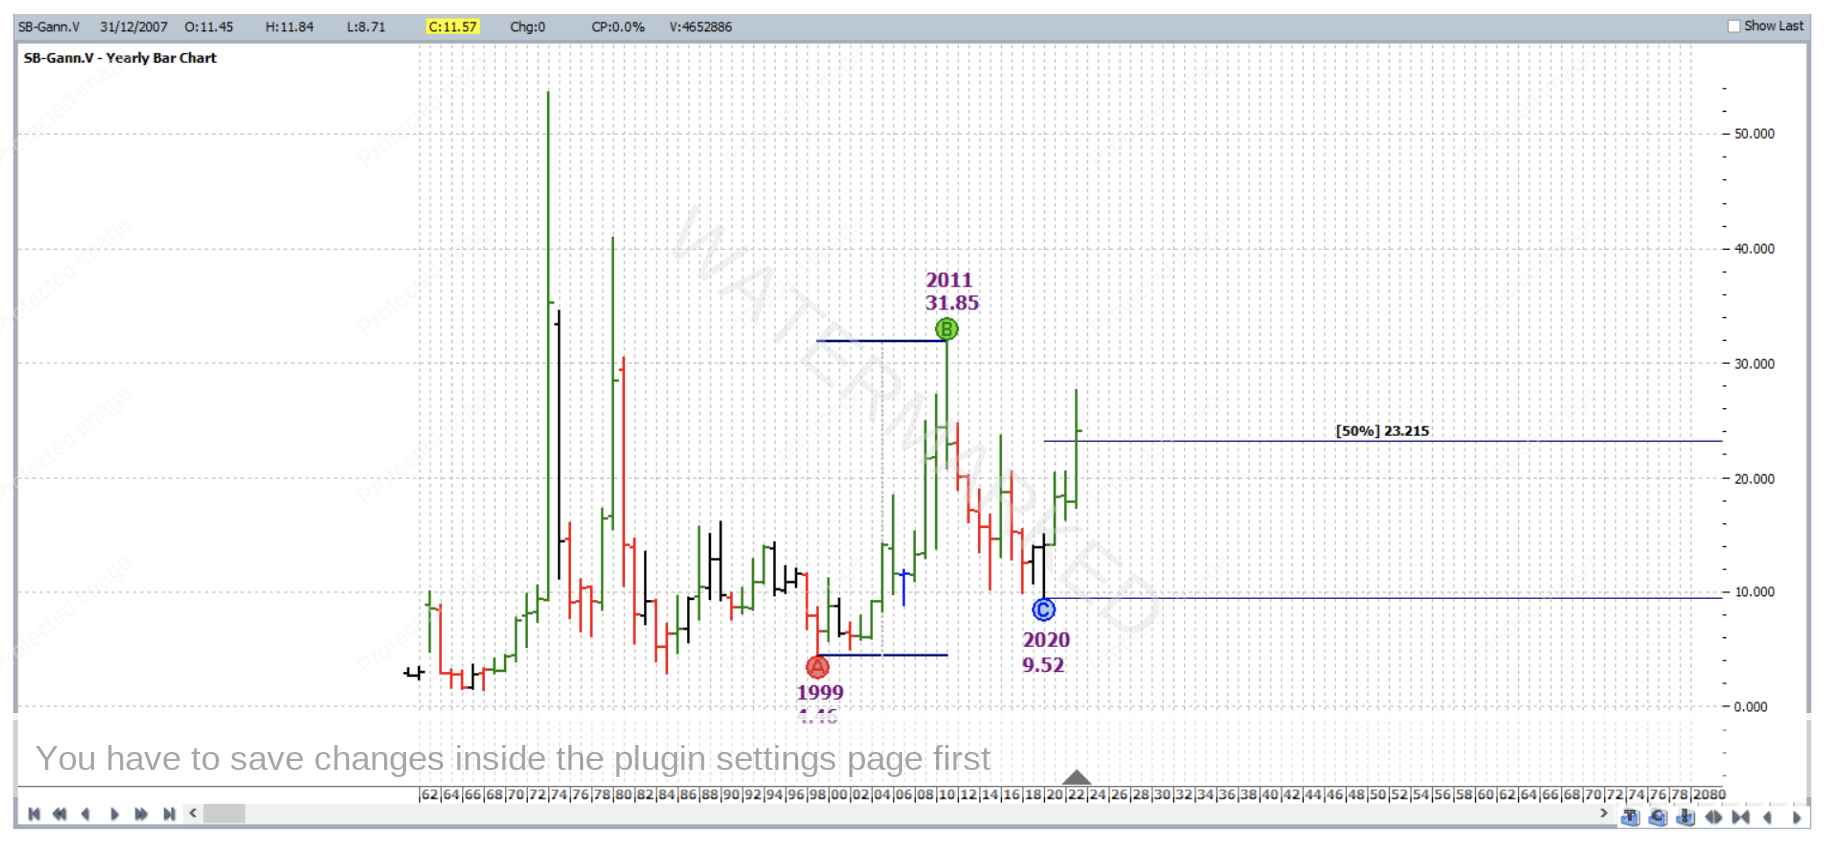
Point A: 1999 low 4.46
Point B: 2011 high 31.85
Point C: 2020 low 9.52
The 50% milestone in this case was 23.21, and the market was approaching this milestone from above (having initially broken through it with the potential to come back down and bounce off it).
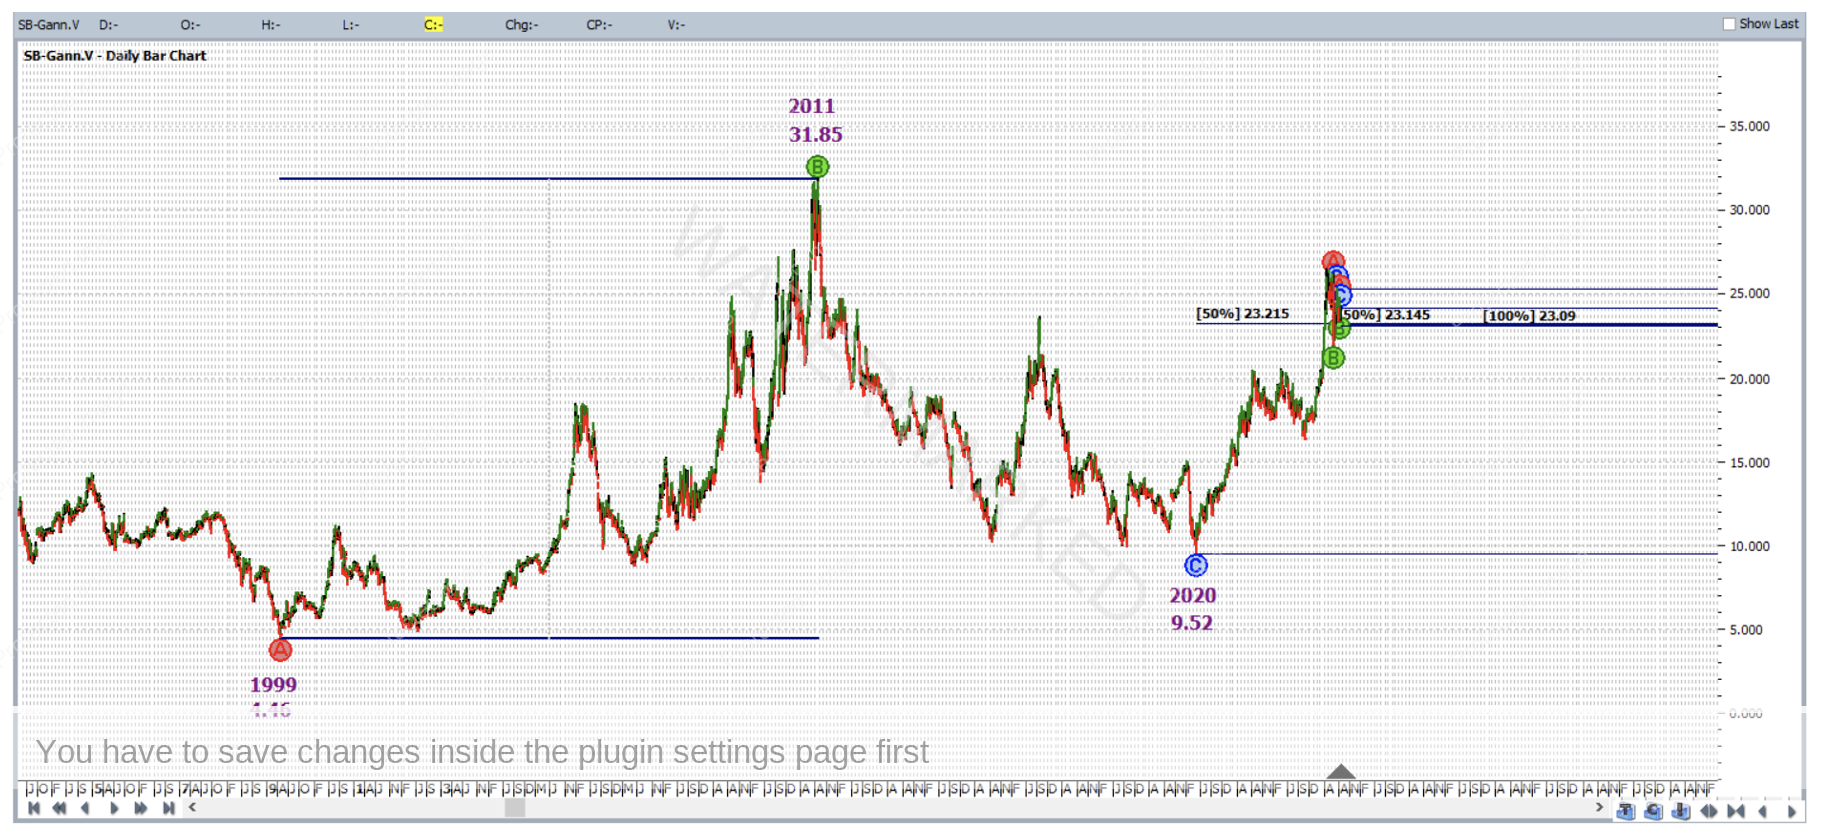
Adding the ABC immediately above to the daily bar chart, which had the first two price cluster inputs, has the analysis now looking like this:
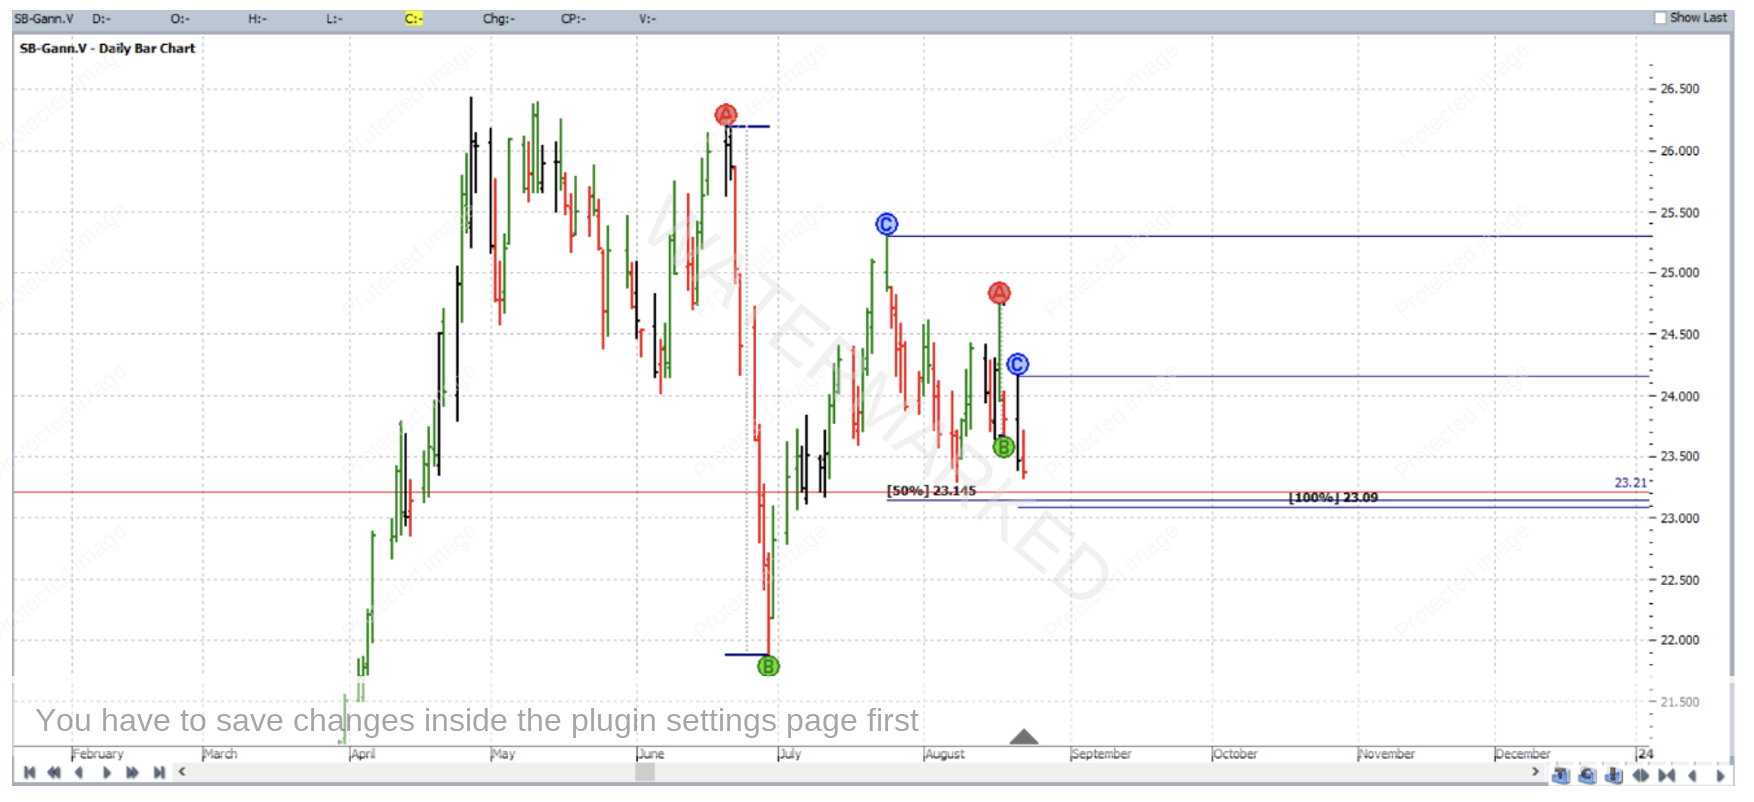
Despite a reasonable formatting effort thus far, the chart above is still a little jammed near the recent market action. So let’s zoom in. Note that when we do, the largest ABC application disappears because its Point C (2020 low) moves to left of screen. To account for that a simple horizontal line has been placed on the chart at 23.21 – the milestone which was the third input to the price cluster.
The price cluster average was 23.15 and on 23 August 2023 the market lowed, as mentioned at 23.08, false breaking the cluster average by 7 points which made for a relatively small error in relation to the average size of a daily bar in this market.
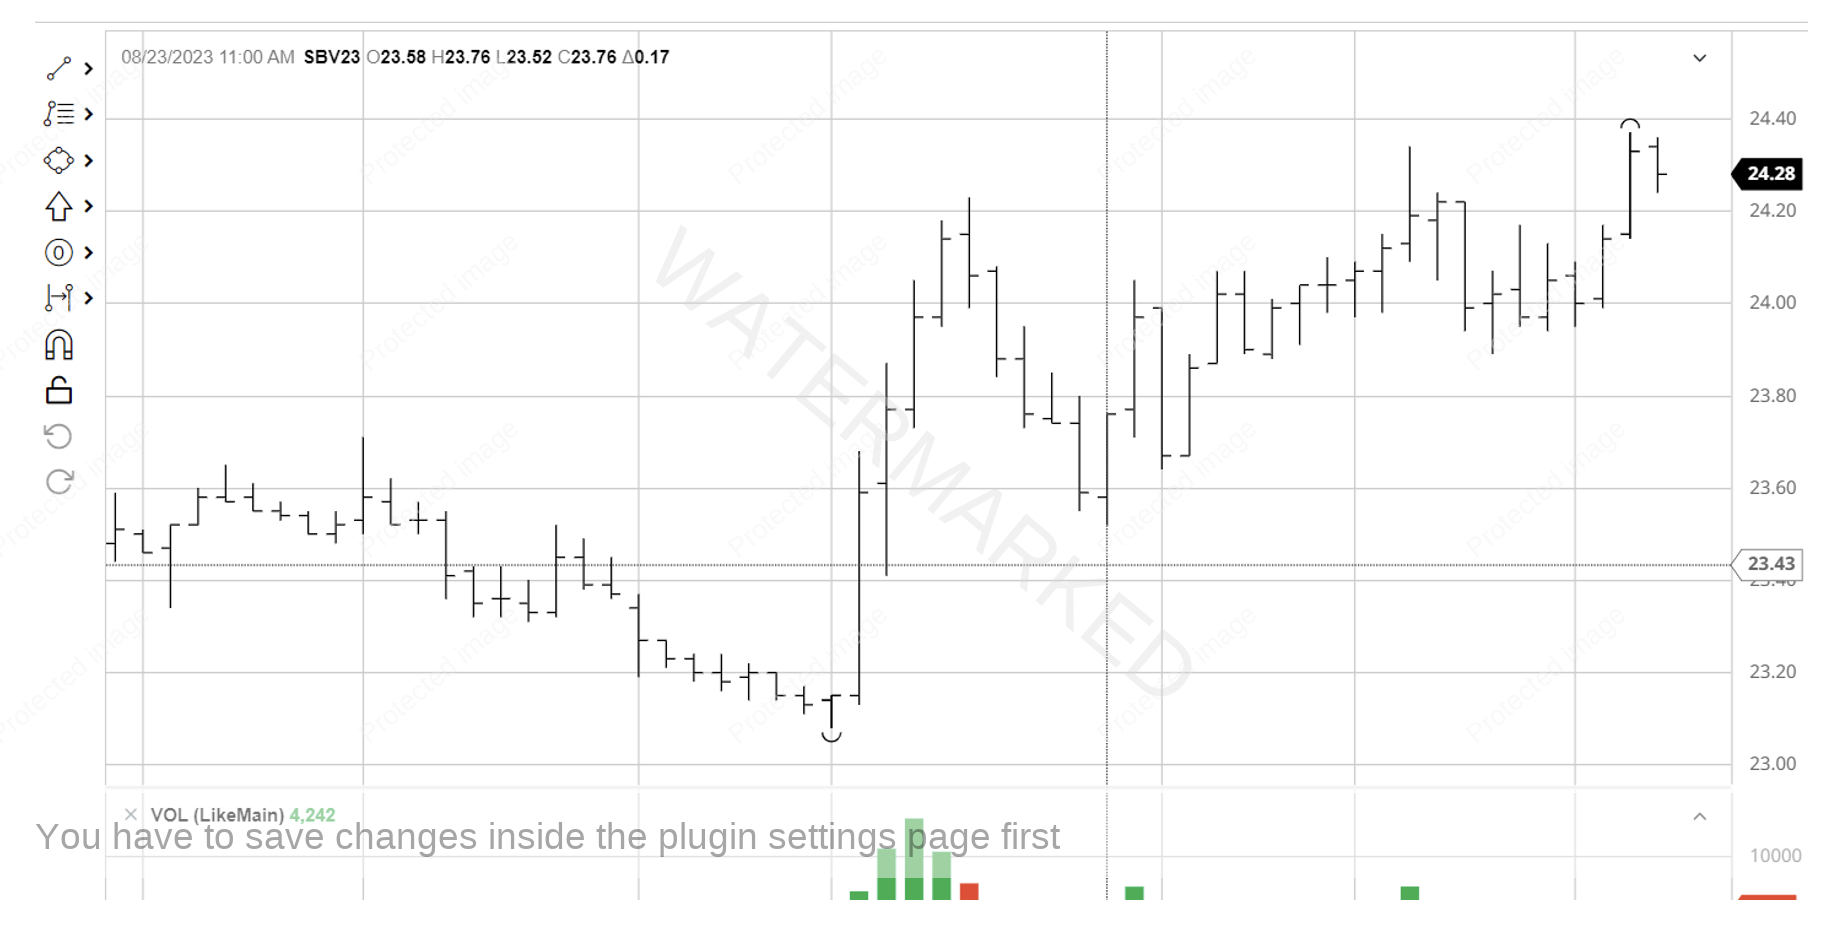
So what about a trade? Shown below is the 30 minute bar chart for Sugar’s October 2023 contract, from barchart.com; with the extreme low at 23.08; a first higher swing bottom entry on this chart on 23 August 2023 would have had you long this market at 23.77 with an initial stop loss at 23.51.
As for a reference range and the trade management, the AB reference range used for this trade was as shown below.
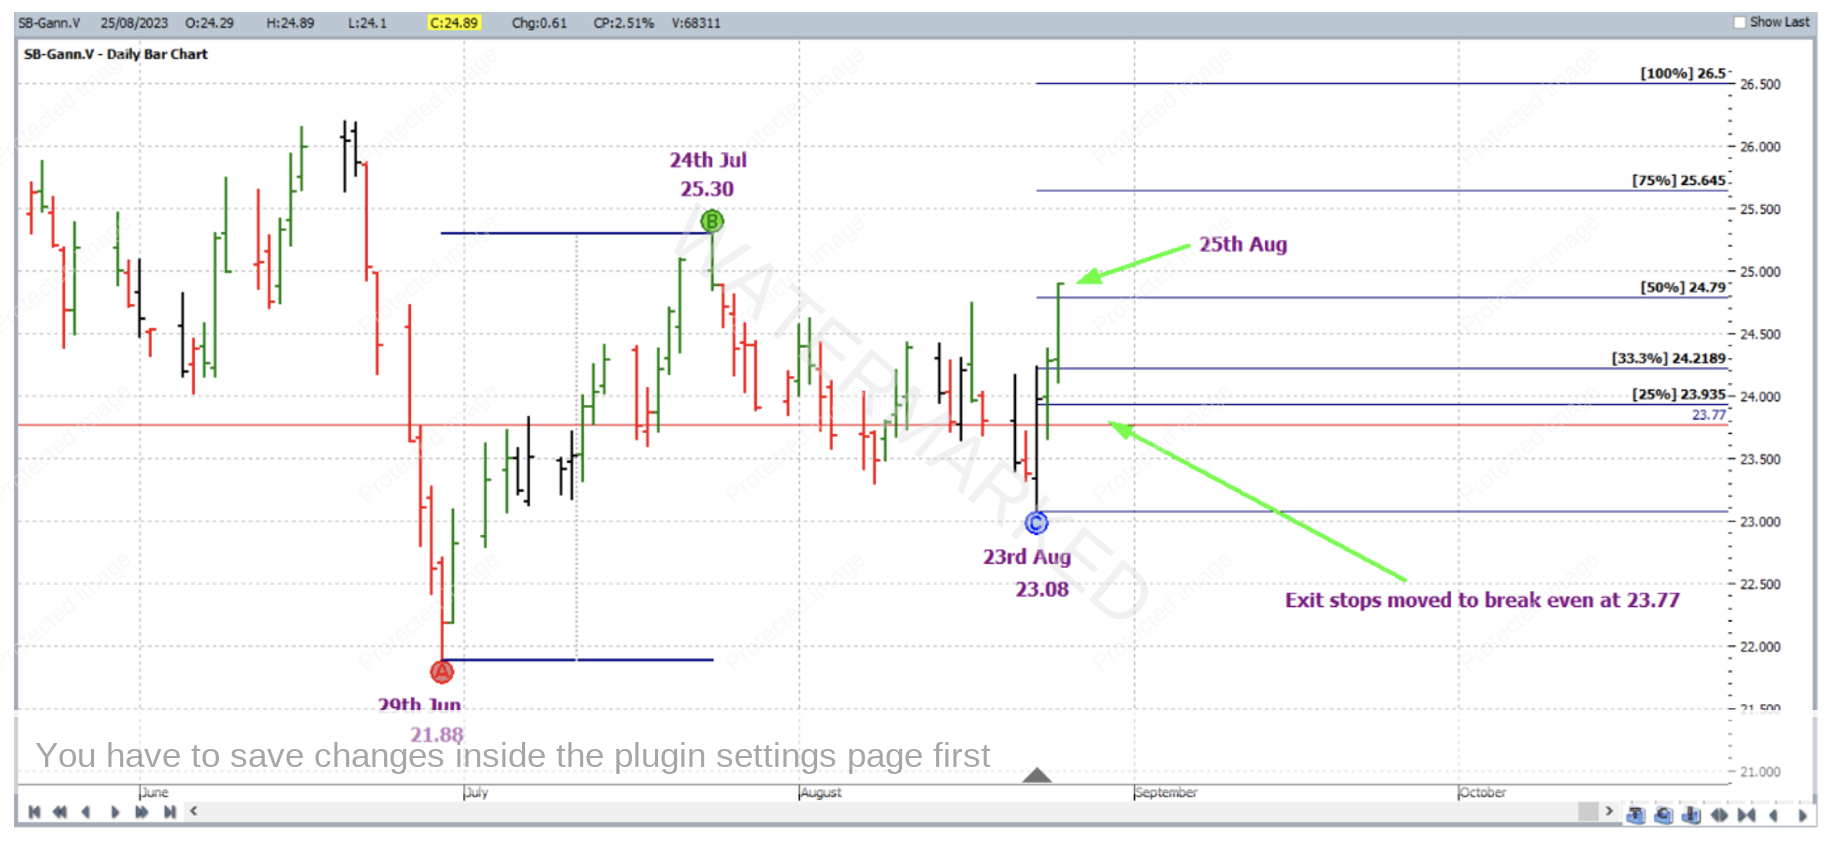
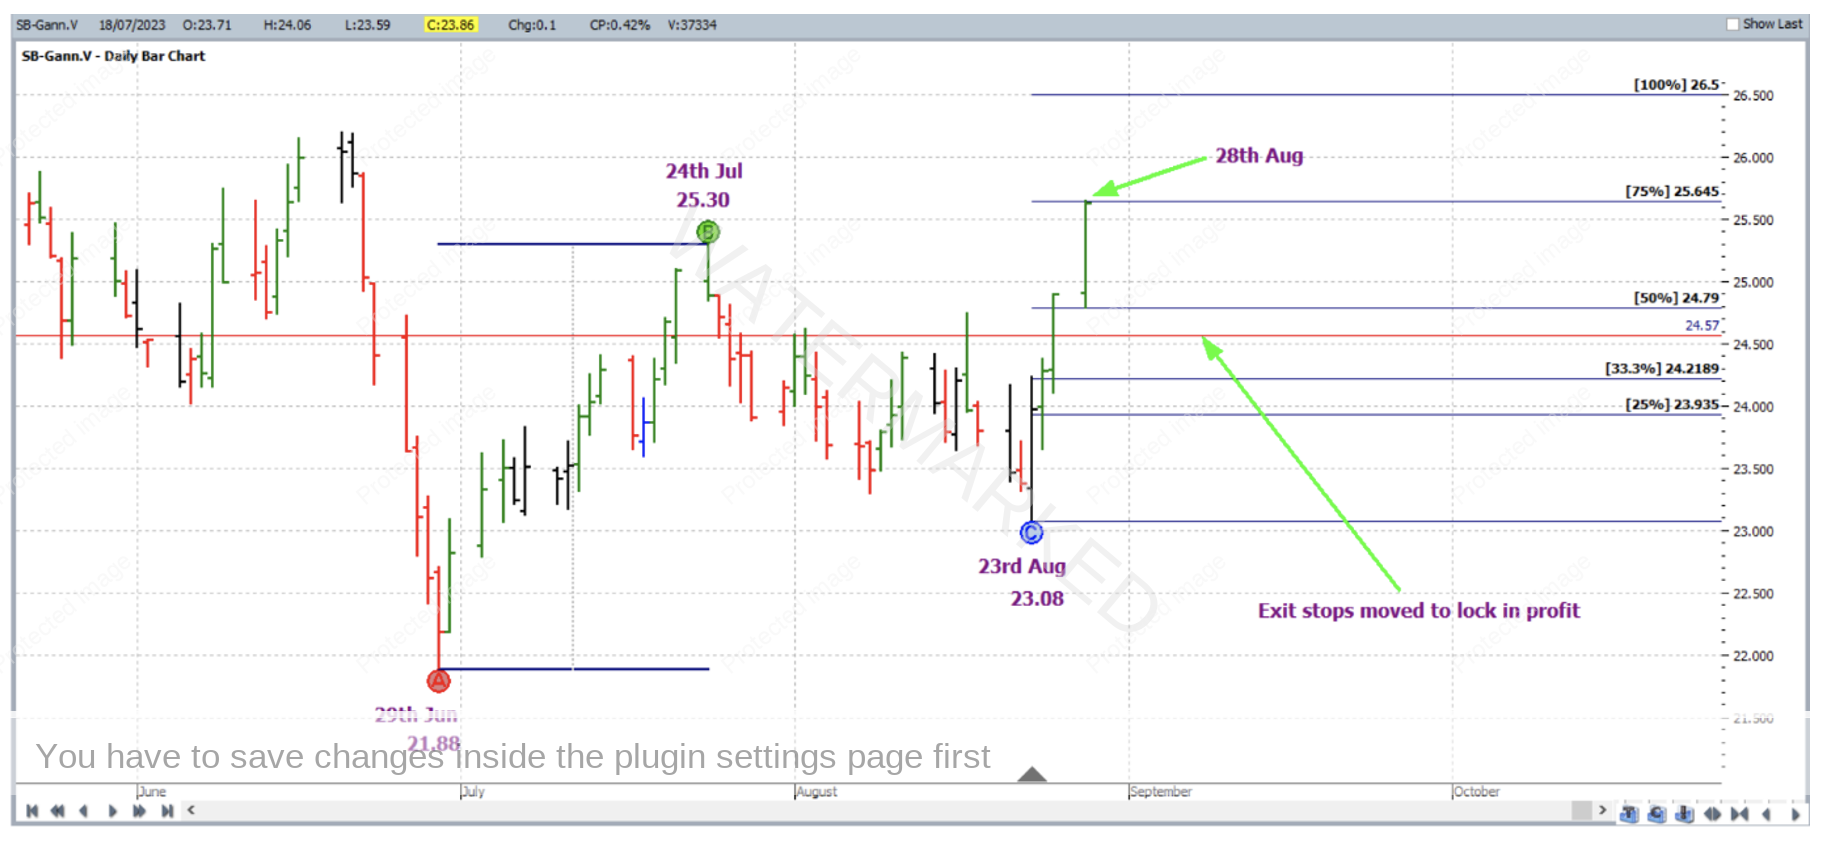
And with the trade to be managed “Currency Style”, when the market reached the 50% milestone on 25 August 2023, exit stops were moved to break even.
Then a trading day later on 28 August 2023, the market reached the 75% milestone and exit stops were moved to one third of the average daily range (approximately 22 points using the Average Range – AR tool, set to take input from the last 60 trading bars) below the 50% milestone.
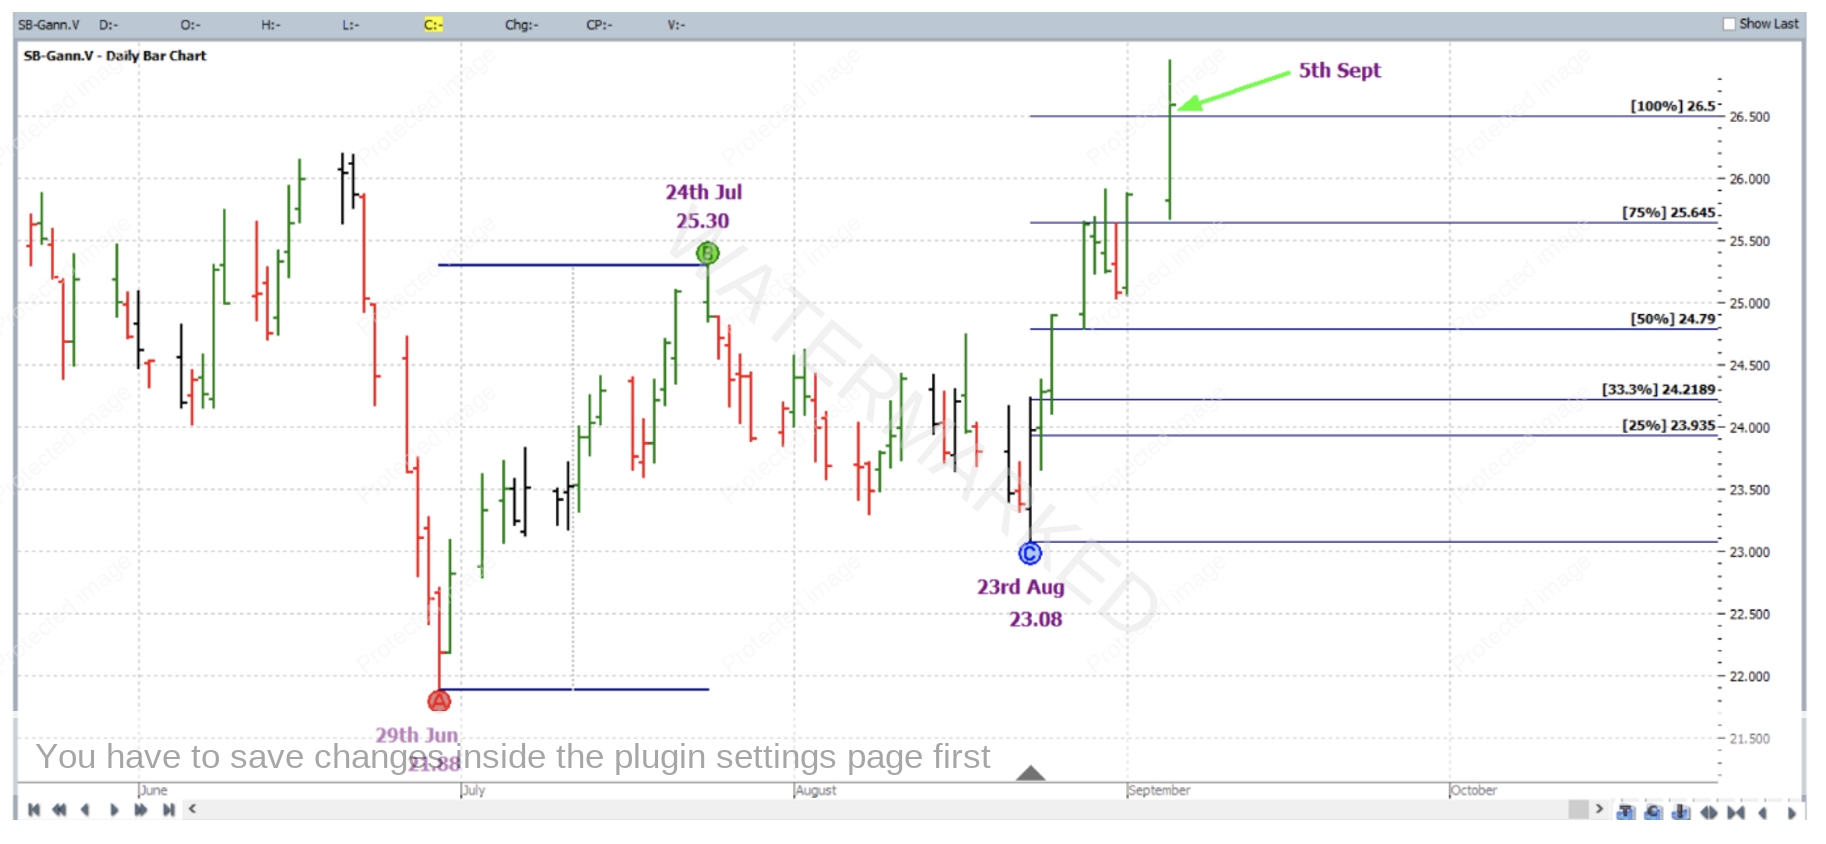
Then on 5 September 2023 the market reached the 100% milestone and profits were taken at 26.50.
Now let’s break down the rewards. The Reward to Risk Ratio:
Initial Risk: 23.77 – 23.51 = 0.26 = 26 points (point size is 0.01)
Reward: 26.50 – 23.77 = 2.73 = 273 points
Reward to Risk Ratio: 273/26 = approximately 10.5 to 1
According to the specifications on the ICE website each point of price movement changes the value of one Sugar futures contract by $11.20USD. So in absolute USD terms the risk and reward for each trade of the contract are determined as follows:
Risk = $11.20 x 26 = $291.20
Reward = $11.20 x 273 = $3,057.60
At the time of taking profit this reward was approximately $4,778 AUD.
If 2% of the account size was risked at trade entry, the resulting percentage change to the account size after taking profits would be calculated as:
10.5 x 2% = 21%
If trading this strongly trending market via a CFD, much lower minimum position sizes are available.
Work Hard, work smart.
Andrew Baraniak
