In Motion
The Soybean Meal futures market has featured in a few of our articles from this year and last year. And here it is again for this month’s case study. Being an agricultural commodity, it is a market that will definitely have its sideways periods, but rewards are there for the patient – when in motion it can deliver some high reward to risk ratio trades in relatively little time. When a market like this is trending strongly the analysis becomes clearer and more definitive and the decision to trade is easier.
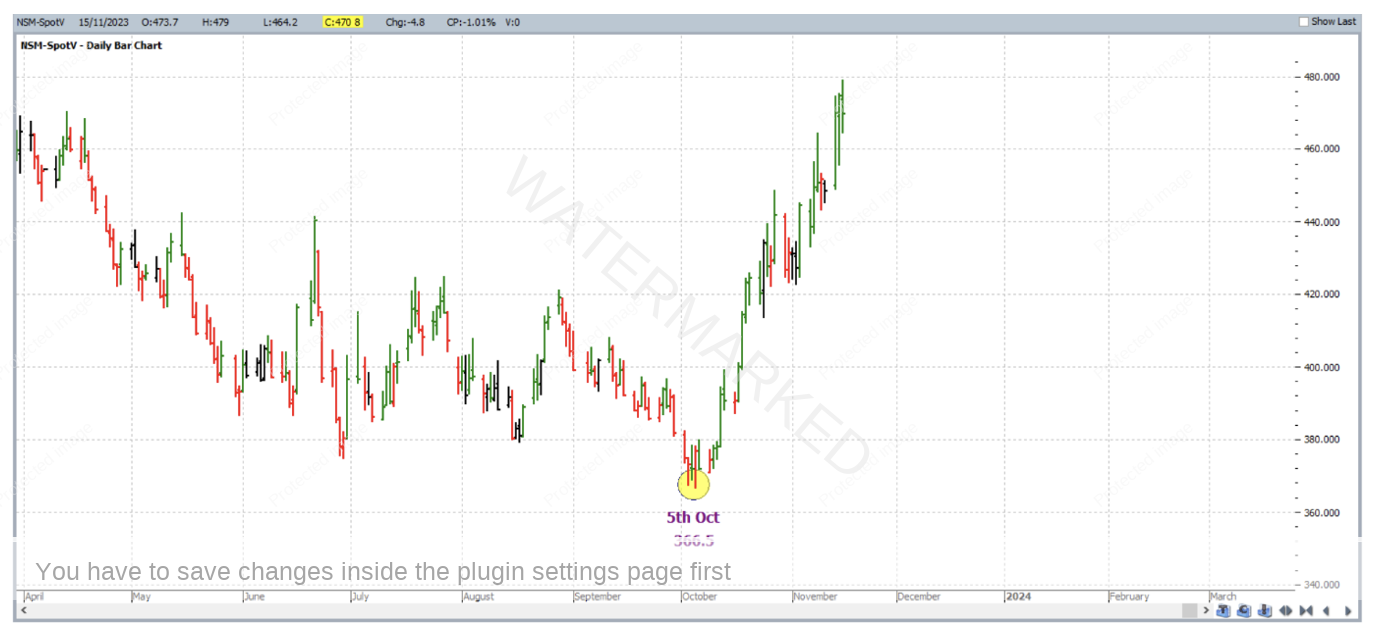
As can be seen from the chart below (symbol NSM-SpotV in ProfitSource), this market has had a strong rally out of its 5 October 2023 low. The market lowed at 366.5 USD per tonne.
But were there three solid price reasons supporting this low, giving us reason to enter a long trade? Here are three reasons considered by this article:
- Repeating Ranges – ABC Pressure Points:
Point A: 4 September 2012 high 541.8
Point B: 26 February 2016 low 258.9
Point C: 13 February 2023 high 508.2
…..this resulting 50% milestone was at 366.8
- Lows Resistance Card applied to the 2004 low:
….. 250% of this low is 366.5
- Repeating Ranges – ABC Pressure Points:
Point A: 28 August 2023 high 421.0
Point B: 8 September 2023 low 393.2
Point C: 11 September 2023 high 407.9
…..this resulting 150% milestone was at 366.2
The three price reasons averaged out at 366.5; the analysis above is obviously stated in words – as an exercise see if you can use your software to create the picture!
The cluster average is shown on the chart below in Walk Thru mode. On 5 October 2023 the market lowed right on the cluster average, this time with zero error.

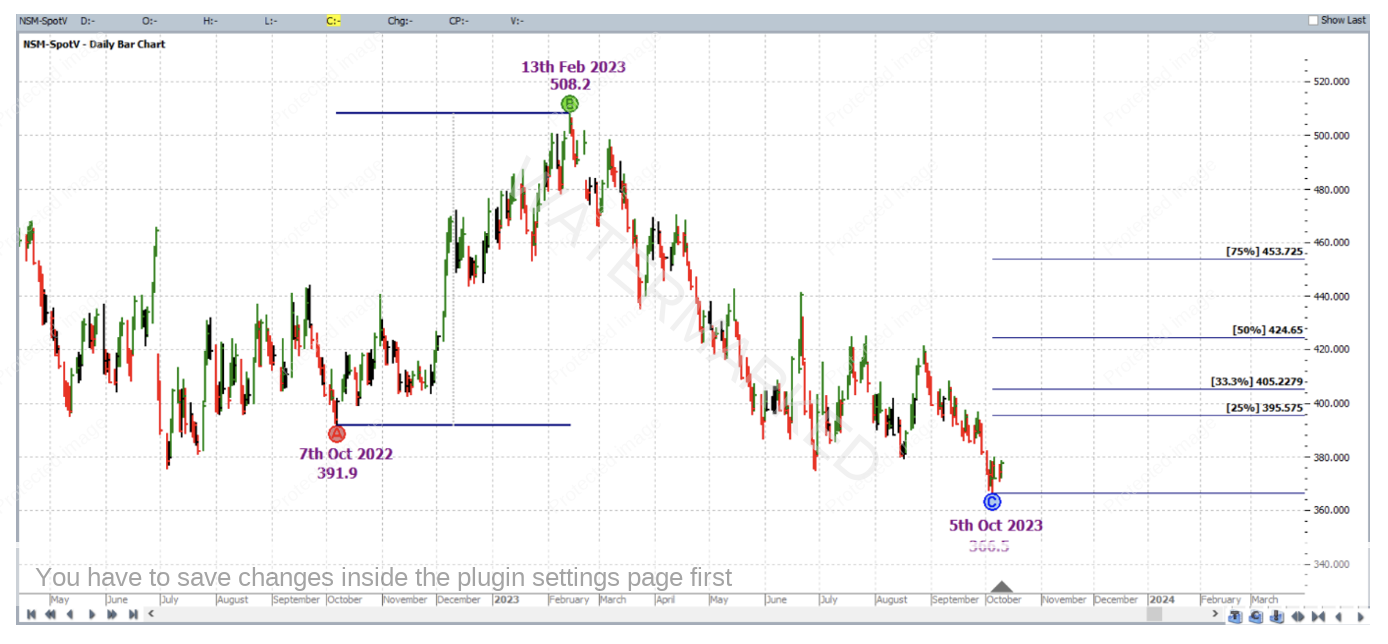
As for a long trade entry signal, a first higher swing bottom entry was confirmed on 10 October 2023, getting you long Soybean Meal at 377.2 with initial exit stop at 370.5; the reference range for the trade was the last monthly swing in the same direction i.e. Point A at the 7 October 2022 low, Point B at the 13 February 2023 high and of course Point C at the 5 October 2023 low. Stops managed Stock style had the exit target at the 75% milestone.
Zooming in, and progressing further in Walk Thru mode, on 20 October 2023 the market reached the 50% milestone and exit stops were moved to break even.
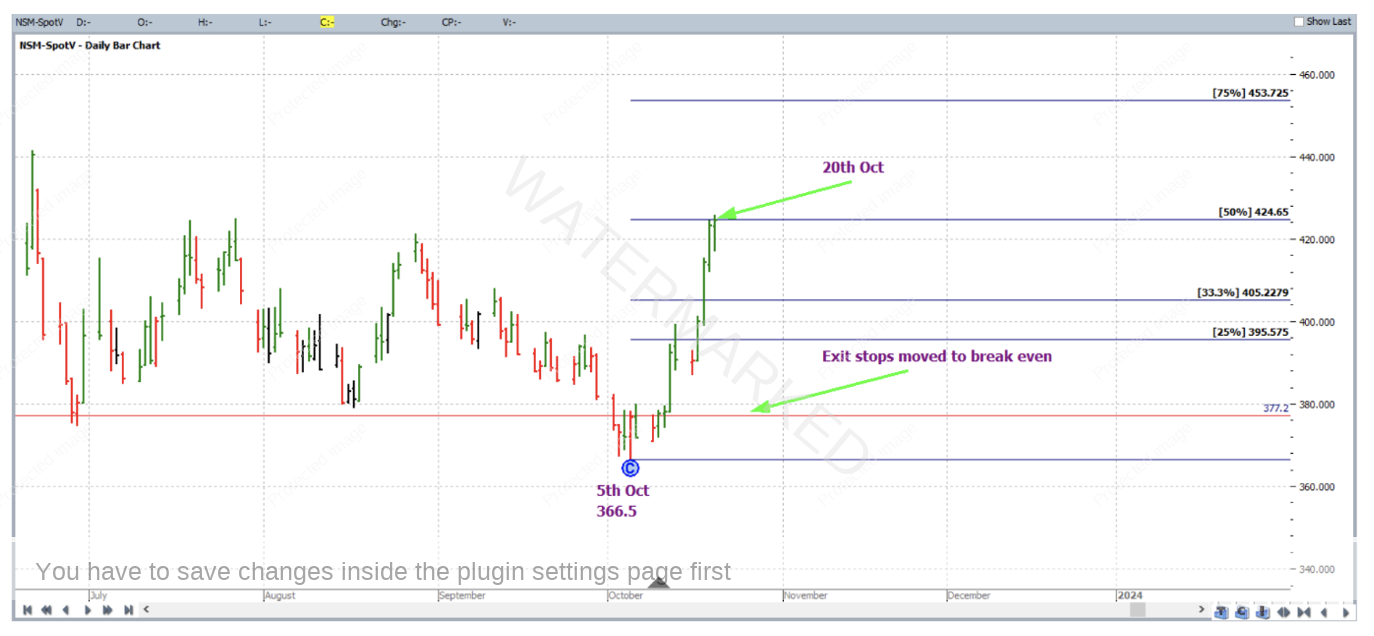
And on 7 November 2023 the market reached the 75% milestone and profit was taken at 453.7.

To break down of the rewards, first of all in terms of the Reward to Risk Ratio:
Initial Risk: 377.2 – 370.5 = 6.7 = 67 points (point size is 0.1)
Reward: 453.7 – 377.2 = 76.5 = 765 points
Reward to Risk Ratio: 765/67 = approximately 11.4 to 1
Each point of price movement changes the value of one Soybean Meal futures contract by $10USD. So in absolute USD terms the risk and reward for each trade of the contract was calculated as:
Risk = $10 x 67 = $670
Reward = $10 x 765 = $7,650
In AUD terms at the time of trade exit this reward was approximately equal to $11,860.
Risking 5% of the account size for this trade, the resulting percentage change to the account after taking profits would be:
11.4 x 5% = 57%
This strongly trending market is also accessible via CFDs for much smaller position sizes.
Work Hard, work smart.
Andrew Baraniak