Am I a Believer?
Last month’s article was titled Market Uncertainty and whether you are newer to markets or an old hand, the constant narrative we see repeated is that markets respond to the news of the day and participants react (or don’t react) to stimulus. This process is remarkable in the fact it is all supposed to be random and unpredictable therefore any approach that involves deeper analysis and making decisions around when and where to act is considered to be folly.
2023 has been a year that has not been “normal” for me in many ways, but I don’t believe I am on some random walk. There are linkages to previous decisions and events (my own historical data you could call it) and are no doubt creating stepping stones into the future across the pond we are travelling over. This year I have focused on the financial markets in terms of my research and analysis, this was sparked by a project at the start of the year that began with discussions on the DJUSFN (the US financials index).
You will recall Morgan Stanley was in the top 10 constituents, and I discussed some price work that I was following. You should refresh yourself on that going into this discussion.
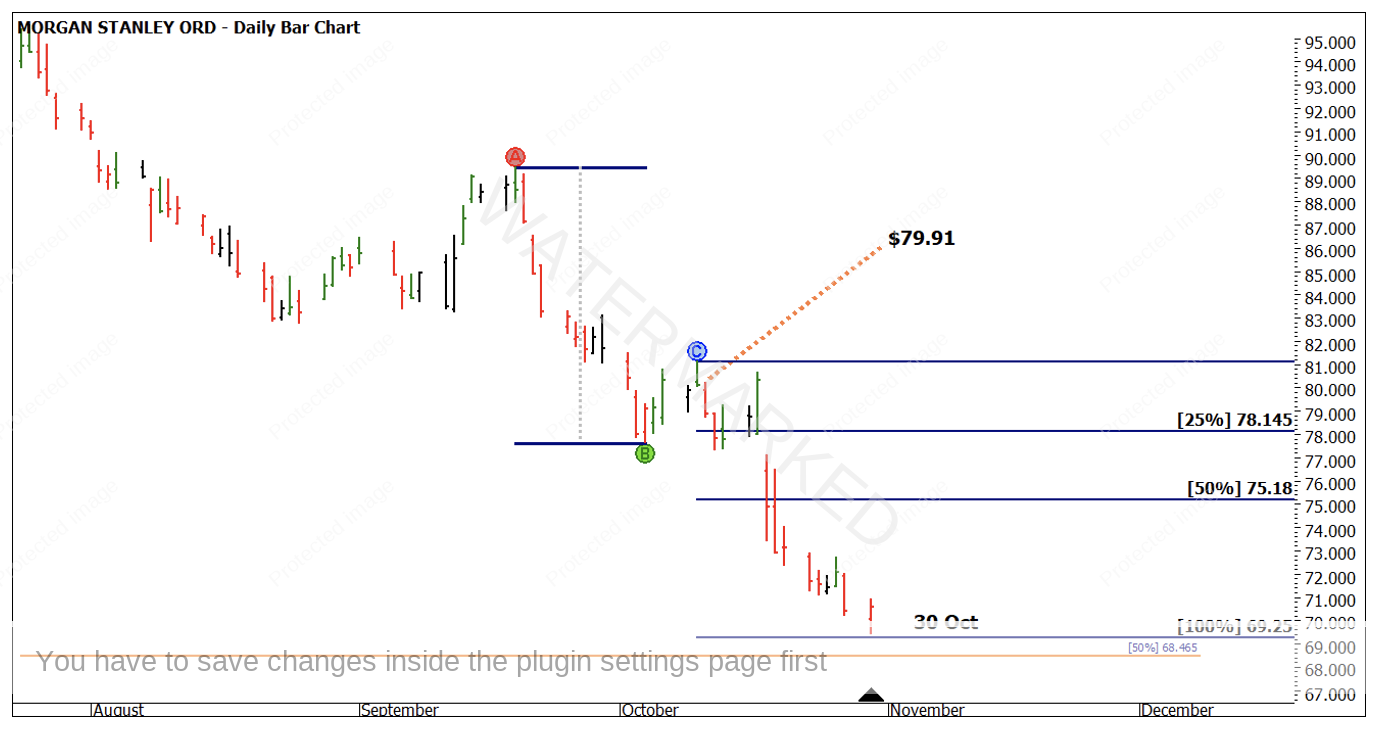
Chart 1 looks at the progression of the short trade that was highlighted. The price action continued to fall into the end of October and depending on your trading plan could have delivered a 7 to 1 Reward to Risk Ratio.
Chart 1 – Daily Bar Chart MS. NYSE
A simple swing trade under a price level of significance $81.62 (see last month) is not what I am hoping turns any indecision you have into belief that markets are not some random mess.
Trading with confidence built around research and history requires much more than a technical analysis process, to me it comes from witnessing larger cycles colliding and repeating to give you unshakeable confidence that a trade should be taken. On a side note, that unshakeable confidence cannot be exchanged for no risk management as markets will not always behave.
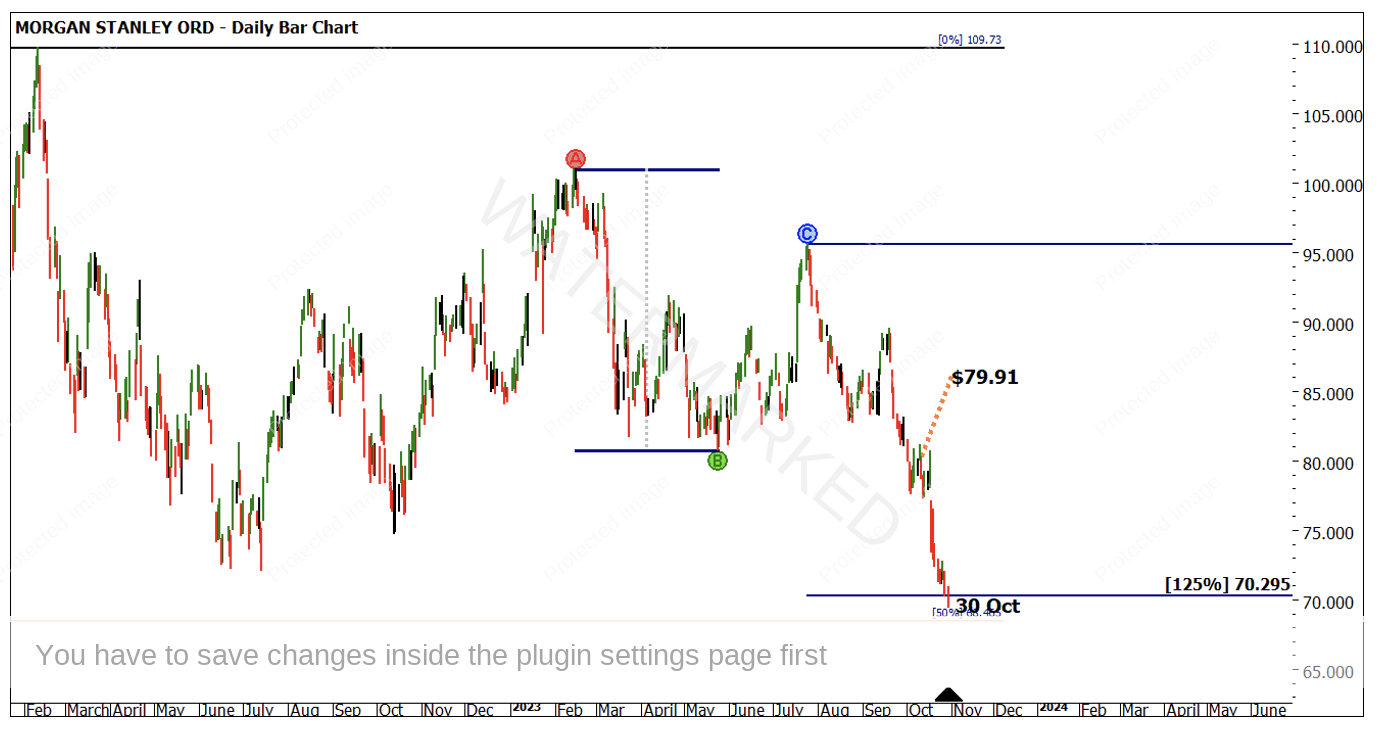
Charts 2,3,4 all contain price projections to the downside that provide signs that the market was creating a cluster around the low of 30 October. The eventual low of $69.42 was higher than the 100% price repeat of $69.25. This subtle pull up above support shows the market was running out of puff.
Chart 2 – Daily Bar Chart MS. NYSE
Chart 3 – Daily Bar Chart MS. NYSE
Chart 4 – Daily Bar Chart MS. NYSE
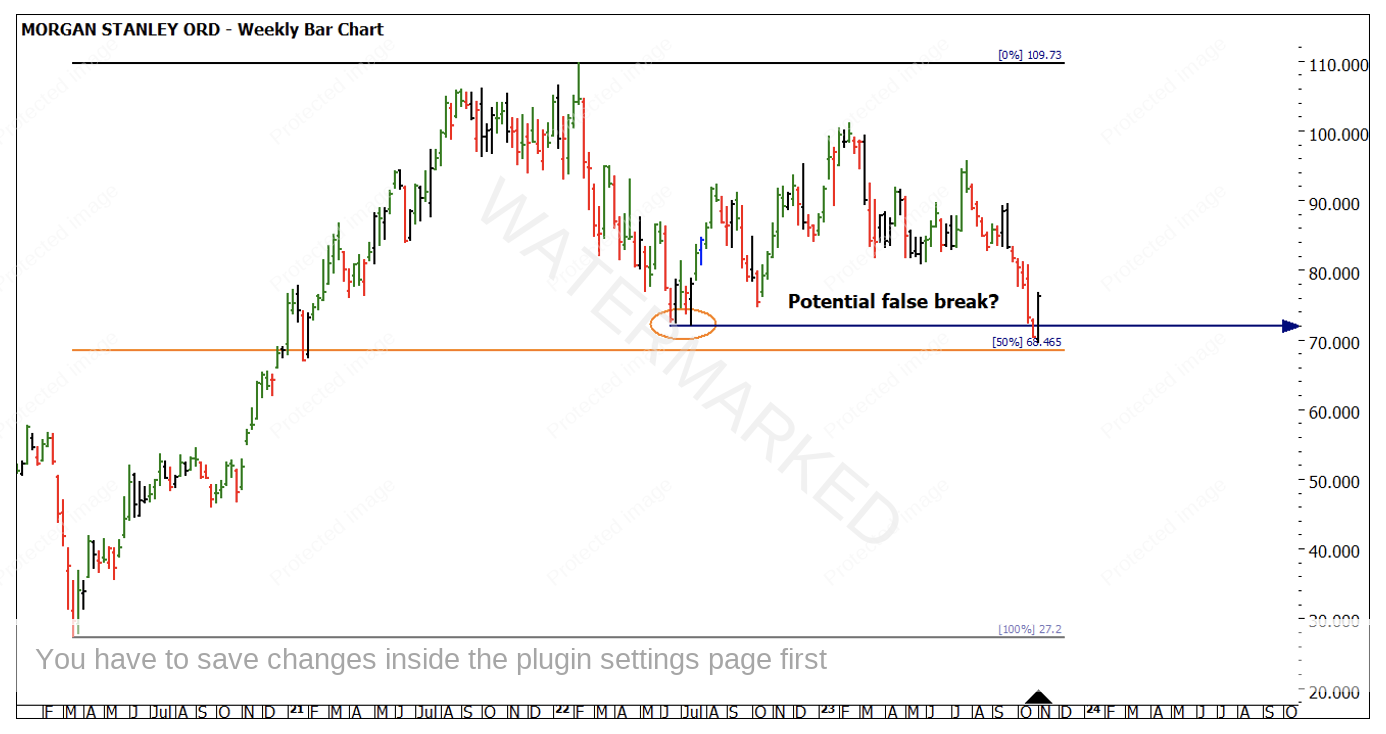
The orange horizontal line in all of the above charts is the 50% milestone of the major ranges of the last 3 years. Note in Chart 5 the possible false break of the lows of 2022. When a market pulls up short of major milestones, we should take note.
Chart 5 – Daily Bar Chart MS. NYSE
Are you a believer yet? Possibly not as I would also continue to seek proof that this is not all a random pattern that I have just stumbled across. Morgan Stanley has a market cap of $123B USD and is a major player in financial services. With a diverse stable of products and services we could happily suggest there is no reason to suggest it’s not again based on random business outcomes.
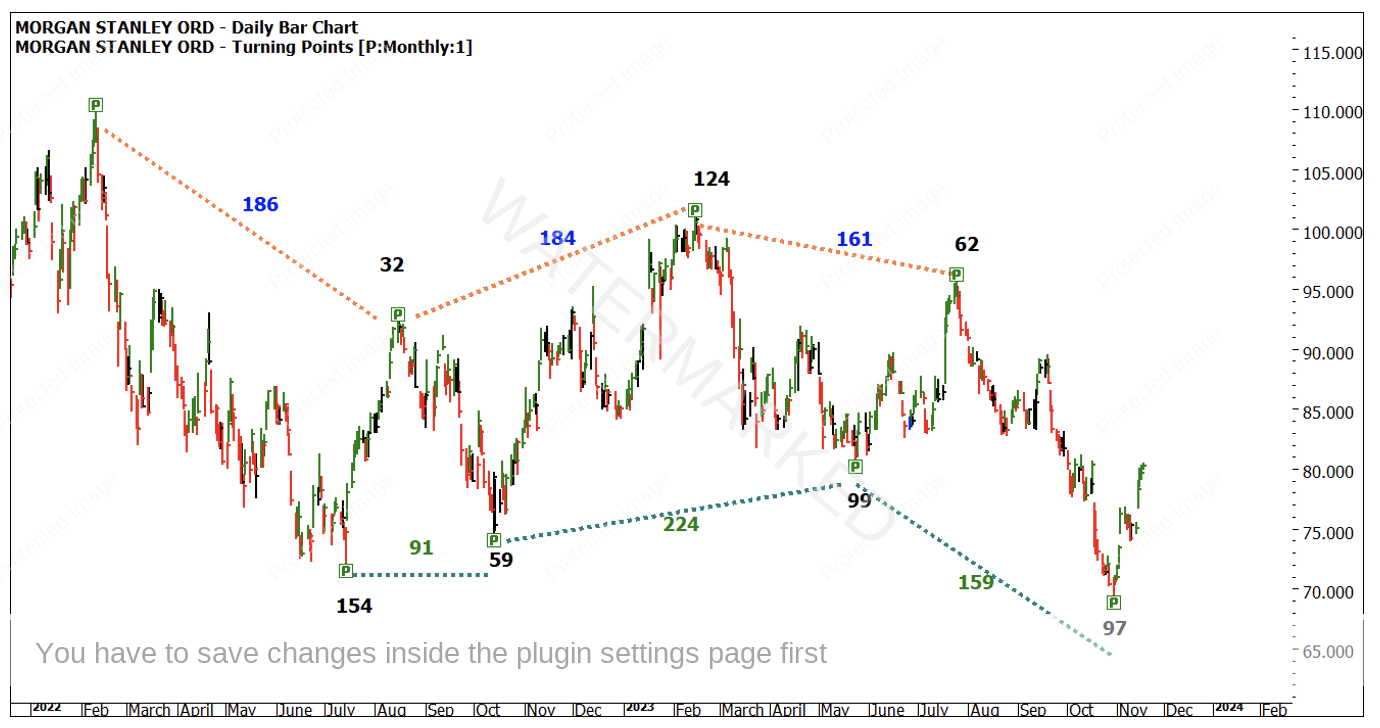
The ability to run your signals (via your trading plan) through another filter is very handy. As an early Christmas gift, I am going to leave you with last chart that captures the last two years from the 2022 cycle high. With three colour coded numbers, what it identifies is some basic time counts between various highs and lows, a second-dimension filter that allowed a trader to zoom into the price action around 30 October and look for a reversal. For those who have commenced their learning then this should make a lot of sense, otherwise, add this to the list of study you should be looking to embark upon.
Chart 6 – Daily Bar Chart MS. NYSE
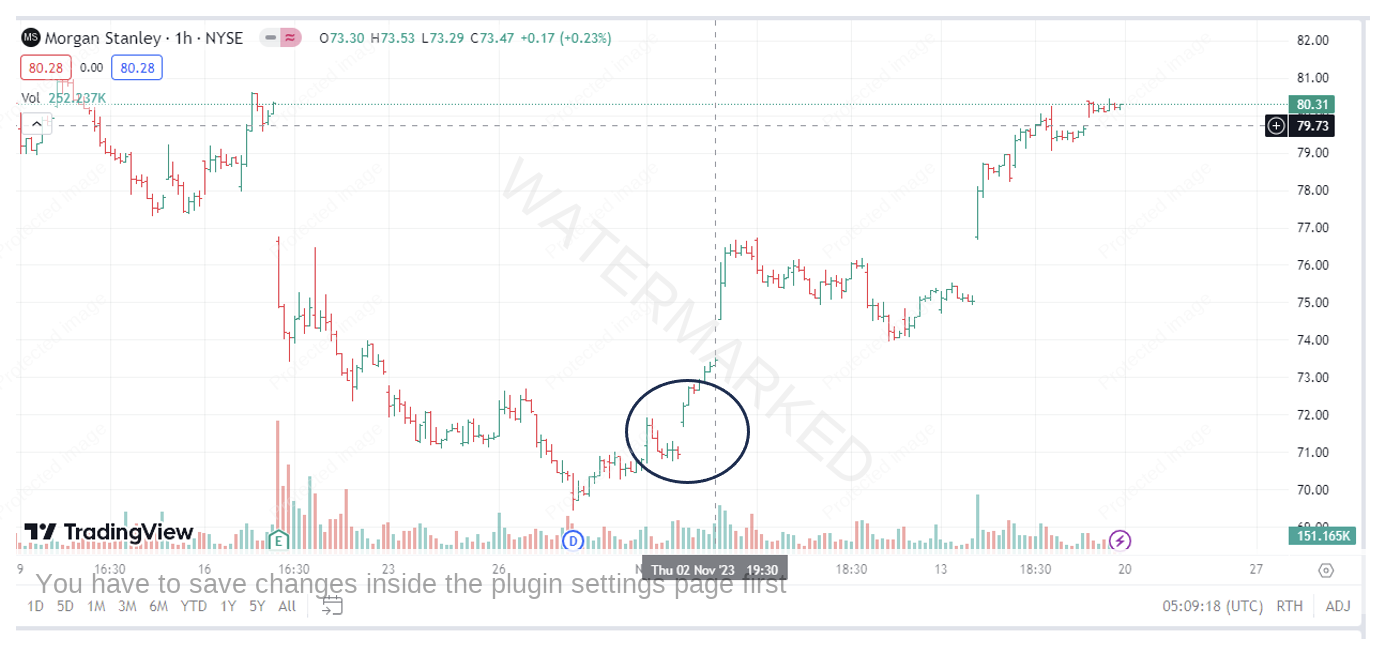
A view of the turning point around the 30th of October on an intraday chart allows us to stalk for a change in trend and a potential low risk entry. A gap up and break of previous highs was a signal for a new long trade or a potential stop and reverse. Entry was possible at $71.95 and since then the market has moved to approximately $80 USD, the risk on this position was $0.70 so currently over 8 to 1 Reward to Risk.
Chart 7 – 1 Hour Bar Chart MS. NYSE
Good Trading
Aaron Lynch
