The December Contract Chart
This month’s article takes a look at using a chart type for a futures market which is other than a continuous chart we typically use like the SpotV charts in ProfitSource.
This time the analysis and trade execution are both drawn from an individual and discontinuous chart which is that for the December 2023 Soybean Oil futures contract. Why should we look at this chart? Due to seasonal factors, different contracts for the same commodity can and will trade at different prices at the same time. Therefore one contract’s chart can provide us with a tradeable set up, while other charts for the same commodity (continuous or otherwise) may not.
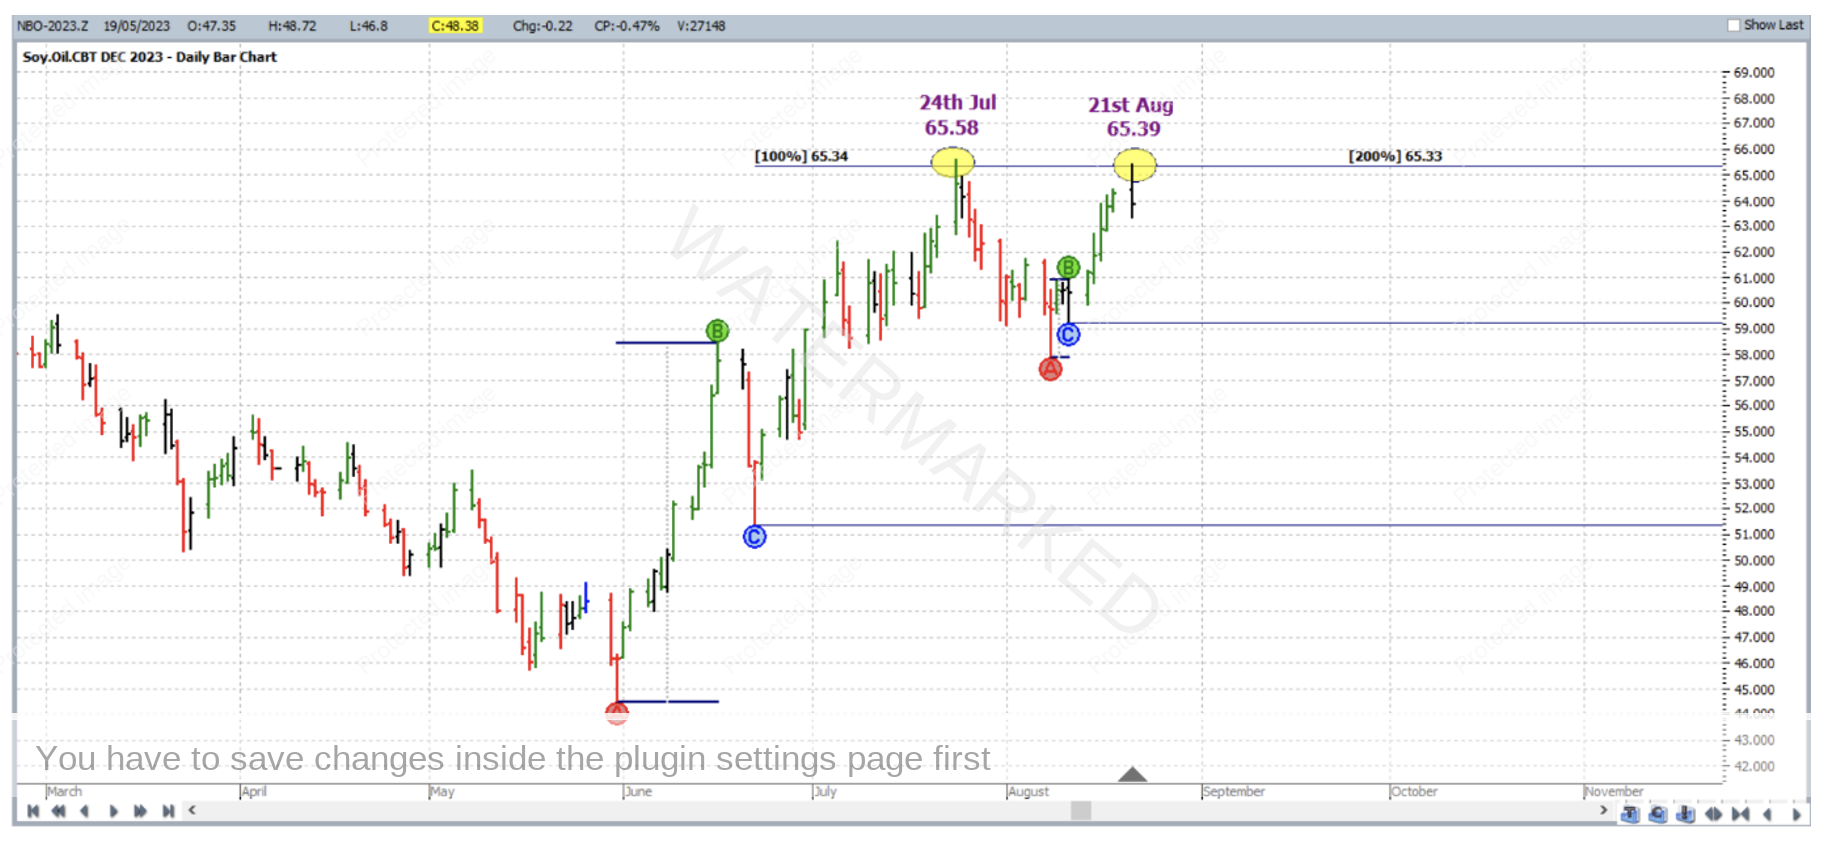
The setup – double tops at 100% of a weekly swing chart range and 200% of a smaller range. This is shown below in the ProfitSource chart in Walk Thru Mode up until 21 August 2023, the second of the two tops.
The larger ABC formation (based directly off the weekly chart) had its points placed as follows:
Point A: 31 May 2023 44.47
Point B: 16 June 2023 58.45
Point C: 22 June 2023 51.36
…. 100% milestone at 65.34;
The smaller ABC formation had its points placed as follows:
Point A: 8 August 2023 57.86
Point B: 11 August 2023 (high) 60.91
Point C: 11 August 2023 (low) 59.23
…. 200% milestone at 65.33;
The chart symbol in ProfitSource was NBO-2023.Z; it would be a worthwhile exercise to reproduce this analysis with your trading software.
Now by contrast, if we attempt to produce the same setup but this time with Soybean Oil’s continuous chart (where prices come from the contract of highest volume, symbol NBO-SpotV in ProfitSource), the same set up/price cluster is not there. One of the main price analysis inputs – the weekly ABC formation’s 100% milestone, does not cluster with the other two analysis inputs. So this chart would not have told us to trade the double top with the same level of confidence. In other words on this occasion by only analyzing this chart you may have missed a trade that was presented by the other chart.
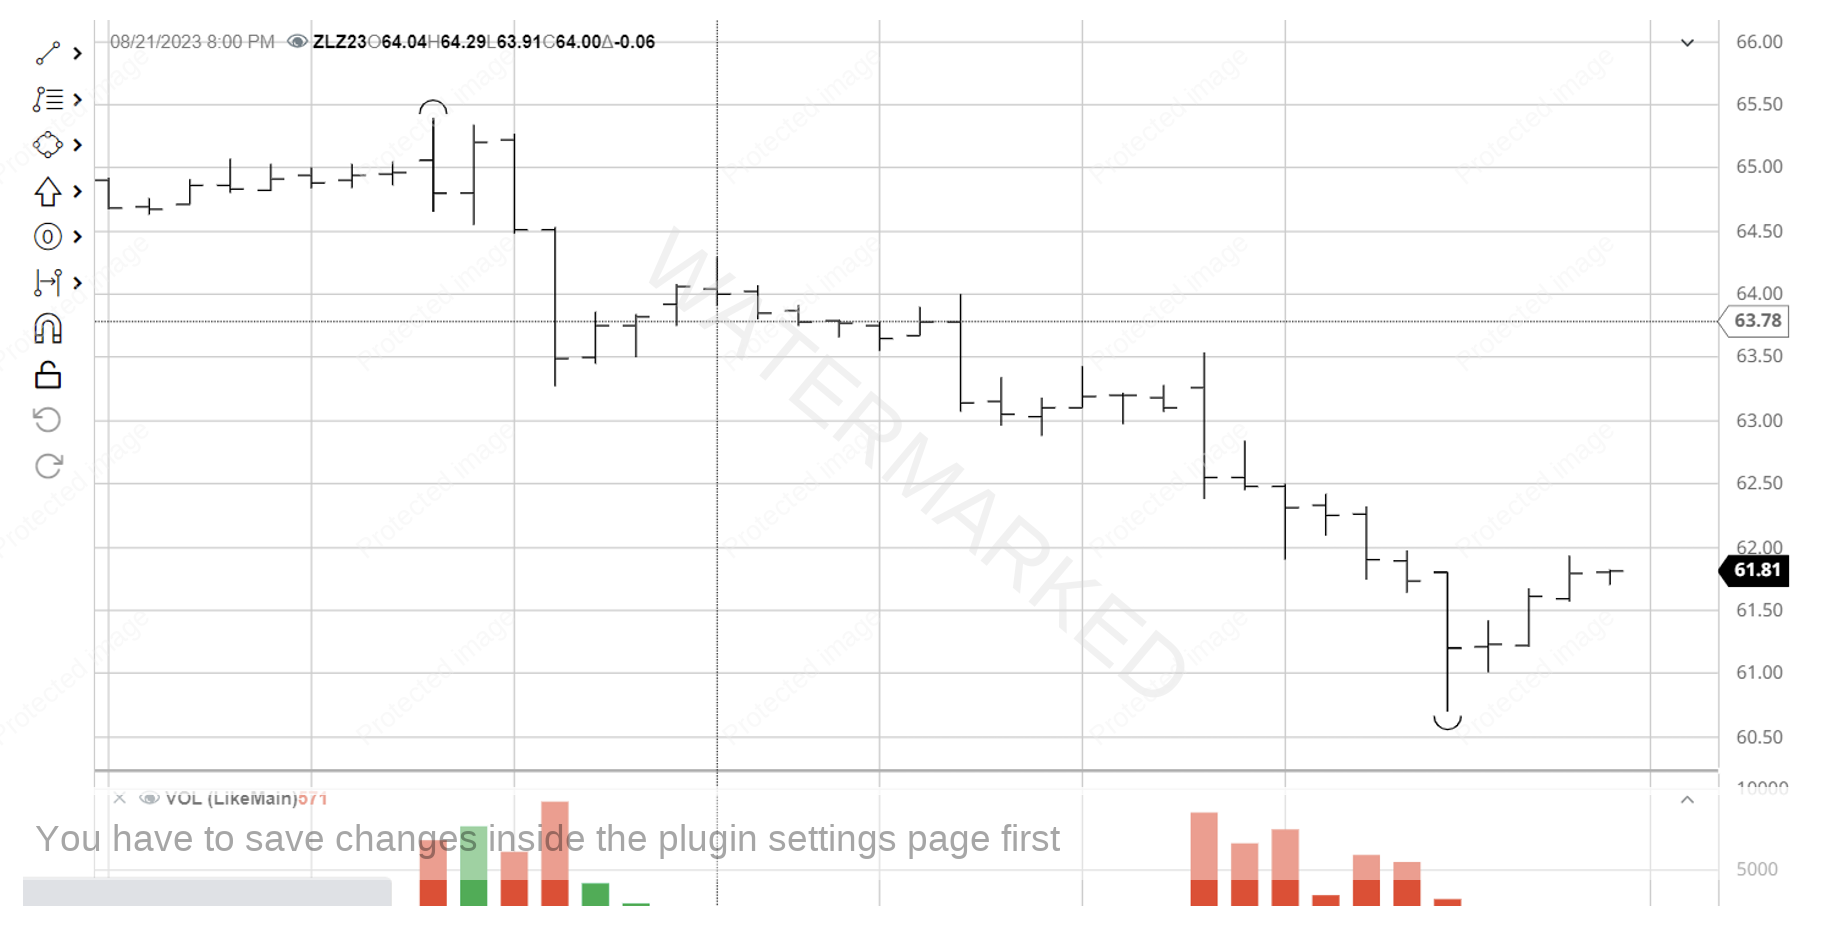
As for the actual short trade itself out of the two double tops on the individual contract chart, the large outside reversal bar which was 21 August 2023, would not have allowed for a particularly good Reward to Risk Ratio (with entry and initial exit stops one point either side of its high and low), therefore could we have been on the lookout for an intraday chart entry on the day of the high? Below is a screenshot from that hourly bar chart of the said futures contract from barchart.com. A first lower swing top on the hourly chart would have had you short Bean Oil at 63.90 with an initial exit stop loss at 64.30; making for a 40 point risk (point size being 0.01).
This risk of 40 points across the hourly bar was of course relatively small compared to the average risk across a daily bar in this market which was just shy of 200 points (based on the 60 daily trading bars up until and including 21 August 2023). And these risk sizes are very important to consider if the goal is to achieve a high Reward to Risk Ratio.
One other thing to bear in mind is that this was not a particularly strong set up. There was only a single monthly turning point involved (which coincided with Point A of the weekly ABC), let alone a number of turning points from the monthly chart or above. Therefore, it is a trade for which we’d be more likely to opt for minimum risk in both relative and absolute terms, but still make the trade worthwhile by aiming for a very high Reward to Risk Ratio. As will be seen by the end of this article, trading double tops down to the 200% milestone can certainly help make this possible.
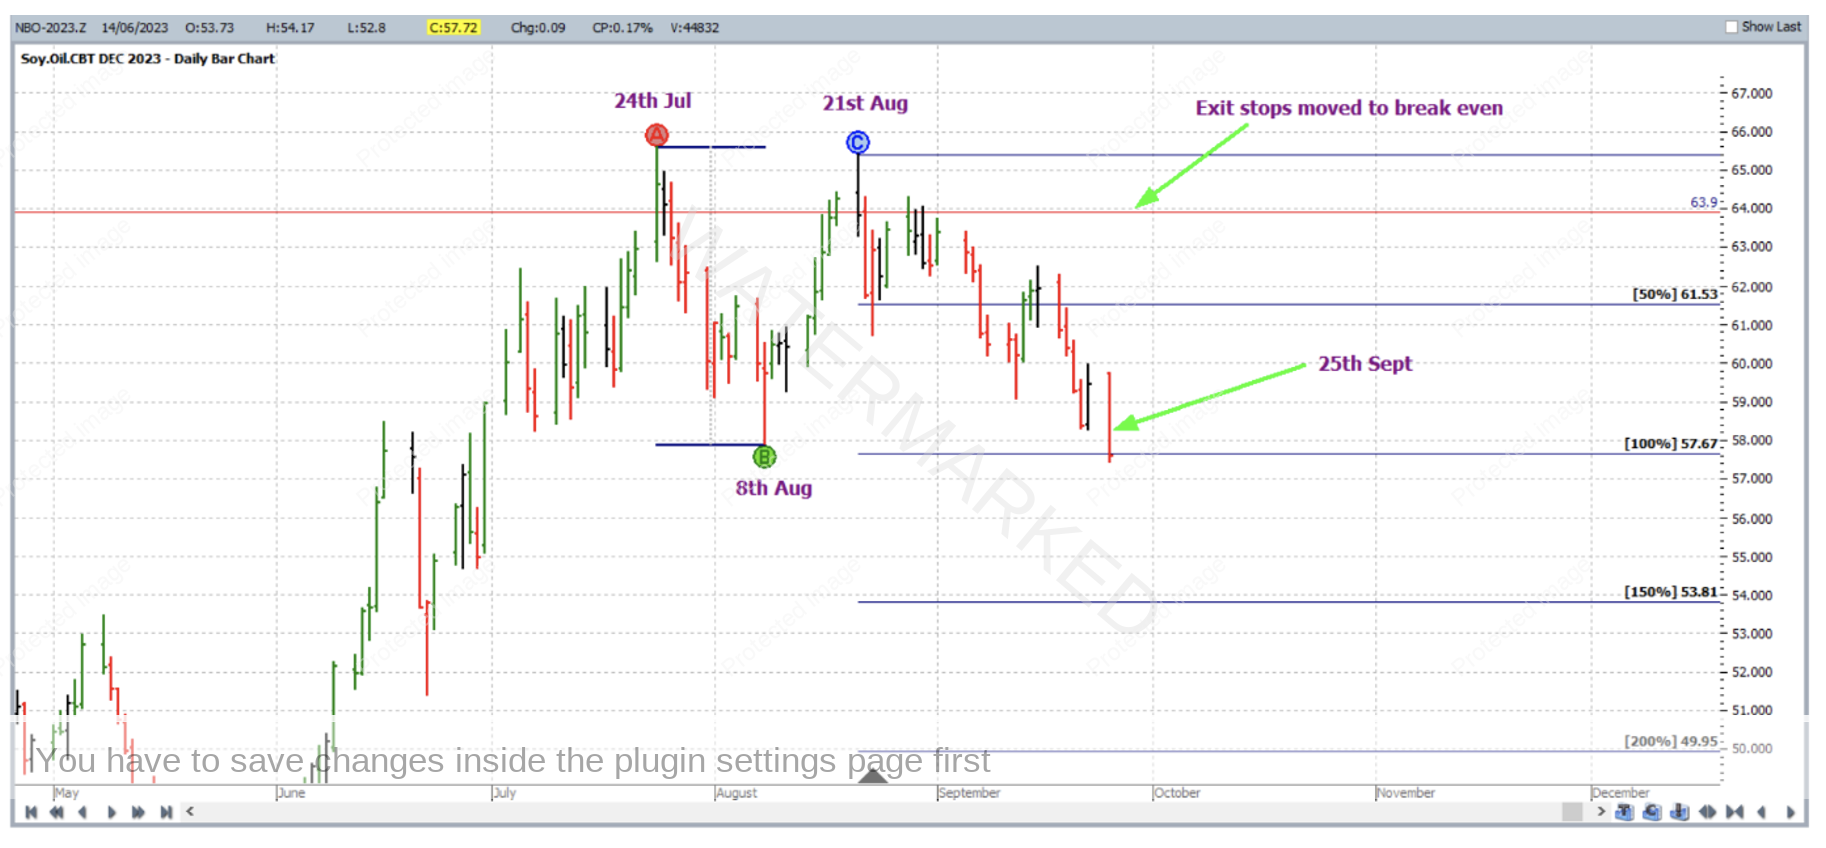
Now for the trading plan. Being a double top formation, the Number One Trading Plan manual says to aim for the 200% milestone as exit target. In this case the AB reference range went from the 24 July 2023 high, 65.58 to the 8 August 2023 low, 57.86; and Point C of course was the 21 August 2023 high.
As for managing stops between entry and exit, with this being a relatively small double top formation, an alternative to standard ABC trade management could be to act only when the market reaches the very major milestones. It’s important to give a market room to breathe on the way down, and the market does not have the same amount of room to do this in a smaller double top formation. So in this case stops were only moved to break even when the 100% milestone was reached. This was on 25 September 2023.
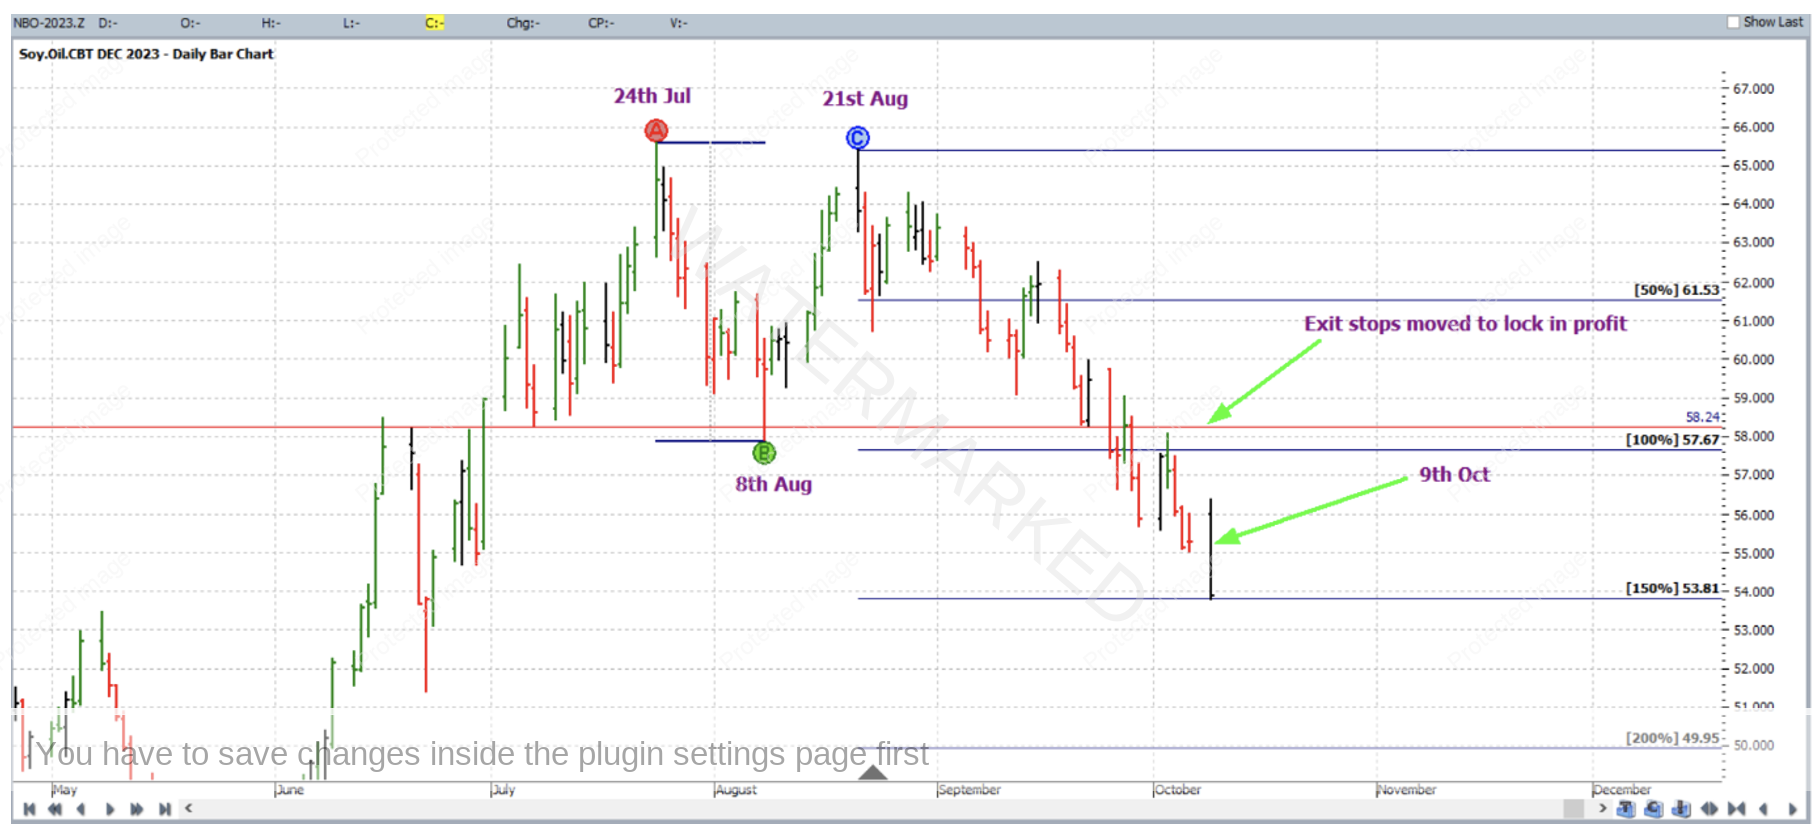
Then on 9 October 2023, the next action was taken when the market reached the 150% milestone and exit stops were moved to one third of the average daily range (57 points) above the 100% milestone, to 58.24 to lock in some profit.
And on 1 November 2023, the 200% milestone was reached, and profit was taken at 49.95.
Now for a breakdown of the rewards. In terms of the Reward to Risk Ratio:
Initial Risk: 64.30 – 63.90 = 0.40 = 40 points (point size is 0.01)
Reward: 63.90 – 49.95 = 13.95 = 1395 points
Reward to Risk Ratio = 1395/40 = approximately 35 to 1
Each point of price movement changes the value of one Soybean Oil futures contract by $6USD. Therefore in absolute USD terms the risk and reward for each trade of the contract is determined as:
Risk = $6 x 40 = $240
Reward = $6 x 1395 = $8,370
At the time of taking profit, in AUD terms this reward was approximately $13,160.
If 1% of the trading account was risked at entry the gain in account size would be as follows:
35 x 1% = 35%
Work Hard, work smart.
Andrew Baraniak


