Which Way to Trade in 2024?
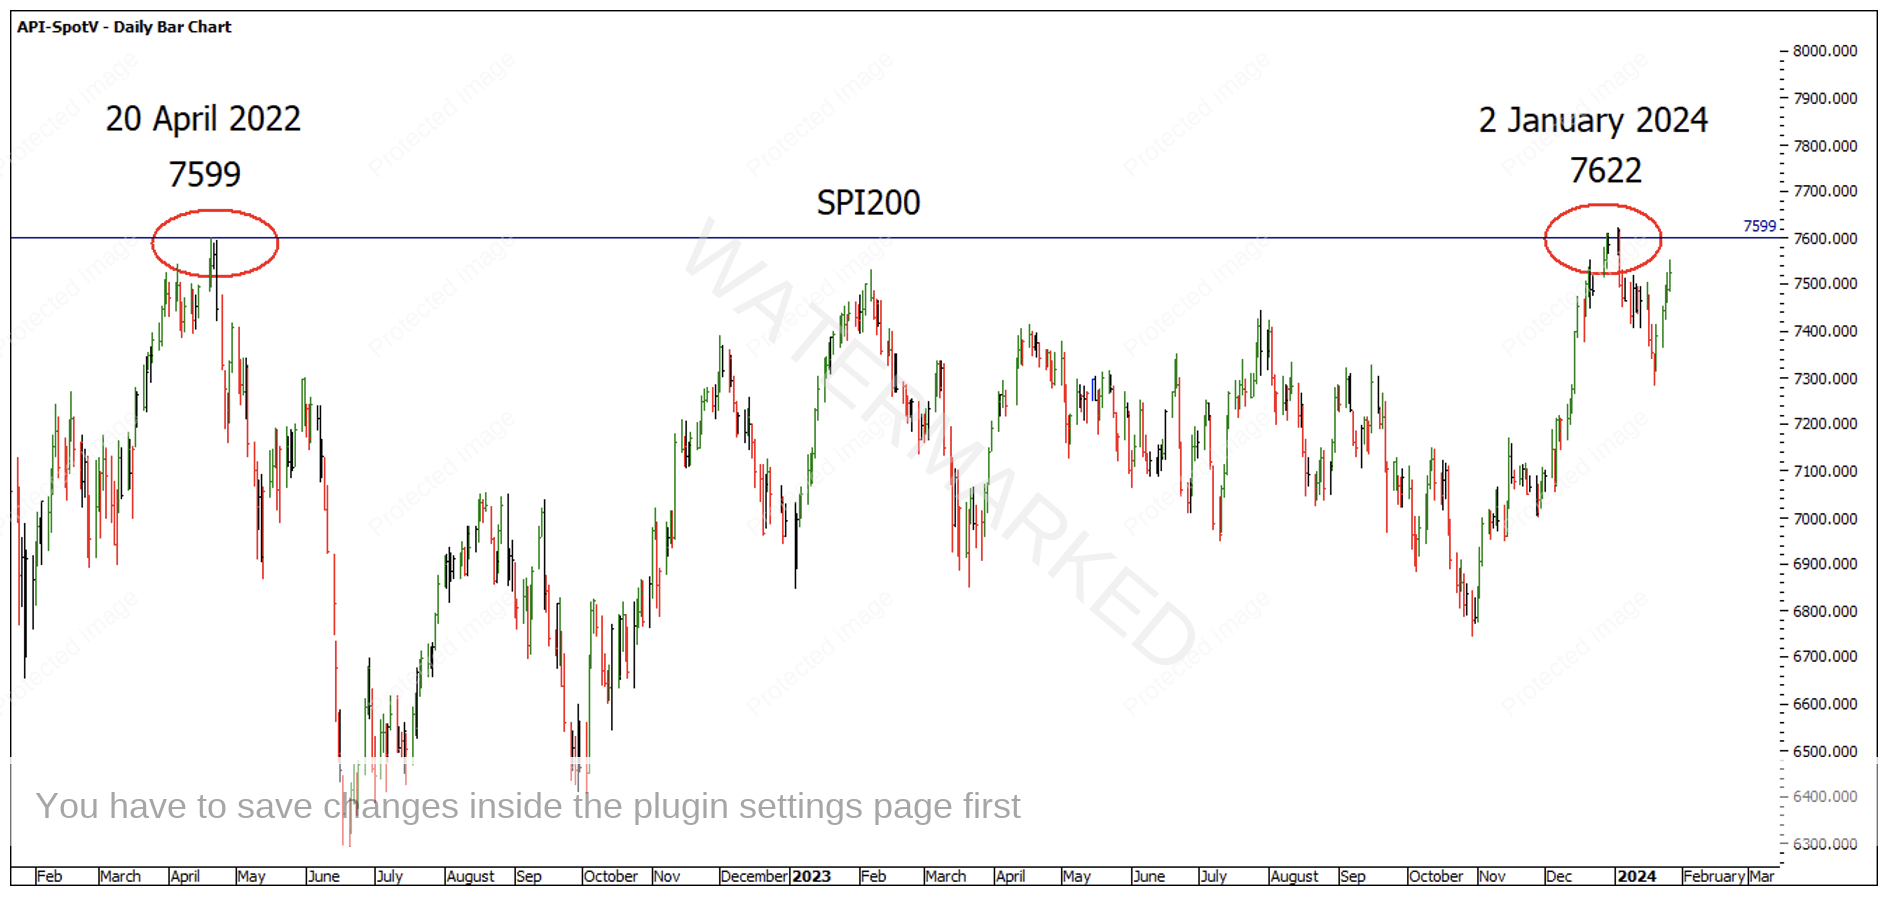
To start the new year the SPI200 made clean double tops with the previous All-Time High of 7599 on 2 January 2024 after a good run up of 876 points out of the 30 October 2023 low.
Chart 1 – SPI Double Tops
This kind of setup has been well written about over the years but is still a great one we can target for one of our potential setups, especially like the example above that has a slight false break.
For me a key to this type of setup is entering once the market breaks below the old tops after the false break, which shows that the sellers outweighed the buyers.
A false break can be one of the first indicators that the double top or double bottom will hold and gives you that extra bit of confidence that when the market breaks back through, you’re trading in the right direction.
However, just like this example, there can often be multiple potential entry signals before the market gets under way and this can very quickly eat up capital. Preserving your capital is one of the most important skills in trading which is done by having strong discipline and following your rules.
In trading, temptation is constantly at our fingertips with online trading platforms only a click away from entering or exiting a trade based on hope or fear. If you can bring no emotion to a trade and base it on weight of evidence and take sound entry signals, then you stand to make greater profits and less losses.
So, is this double top on the SPI200 a great trading opportunity? Will it provide a 10 to 1 Reward to Risk Ratio or higher trade? Would you be trading an A-B move or a B-C move?
I see price resistance at the current tops although I don’t see overwhelming evidence for a strong cluster, therefore until I see a definite indication of a change of trend my thoughts are that trading out of these tops would potentially be a B-C move.
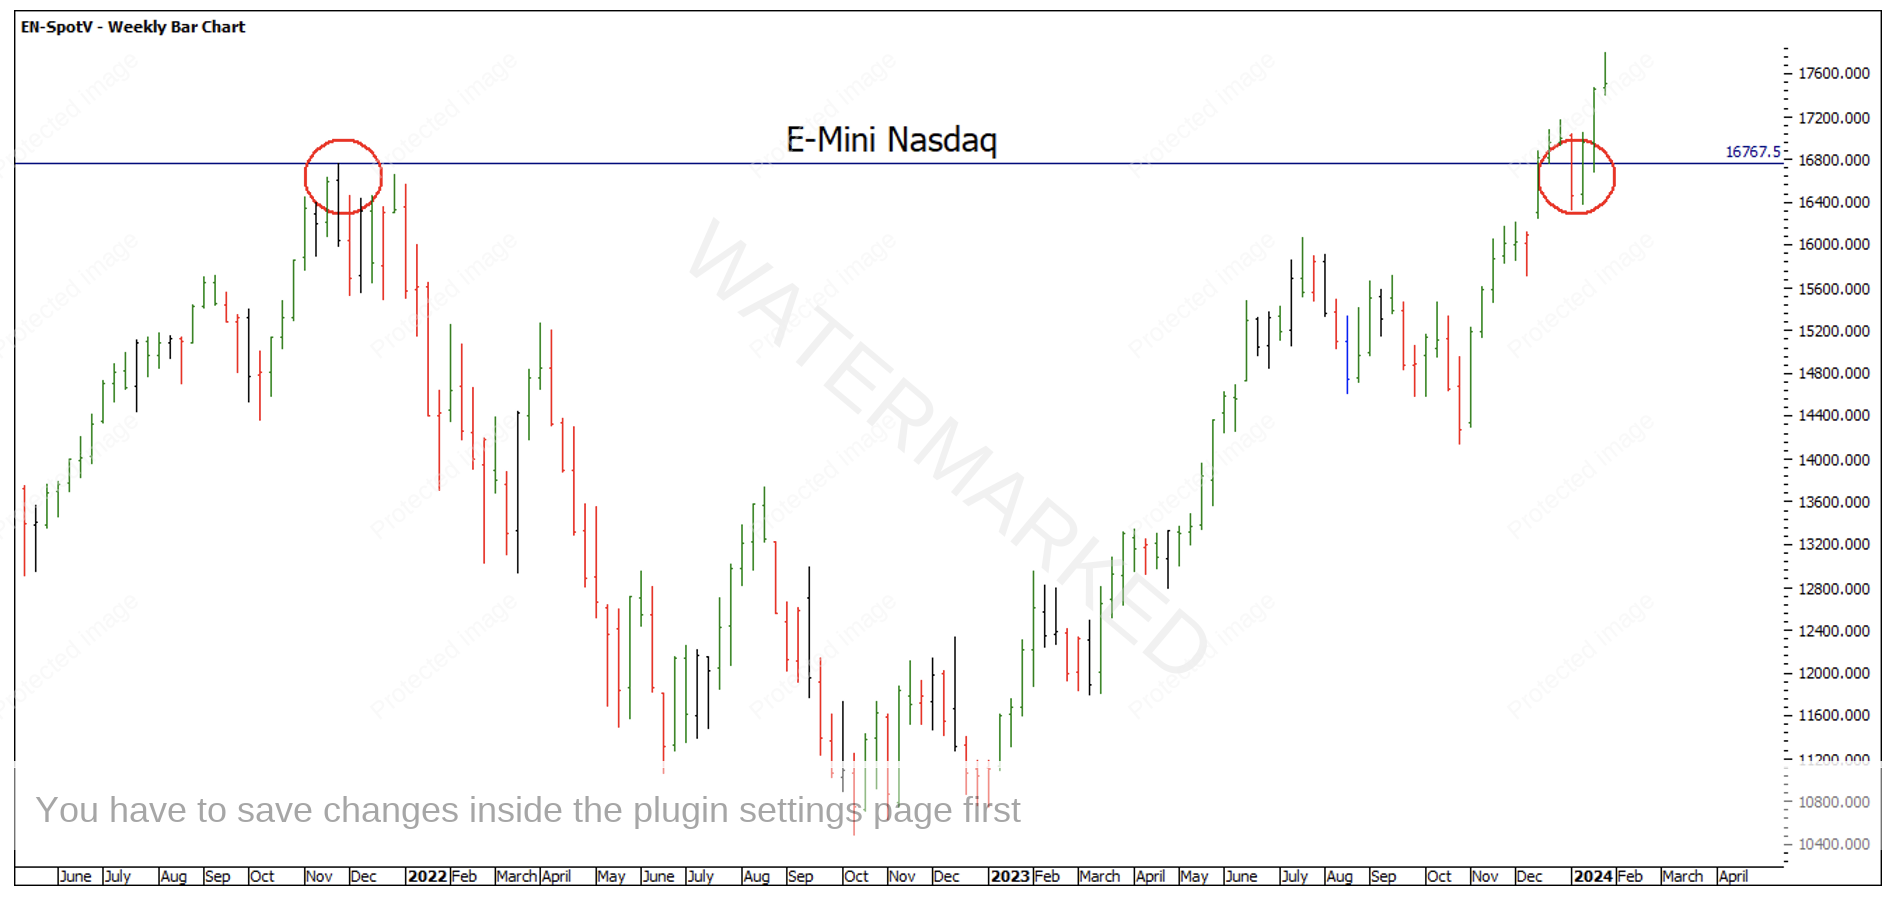
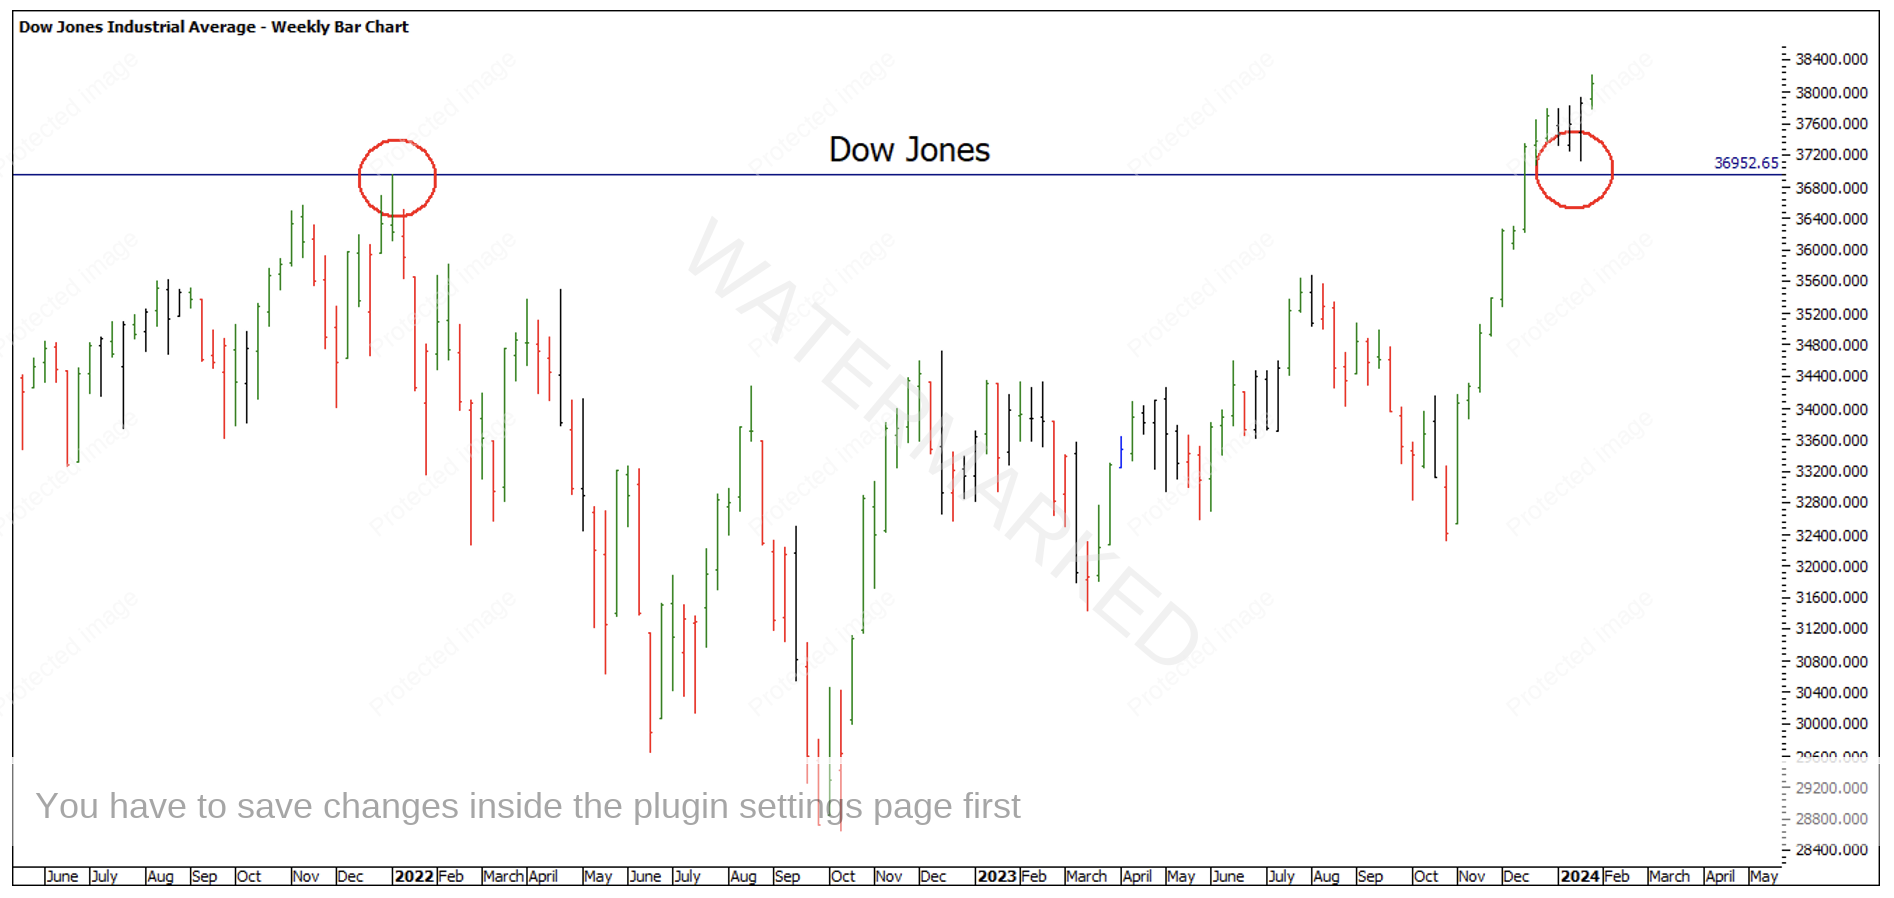
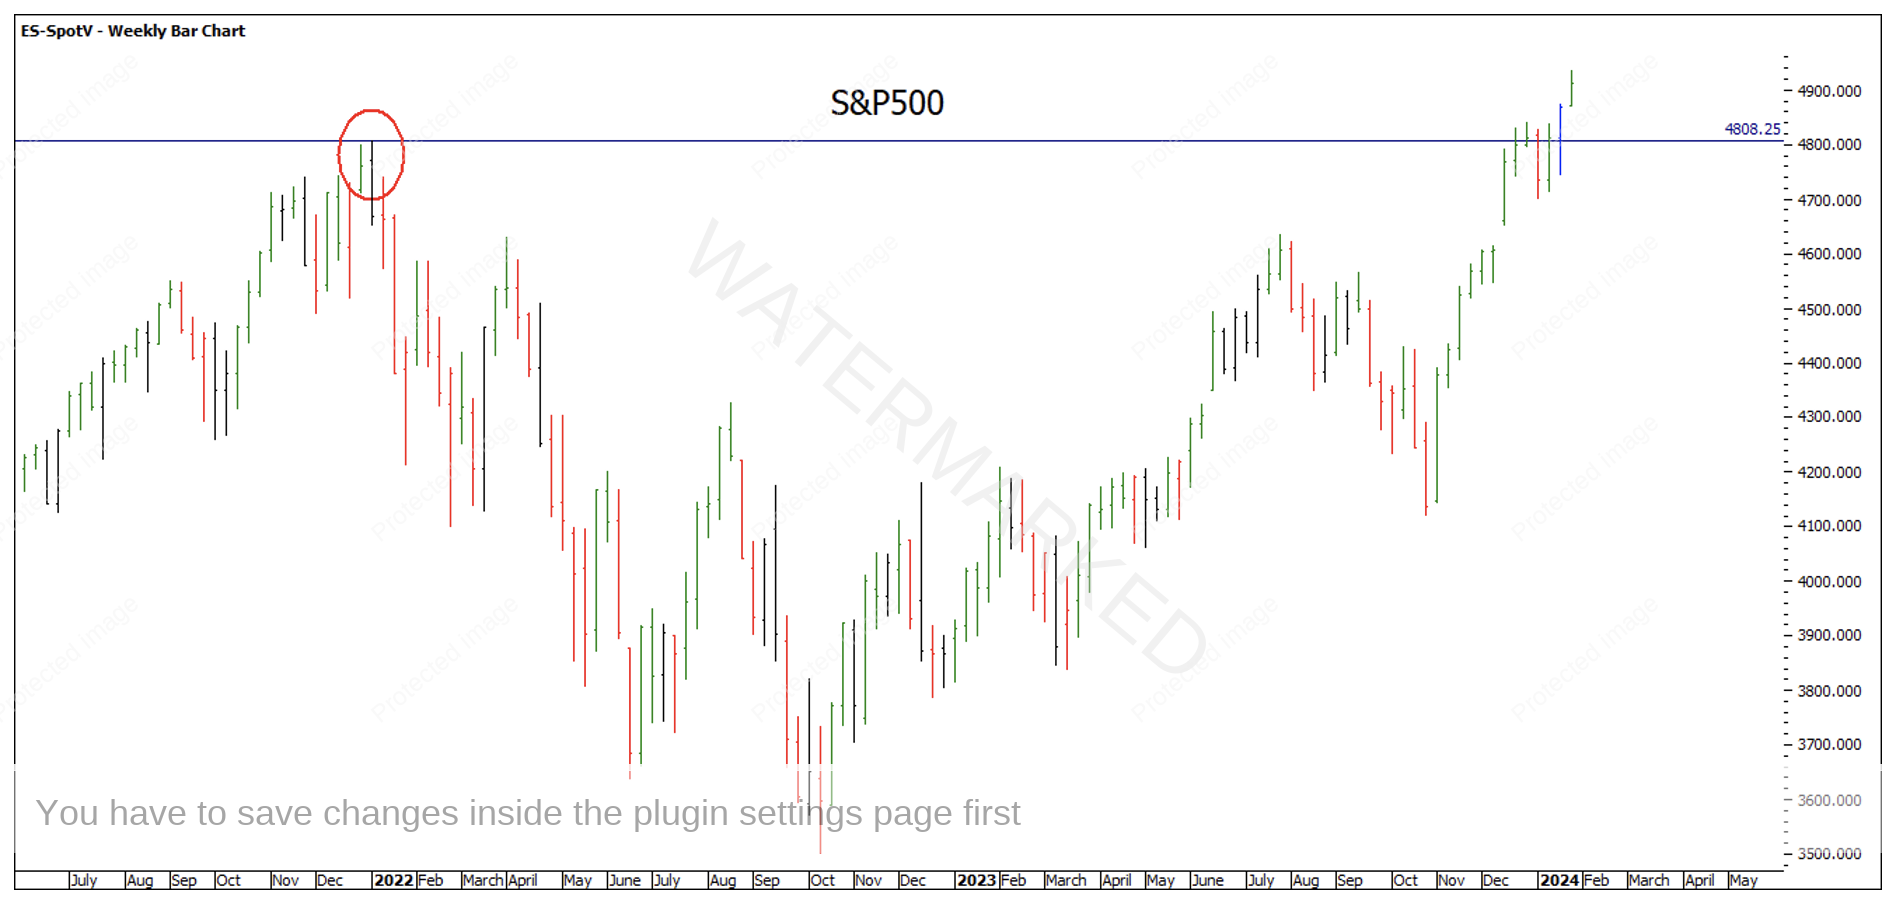
I’m not counting out the potential for a strong move out of these double tops as I think they need to be respected; however, I’m also keeping a close eye on the American Indices as a potential lead to where the SPI200 may be headed. The Dow, Nasdaq and S&P500 have broken into all-time highs and currently have made higher daily swing bottoms on old tops showing signs of strength.
Chart 2 – Nasdaq
Chart 3 – Dow Jones
Chart 4 – S&P500
Master Time Cycles is something that W.D Gann writes about in his books and the Commodities Course. Applying these cycles to today’s market also gives me a rough idea of where I believe the market is headed over the next few years which gives me the direction of the major trend. We’ll be discussing these in more detail in next month’s Gann In Action program during our 3 Day Webinar.
Looking for great setups in the direction of the major trend by looking for weekly, monthly or quarterly Point C’s with the potential for very high Reward to Risk Ratio trades may just make 2024 your best year for trading yet!
Stay focused, stay disciplined.
Happy Trading,
Gus Hingeley


