Getting into the Swing of Things
Swing Charts and the SPI200
Simplicity in trading is not a word that newer traders use when it comes to describing their process or trading plan. When we start any new endeavours, we are faced with a steep learning curve and with the benefit of hindsight trading certainly has been one of the harder skill sets I have developed.
David and Gann’s methodology are so “deep”, and many would say complex, which I’d agree is true whilst you’re going through it. When I write an article these days, I focus on the notion of what would I have liked to be told or shown when I was starting out on this process. To be clear though I still acknowledge that I can improve and develop, so there is no real finish line in this caper, it’s a process of continued refinement.
The field of technical analysis is broad, and there are hundreds of ways to trade. Potentially all can work but they must also work for the individual’s mindset as well. I have found that understanding a technical idea is more than the calculations, knowing when to use and when not to is equally important. Nothing works all the time so when we discuss the use of swing charts in this article it’s done through the filter of knowing the how, when and most importantly the why. That will not guarantee perfect results, but it will allow for greater certainty than guessing.
If I asked you to explain to someone who has never heard of swing charts what they are and why do we use them at Safety, that may produce a wide range of responses and again outside of the most textbook answer, there is, likely no 100% correct answer. The answer you give will explain a lot about how you see and understand swing charts. As an exercise explain swing charts to an outsider, if they can understand what you are saying then you’re off to a good start. If you can’t explain it well, then it’s probably time to do some more work.
I would explain (briefly) that swing charts are a charting method that helps us as traders determine trends, allows for entry triggers that mean we are entering in a confirmed trend, allows us to understand risk more clearly (placement of stops) , helps us understand how long we should hold positions, helps us trade both long and short and finally provides a mechanical trading style that once we confirm an area of support or resistance, allows us to trade the change of trend opportunities.
There are so many subtleties that go into each of these statements, so let’s review major building blocks. I am going to use the SPI 200 and look at 2019 so far, there are many time and price reasons that the 24 December low at 5330 was an area of support and hence we could use charts to participate in a bullish move.
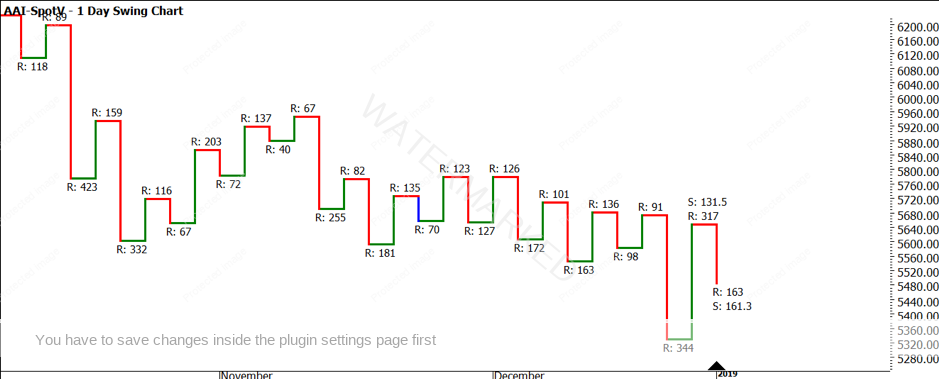
Chart 1 – Daily Swing Chart SPI200
Options for trading out of that low include:
- Buying on that day using openers or closes rule from the NOTP and whilst a great risk to reward has been delivered, it’s also trading against the downtrend and comes with a high risk of being wrong if the low does not come in. We will keep to swing trades for now.
- Let’s focus on the first higher swing bottom, the challenge here as we can see is that the swing with the range up of 317 points is not above the previous top (91 points) therefore the only way this can be a valid ABC trade is an overbalance in price trade (which it is)
- The average upswing at this point is 131.5 points with the current upside reaction 317, potentially a good sign, also the 344-point swing down may have exhausted the bears as its well over the 161.3 average point downside range.
- Keep in mind the only reason we would be looking at this as a potential long trade is that we have price (and time) reasons to think this is a low.
- The current pullback is 46% and if we can see a swing bottom form here, the downside ranges are contracting. This is still regarded as a more aggressive swing trade.
- The bar chart below shows the perspective of the setup.
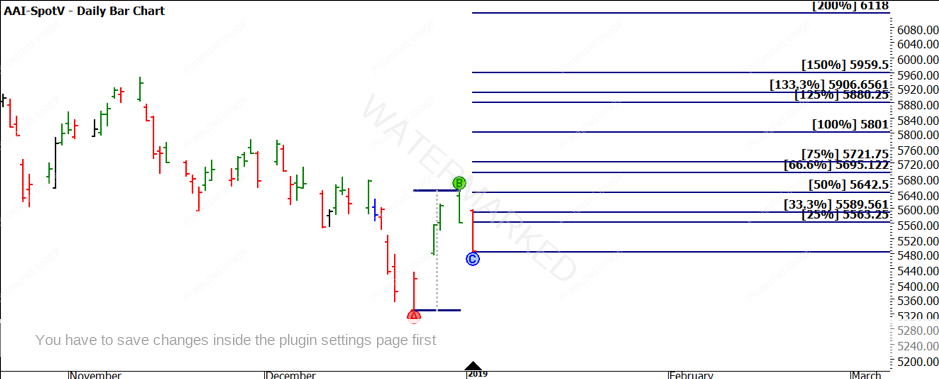
Chart 2 – Daily Bar Chart SPI200
The next thing you should notice is that we are outside the 33% limit, limits are there to keep you safe, but as you advance, can be managed. Limits allow us to ensure we have a worthwhile risk and reward. As long as we can maintain an acceptable return to risk, we can adjust the limits.
One way to do so, if limits are exceeded to enter like in this case, a position can still be taken with a reduced position size.
As we see in Chart 3, day 1 and day 2 were inside and down days and therefore the entry limits were lowered slightly. If you traded the 24-hour session of the SPI, you could assume that you would have been filled through the evening of 7 January but we will focus on the daily chart only.
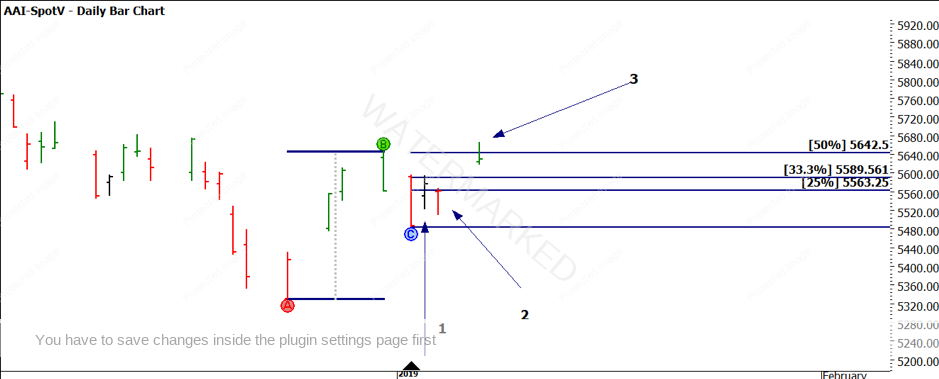
Chart 3 – Daily Bar Chart SPI200
The next focus is based on where the initial stop is placed, it guides the risk that is taken.
Chart 4 shows the entry on the open at 5602 as the trend is confirmed as up on the daily chart. If stops are placed behind the gap just created, we are risking 36 points compared to 119 points when placed behind the new swing low.
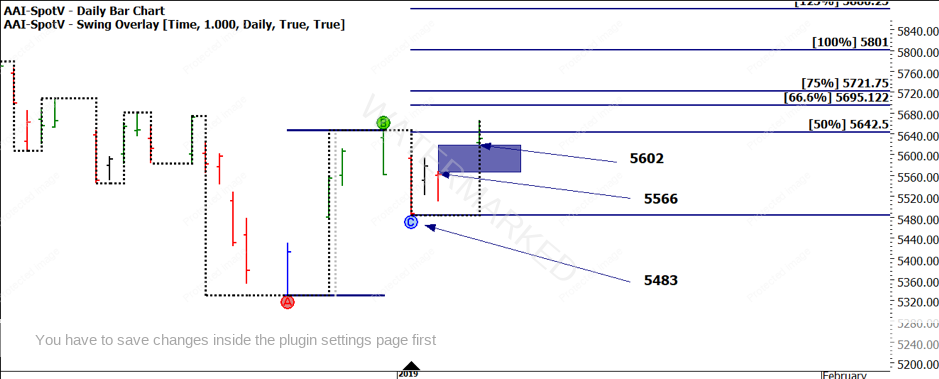
Chart 4 – Daily Bar Chart SPI200
So now you are set in a position, it all becomes about trade management and managing risk.
As the expectation is that this move could be larger than a simple daily swing due to the merits of being a strong turning point, we may look to manage this setup with a broader view than just a 100% milestone. As we have entered outside limits, it would make sense to be aiming for at least 125% if stops are below the swing bottom.
To manage this as a campaign (a term Gann used to describe larger moves) trailing stops behind swing bottoms may be more appropriate. How far behind the swings should be the next question you are asking; 1 point will lock in profits but also see us knocked out on false breaks.
The best strategy is always known for sure through hindsight, but a 1/3 of the average daily range is a starting point. Of course, there is no substitute for testing a market.
Chart 5 shows how this strategy has performed, I calculate the average range as 67 so 1/3 is 22 points. This means every time a new swing low is formed you place stops 22 behind that point (as noted by the orange circles)
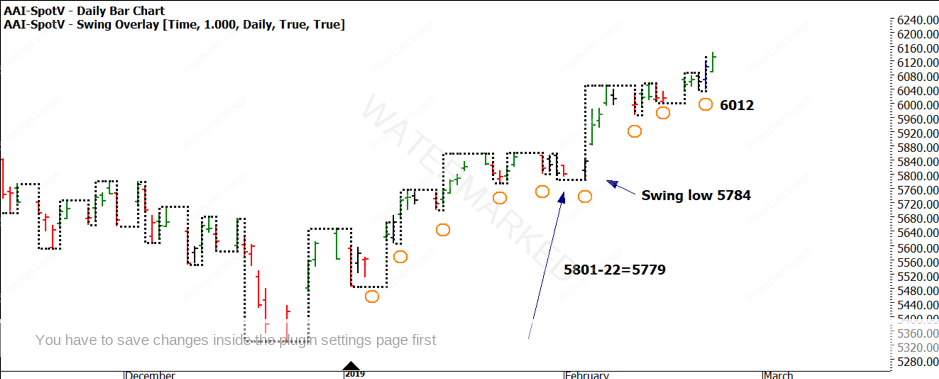
Chart 5 – Daily Bar Chart SPI200
The current setup shows the stop would be at 6012 currently, there was a period in early February where the swing bottom was broken (false break) before the market continued climbing. That swing low was 5784 and stops where at 5779 so we could have held, albeit nervously.
A quick calculation shows an entry at 5602 and current stops at 6012 a profit of 410 points and an exceptional risk to reward.
This case study shows how the use of swing charts has allowed us to enter on trend confirmation, set risk parameters and trade management strategies. The humble swing chart is easy to construct but offers so much assistance to the “trade” they are worth mastering.
Good trading,
Aaron Lynch