Cocoa Boom
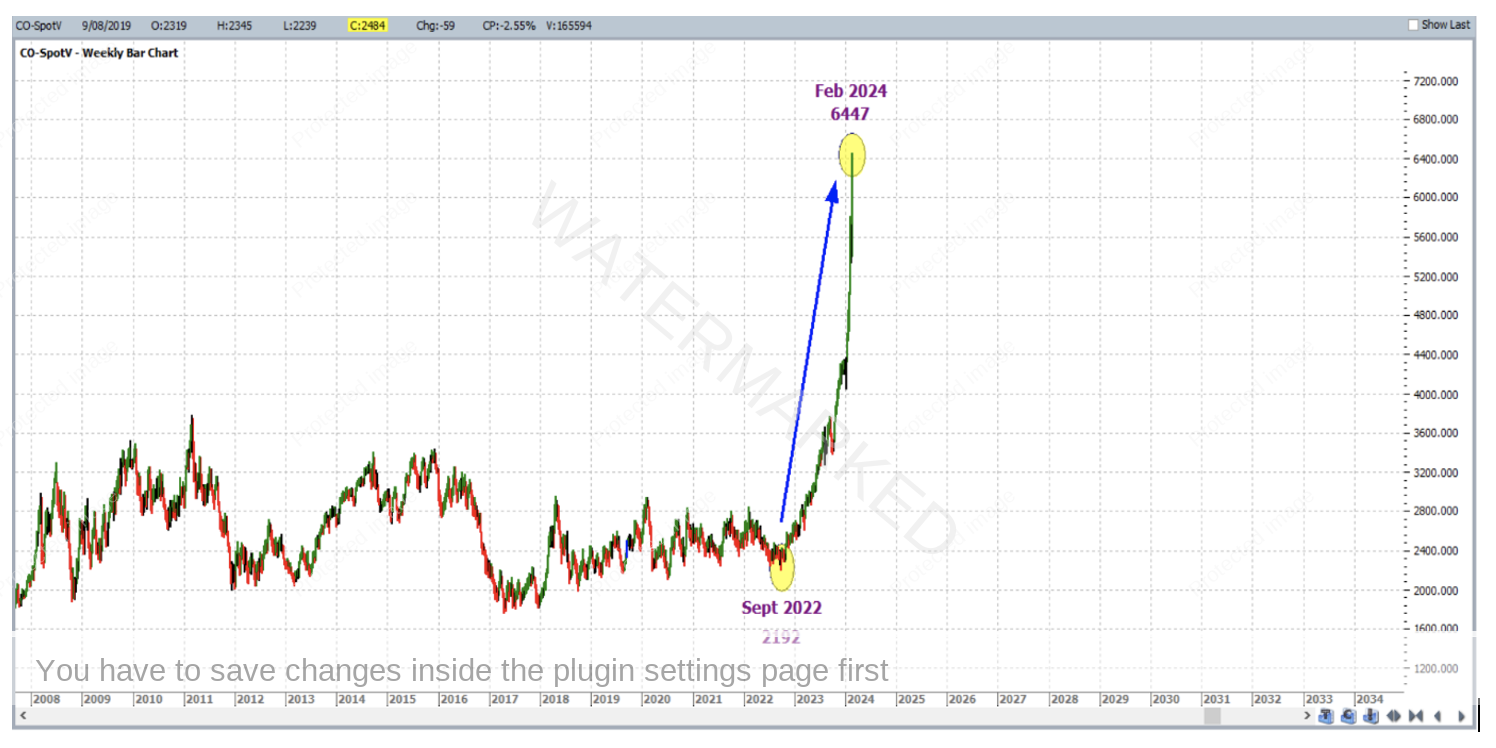
If you’re interested in trading the soft commodities sector there’s a good chance you will have noticed a big move in the Cocoa futures market of late. And to say big is almost an understatement – the move has been huge, and has continued upwards in an almost parabolic fashion. This is shown below in the ProfitSource weekly bar chart (symbol CO-SpotV), and since the September 2022 low of 2192 USD per metric tonne, things have been very profitable for the bulls. At the time of writing this article, the current high sits at 6447, almost triple the last major low. Interesting to note is that most of this gain has happened in a very short time – the last few months in fact.
So what makes this such a good case study? What is the driving force behind a move like this? Upon closer inspection of the chart, very apparent is the large accumulation pattern prior to the September 2022 low.
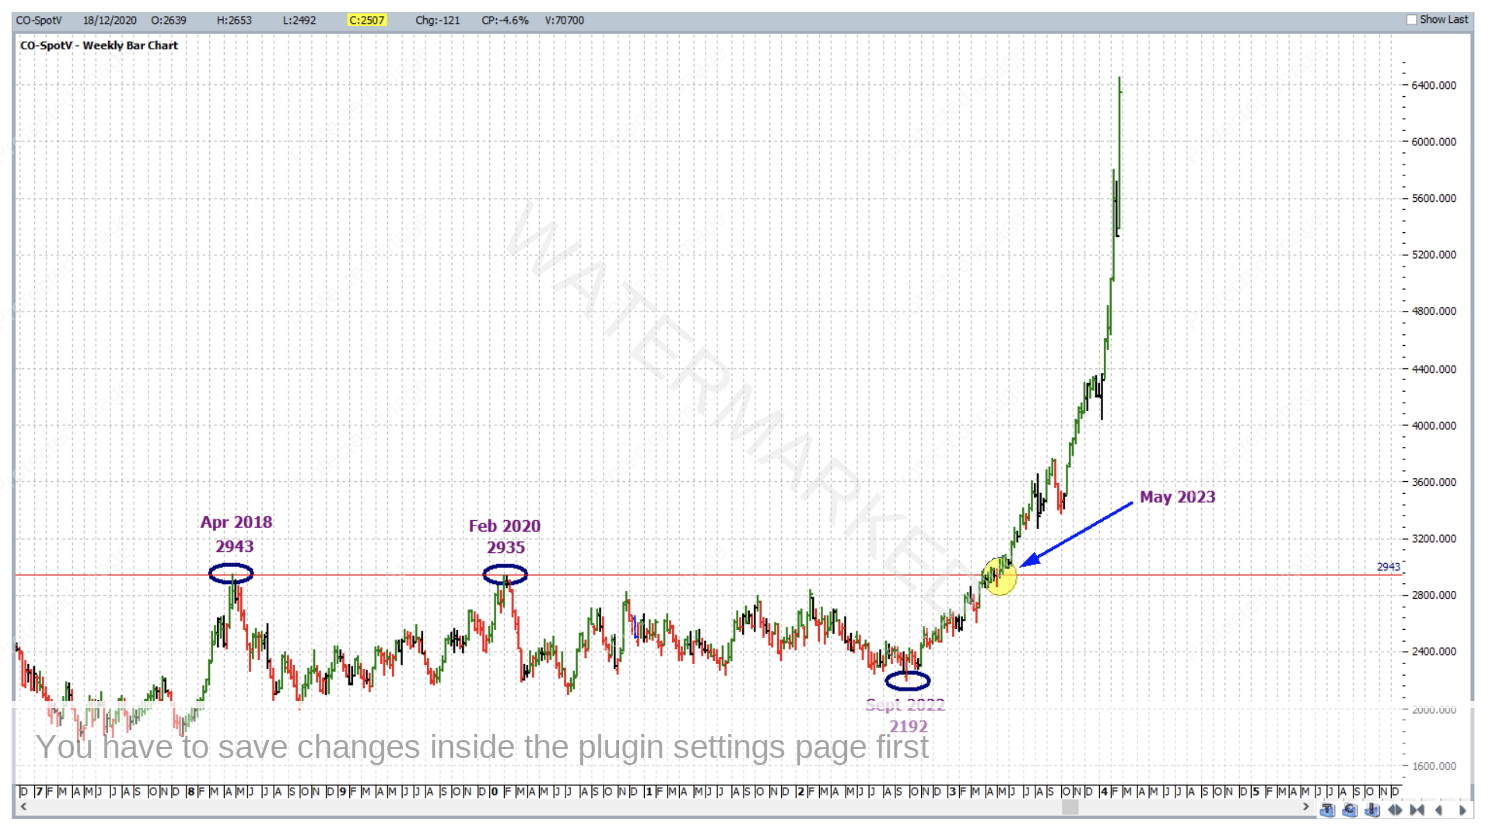
This sideways period lasted for the better part of the 5 years, so by the time the market broke out to the upside, it’s pent up energy was almost unstoppable. By May of 2023 Cocoa had broken the two most significant tops of the accumulation period – those of April 2018 and February 2020. Also by that point the weekly swing chart trend was well and truly confirmed up. These two factors helped to signal the end of the accumulation period, with high probability trading abound for the bulls.
When the price of a commodity runs away to the upside, especially as steeply and sharply as Cocoa in the last few months, the retracements are often few and small.
As a result of this, the structure of this month’s article is different because Point C of the trade about to be discussed was only a relatively minor daily swing low, sitting in the middle of the steep run. That Point C was not a significant low, nor did it have any strong or worthy price cluster behind it. Just about all of the Trading Tutors articles of late have stuck to the theme of there being a strong 3 way price cluster at or just behind the entry point of the trade where there is either an intermediate or major market reversal. This month’s article is an exception to that, but as you will see, the humble ABC trade at least made up for it with a very high Reward to Risk Ratio! (Many times more than the typical Reward to Risk Ratio for an ABC trade in the middle of a run).
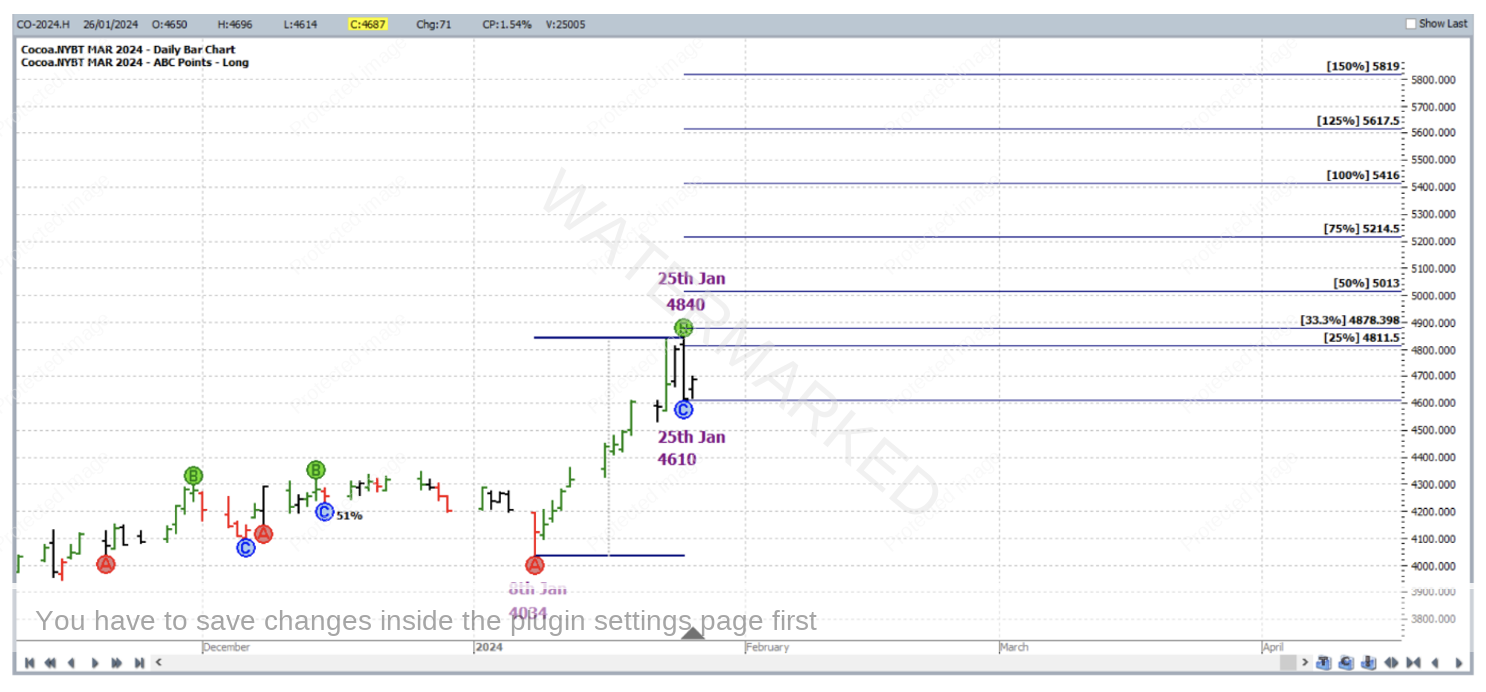
Zooming into the market, but this time on the individual contract chart for March 2023 Cocoa (CO-2024.H) to fine tune entry parameters and a reference range, we identify the trade:
Point A: 8 January 2024 4034
Point B: 25 January 2024 (high) 4840
Point C: 25 January 2024 (low) 4610
(Ordinary swing chart rules had Point B at the 23 January 2024 high, but the high open, low, close of 25 January 2024 gave a better indication of what the market actually did prior to trade entry, hence there was but a slight interpretation as to how the daily swing chart was constructed here).
Given the enormity of the preceding accumulation period, and the fact that both monthly and weekly swing chart trends were up, the stock index style of ABC trade management was engaged to take advantage of a potentially run away move.
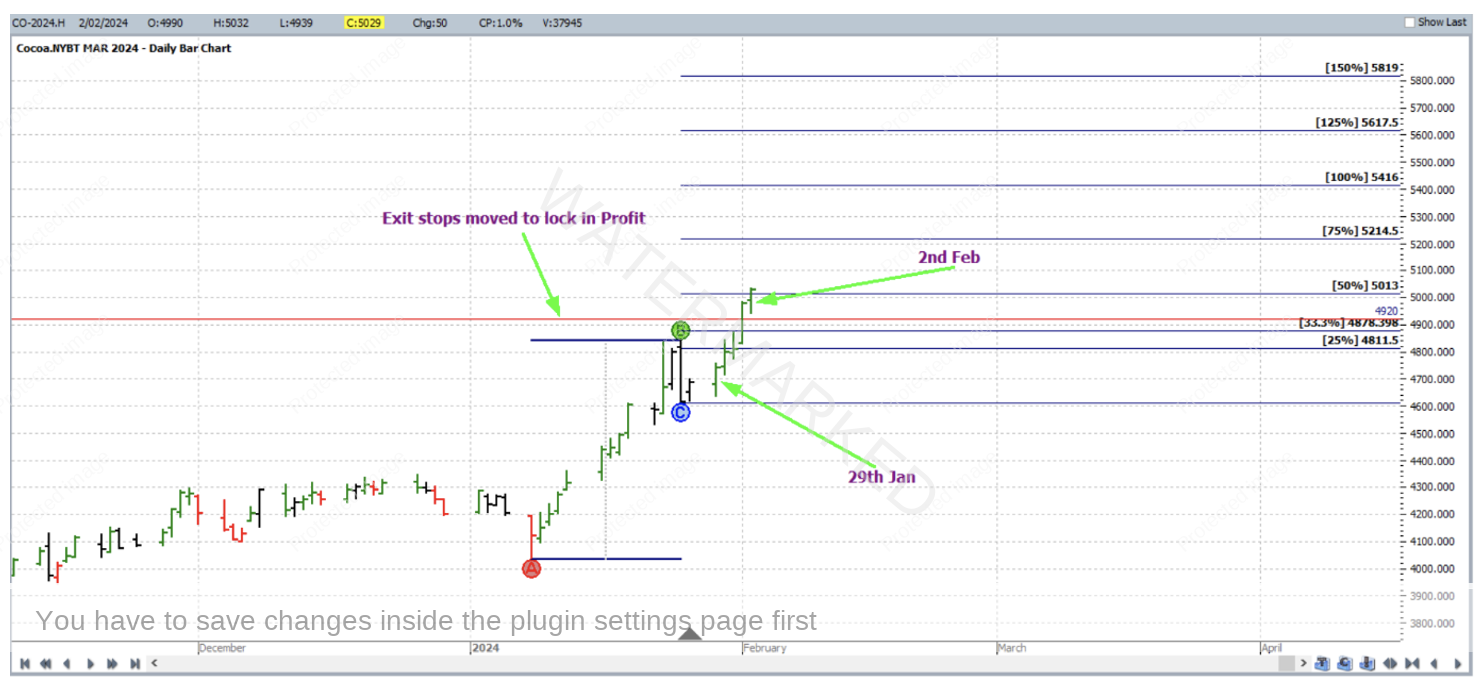
The up day of 29 January 2024 signalled trade entry, getting you long Cocoa at 4697 as the high of the small inside day of 26 January 2024 was broken, with initial exit stop loss below the low of the preceding outside day at 4609 . Noting the abnormally large AB range, instead of trailing stops by 1/3 Average Daily Range, 1/3 Average Monthly Range was used – this was approximately 93 points. The idea of this was to give the market more room to breathe on the way up – while retracements are relatively small in a market moving up like this, in absolute terms they are still fairly significant. On 2 February 2024, the market reached the 50% milestone and exit stops were moved to 4920 (93 points behind the 50% milestone) to quickly lock in some profit.
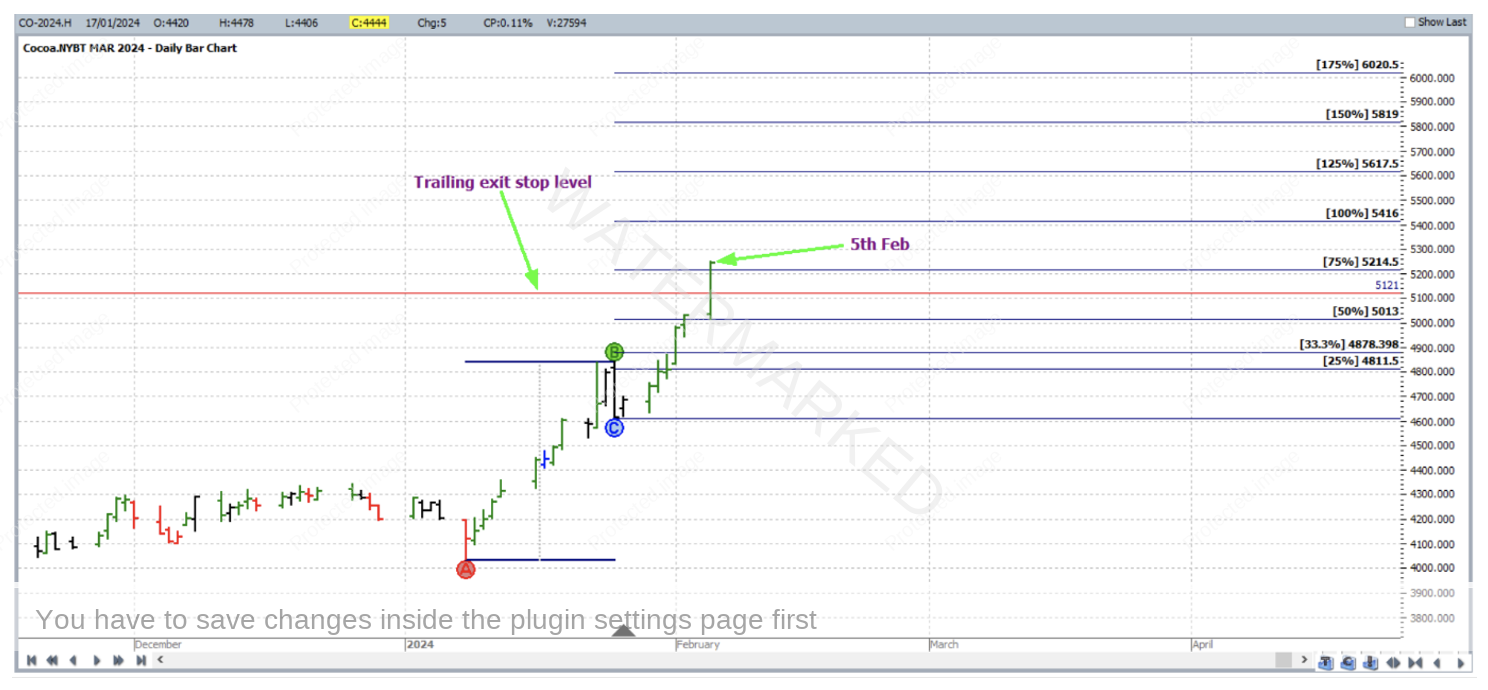
Then on 5 February 2024 the market reached the 75% milestone and stops were moved to 93 points below this level at 5121.
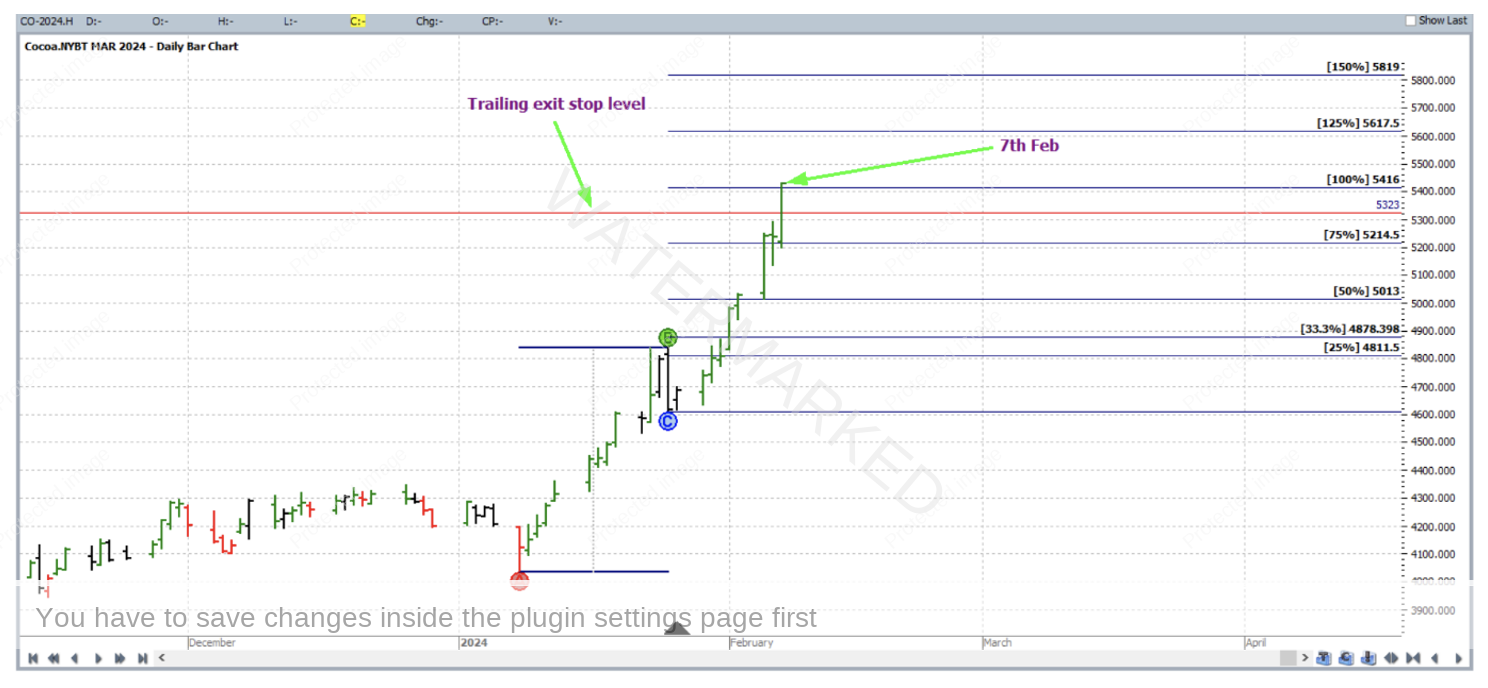
Then on 7 February 2024 the market reached the 100% milestones and trailing exit stops were moved to 93 points below that level.
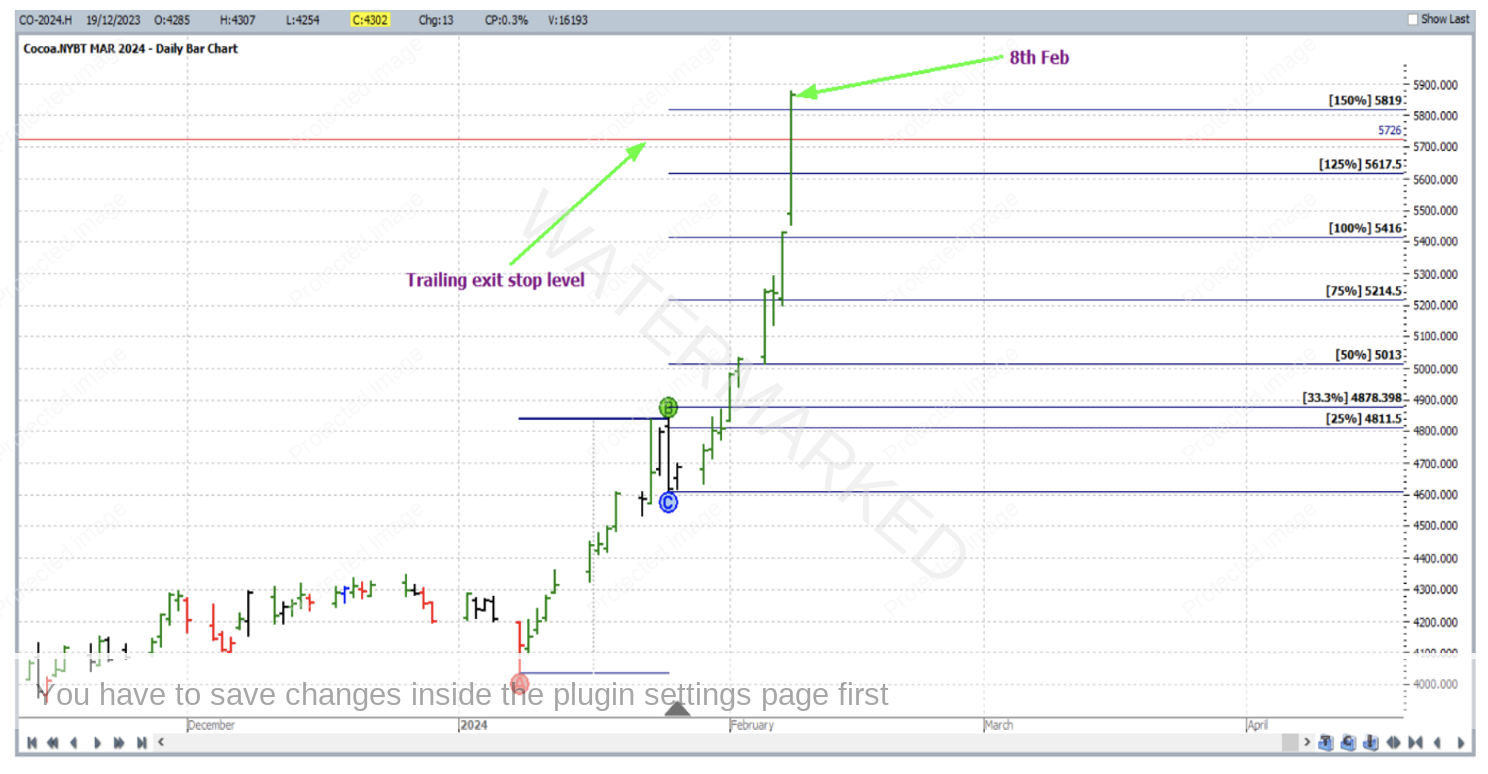
Then during the massive up day which was 8 February 2024, exit stops were moved twice! Once when the 125% milestones was broken, and then again to 93 points below the 150% milestone when it was reached.
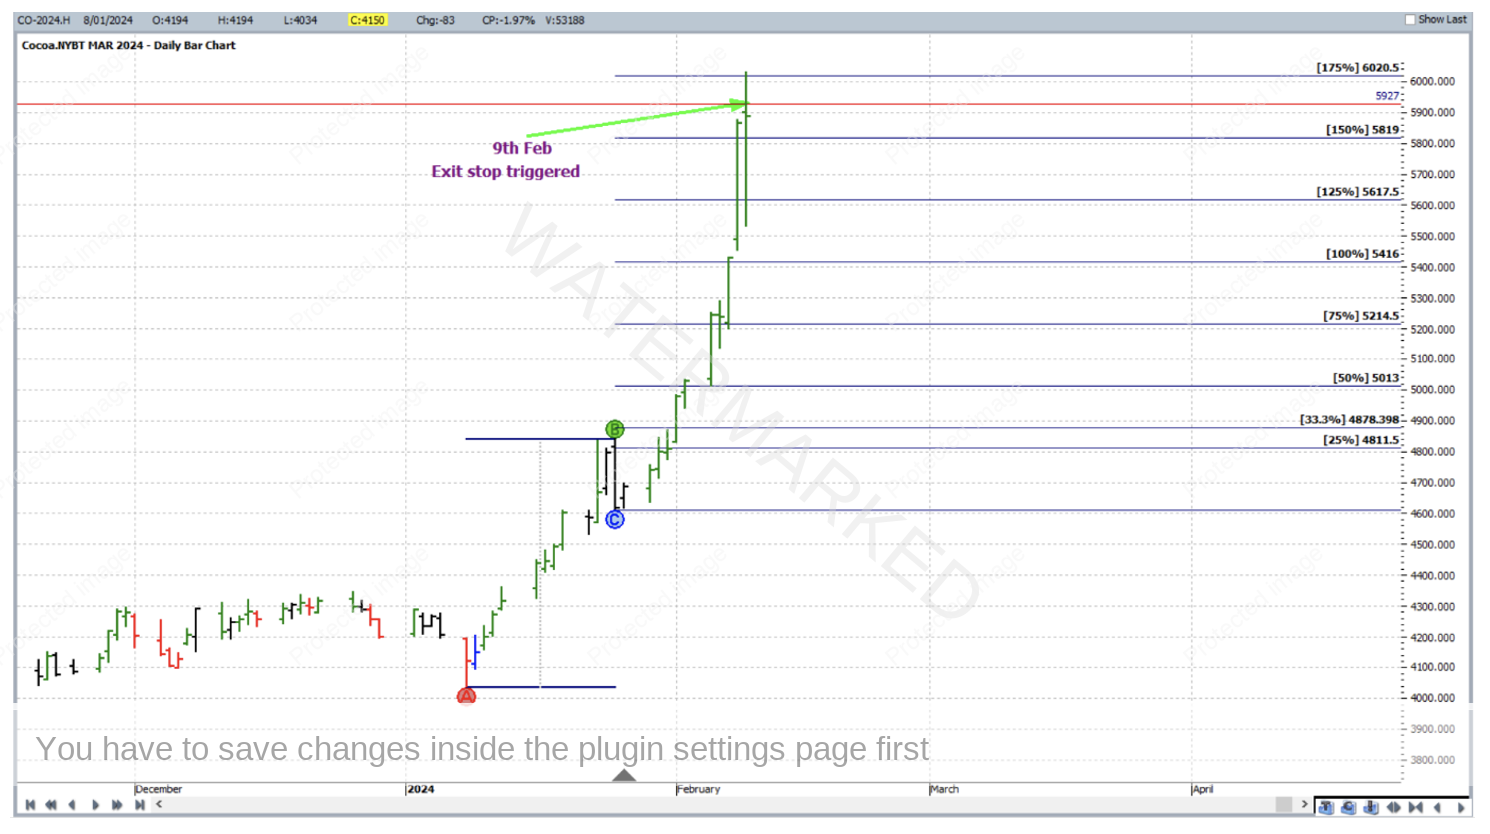
Then it was all over within the next trading day, 9 February 2024 when trailing exit stops were moved up to below the 175% milestone and subsequently triggered, for an exit at 5927.
Now to break down the rewards. In terms of the Reward to Risk Ratio:
Initial Risk: 4697 – 4609 = 88 = 88 points (point size is 1)
Reward: 5927 – 4697 = 1230 points
Reward to Risk Ratio = 1230/88 = approximately 14 to 1
Assuming that 5% of the account size was risked at trade entry the gain in account size would be as follows:
14 x 5% = 70%
Each point of price movement changes the value of one Cocoa futures contract by $10USD. Therefore in absolute USD terms the Risk and Reward for each trade of the contract is determined as:
Risk = $10 x 88 = $880
Reward = $10 x 1230 = $12 300
In AUD terms this reward was approximately $19 000 for trading each contract. One can also access this strongly trending market via CFDs where much smaller minimum positions sizes are available.
Obviously a commodity like this can have its sideways periods, but when it really gets going, rewards are there for the patient as they experience a great example of a term we often use at Safety in the Market: strongly trending.
Work hard, work smart.
Andrew Baraniak
