So Much Choice!
This month I am fortunate to have too many things to write about regarding recent trades, signals and overall analysis. The process of writing about markets has been a haphazard process that has evolved over 25 years now. There are times due to a recent experience or a complete lack of trend or signals that the words do not flow. This is not one of those times, as across the markets I specialise in as well as the those that ebb and flow for trading ideas there is so much happening.
The main aspect I am enjoying is that markets are moving (trending) and there is lots of Price Forecasting and basic pattern work that is delivering results. Examples of this include double tops and bottoms and 50% (plus other retracements), and it seems most analysis is bearing fruit. This could also be locked into a personal cycle as May has consistently been a month that has been a positive one and this may go back to May 2005 on Crude Oil where I nominated a date in advance in the Safety in the Market community that hit on the day. I still remember the boost it gave to my trading.
To the current markets, we are again seeing many indexes after recent slides moving back to attempt records again, I am still focused on how banking stocks are performing locally and abroad as we continue to see inflation, interest rates and geopolitical concerns run rampant.
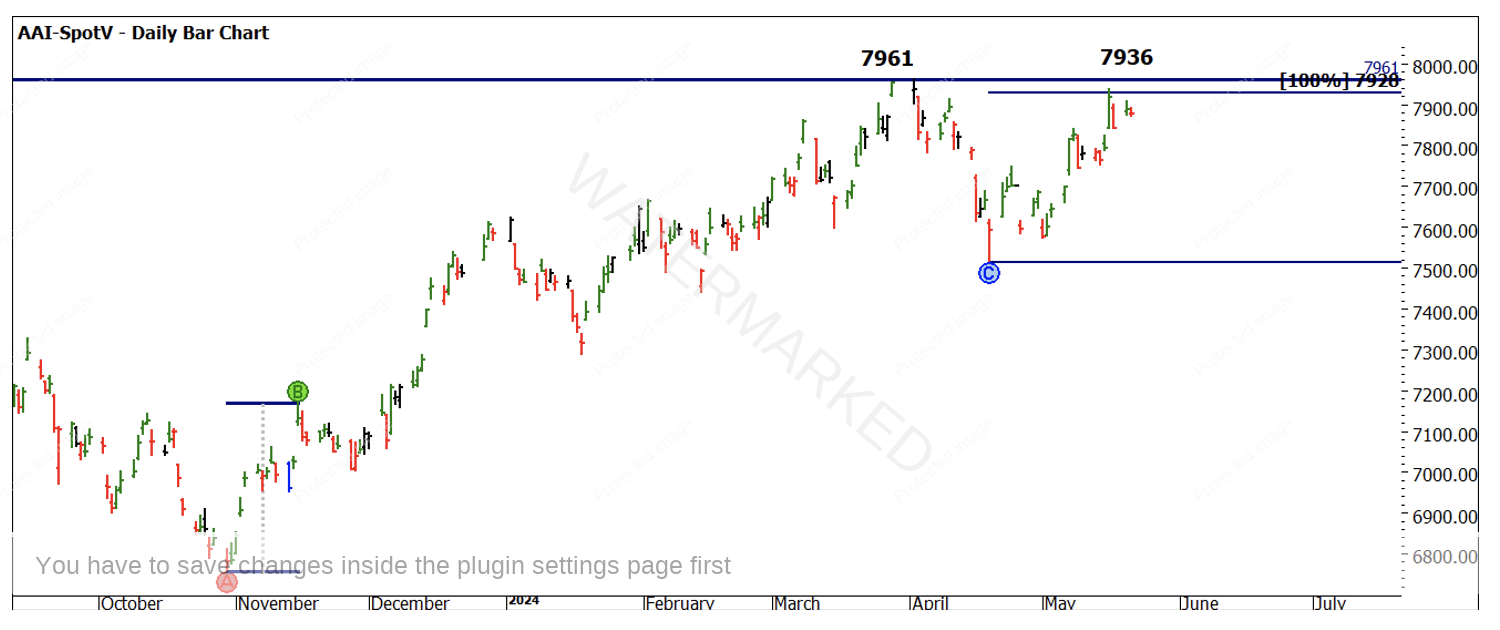
A quick look at the SPI200 and in Chart 1 we can see the 8000 point remains safe with a current challenge of the March top likely. I have noted that the current range from April looks very similar to the current move so food for thought there.
Chart 1- AAI-Spotv Daily Bar Chart
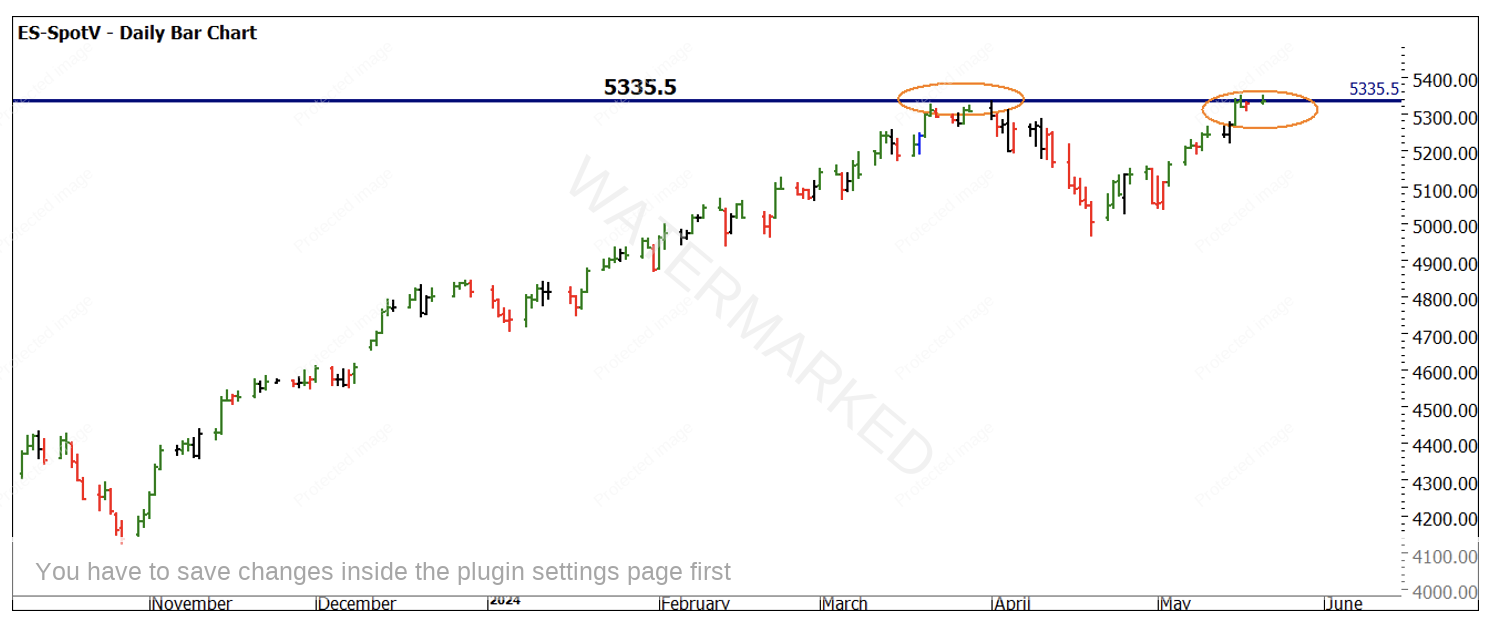
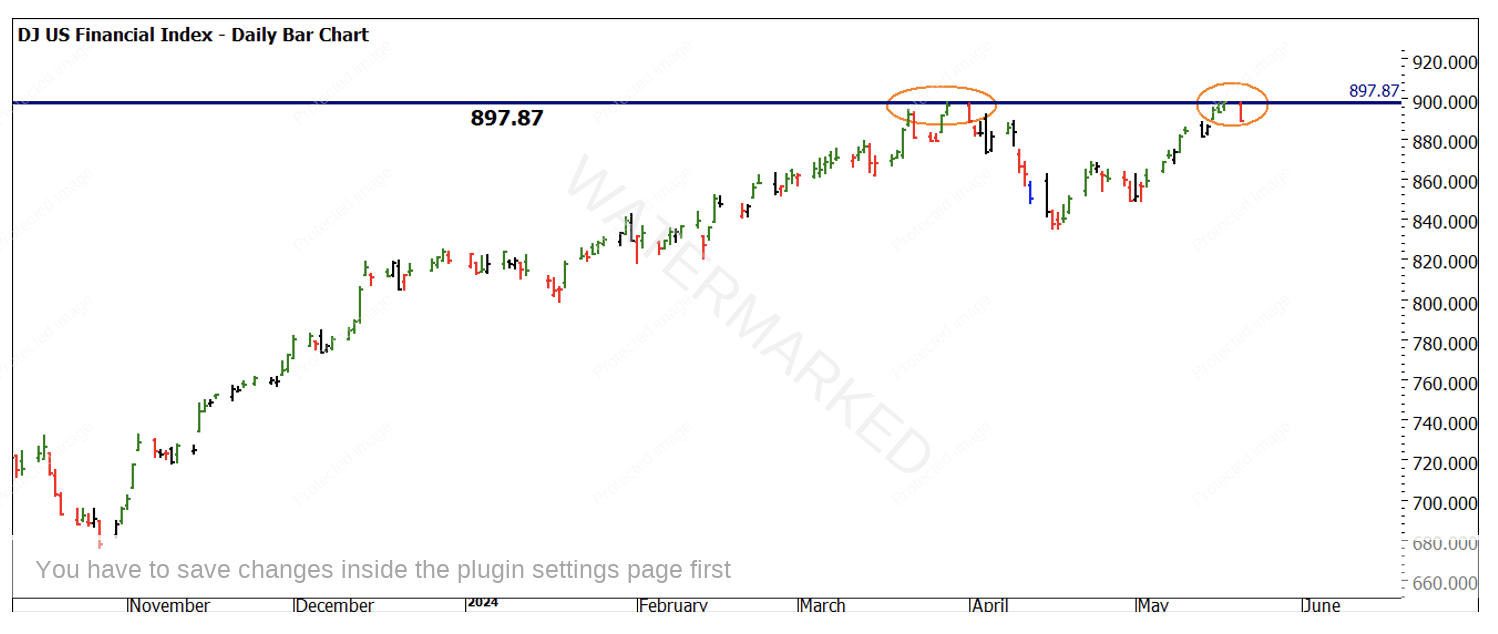
The US market also shows similar patterns with Charts 2 and 3, the SP500 and my old favourite the DJUSFN, both meeting resistance and having the potential to break out or fail at current levels.
Chart 2- ES-SPOTV Daily Bar Chart
Chart 3- DJUSFN Daily Bar Chart
The appropriate analysis with resistance cards especially Lows Resistance Cards could allow for some additional insights as to any clusters at these levels to consider. If you’re following the local financials market, you may wish to look at the XFJ chart and consider if their patterns mentioned above are the same or have some slight differences.
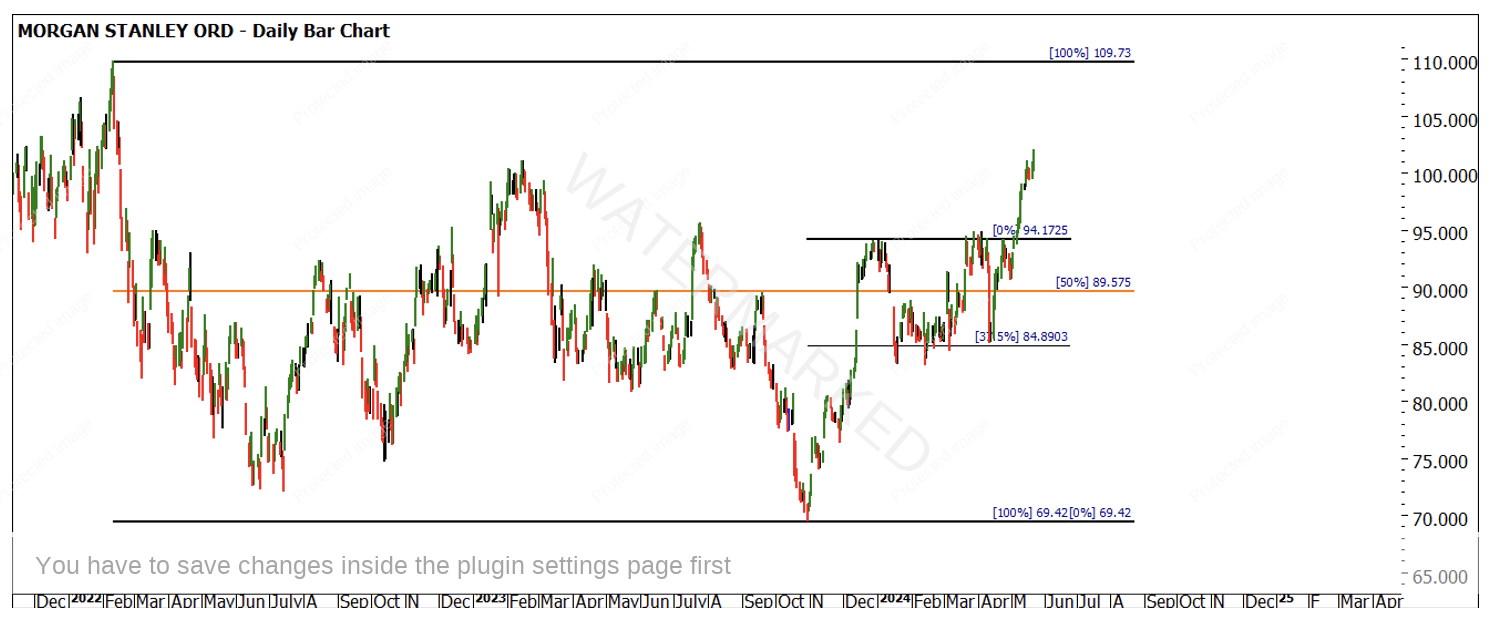
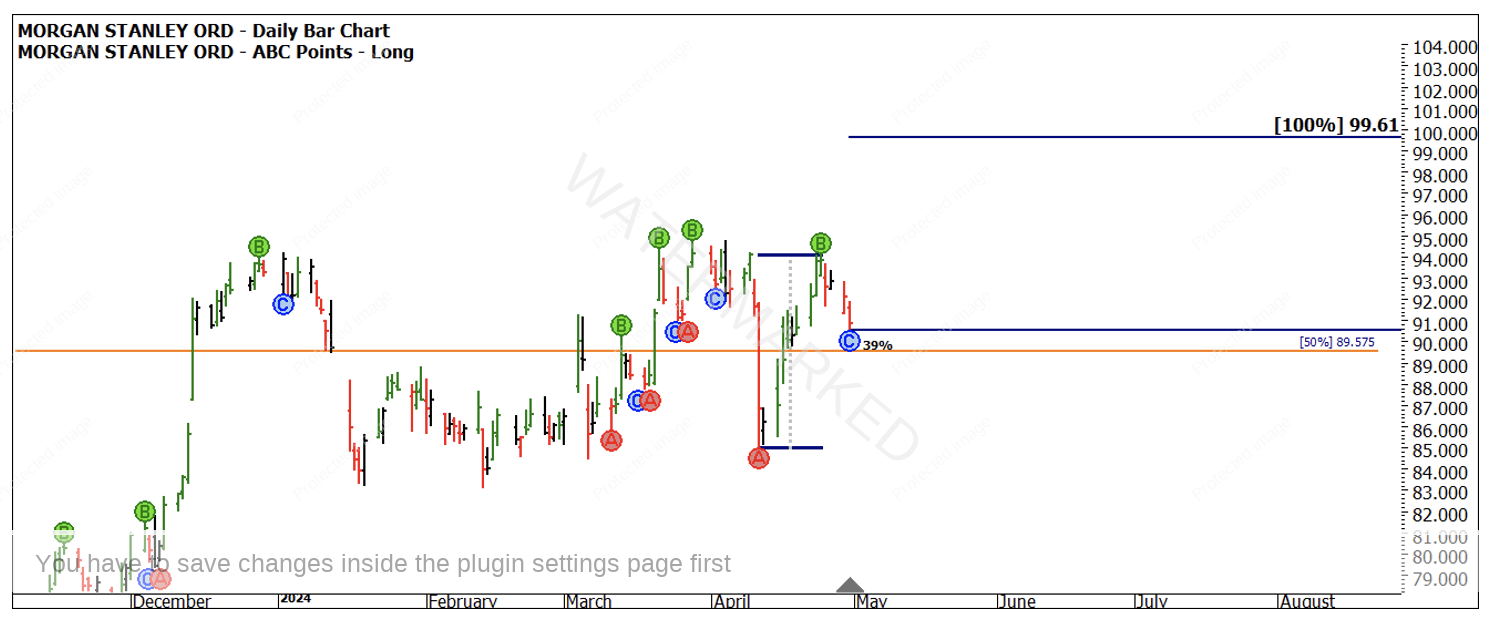
To bring this to a finer point I return to the US stock Morgan Stanley that has offered some strong trading ranges and trends to follow. Chart 4 shows a broader section of the market where we can see it often consolidates around certain resistance /support areas before it breaks out. This has been a strategy that has yielded success. After the short option in April the price action came back to the approximately $85USD and then failed to break to the downside on the 4th occasion (look at Gann’s work discussing this).
Chart 4- MS.NYSE Daily Bar Chart
The price action then surged back signalling an ABC trade straight from the Smarter Starter Pack. There was not too much about that pattern that held us up as retracements, ranges and volume all met a tick in our standard criteria.
On the bigger picture the Point C on 30th of April sat nicely above the 50% level (orange line above) at approximately $89.50.
Chart 5- MS.NYSE Daily Bar Chart
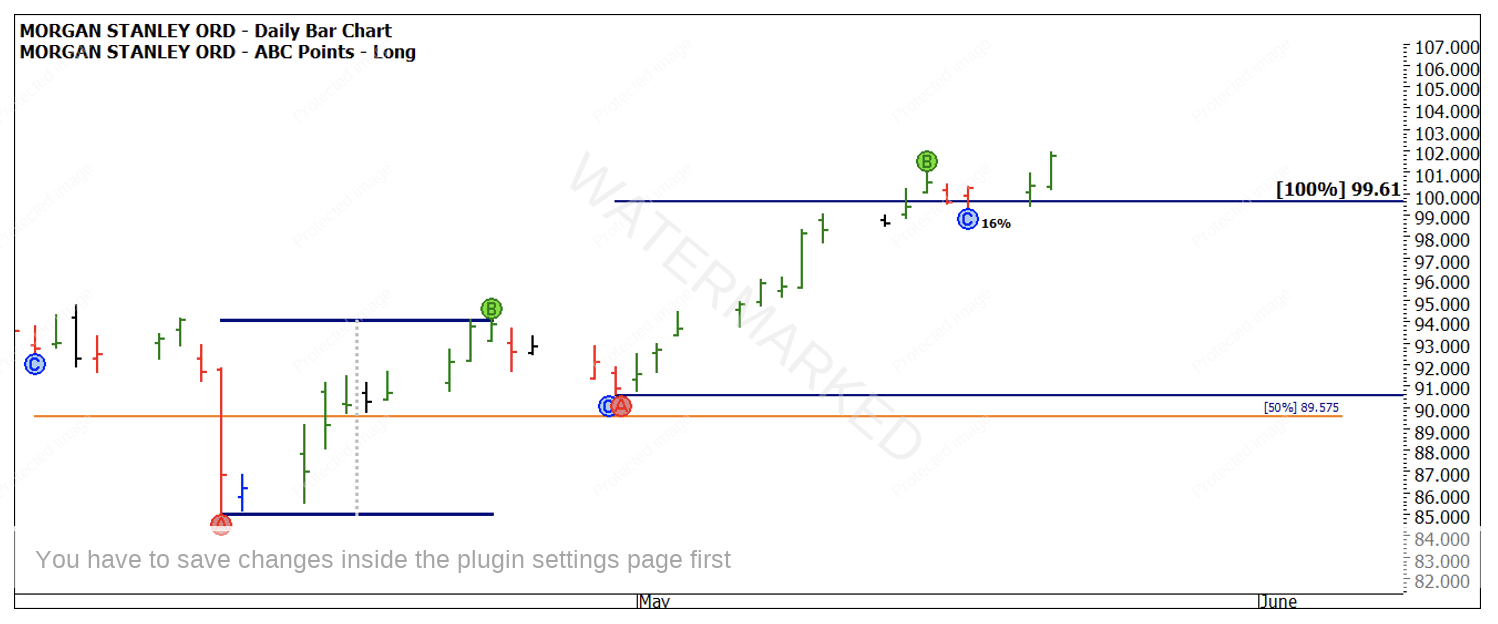
The subsequent entry and run up to the $100 level delivered an approximately 7 to 1 reward to risk off a pretty standard setup, this assumes the trade was closed at 100% but there is a case to say you could still be in it watching to see if the all-time high from the tech wreck at $110 could be tested.
Chart 6- MS.NYSE Daily Bar Chart
We are sitting at interesting levels across many markets around the world. If you have set your ranges and resistance cards for key areas to watch it can be a case of sit back and watch the price action cluster then act /react around those levels and then hop onto the elevator and ride that move.
Good Trading
Aaron Lynch
