Golden Moments
Welcome to this month’s Platinum newsletter, I hope as we pass the 66% milestone of 2024 that with a third of the year left your goals are in sight from a trading perspective. The good news as I see it is that markets are moving albeit with increased volatility and there is still some juice to squeeze from the markets. Conditions like the weather do and will always change so I am getting prepared for different trading conditions and in many cases position sizing as the volatility of markets creeps higher. I always have a view on the big rocks of geopolitical tensions, and if we are looking for catalysts for markets to move, there are plenty that are brewing on the horizon.
Gold is this month’s focus as I pick up from what we discussed last month. You should review the analysis we looked at last month to add to the information here. A study of history tells us markets can underperform towards the end of the year and there are specific times that we can watch for. Most will reference them in hindsight, however the 144-month cycle as outlined last month can help us understand areas for major turns.
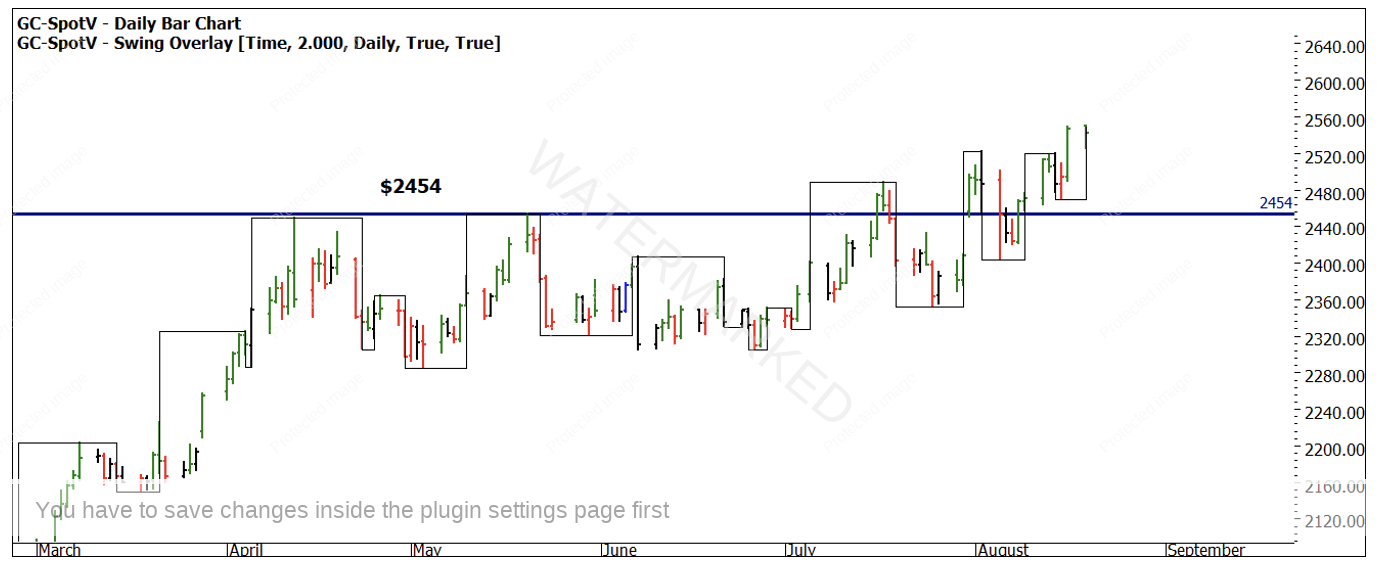
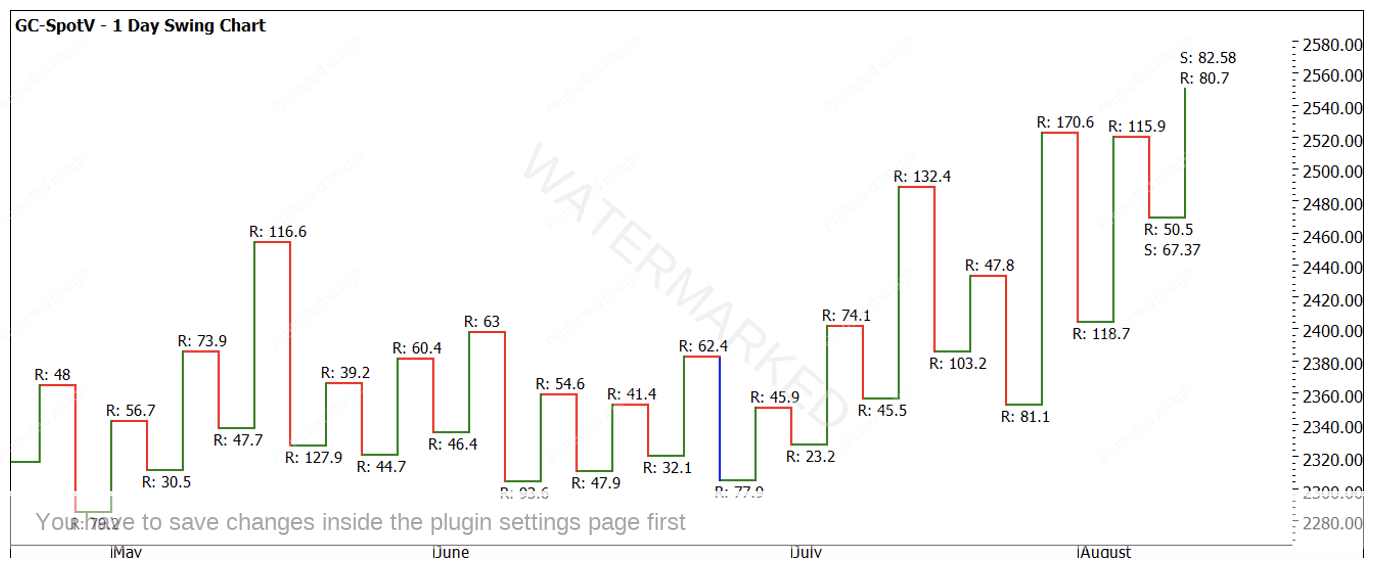
Chart 1 highlights the recent breakout to the upside on Gold futures at the $2,454 area. The two-day swing chart shows the trend to be up. It’s times like these when volatility is rising, and markets are becoming stretched that a two-day swing chart can help smooth the picture. A good exercise is to review the same chart as a one-day swing chart and compare how many extra swings are present?
Chart 1 – Daily Bar Chart GC-SpotV
Chart 2 – Daily Swing Chart GC-SpotV
The main challenge I am experiencing is getting set and then holding while the market decides the direction it wants to go without kicking me out. Nothing smarts more than a market doing what you expected after getting kicked out.
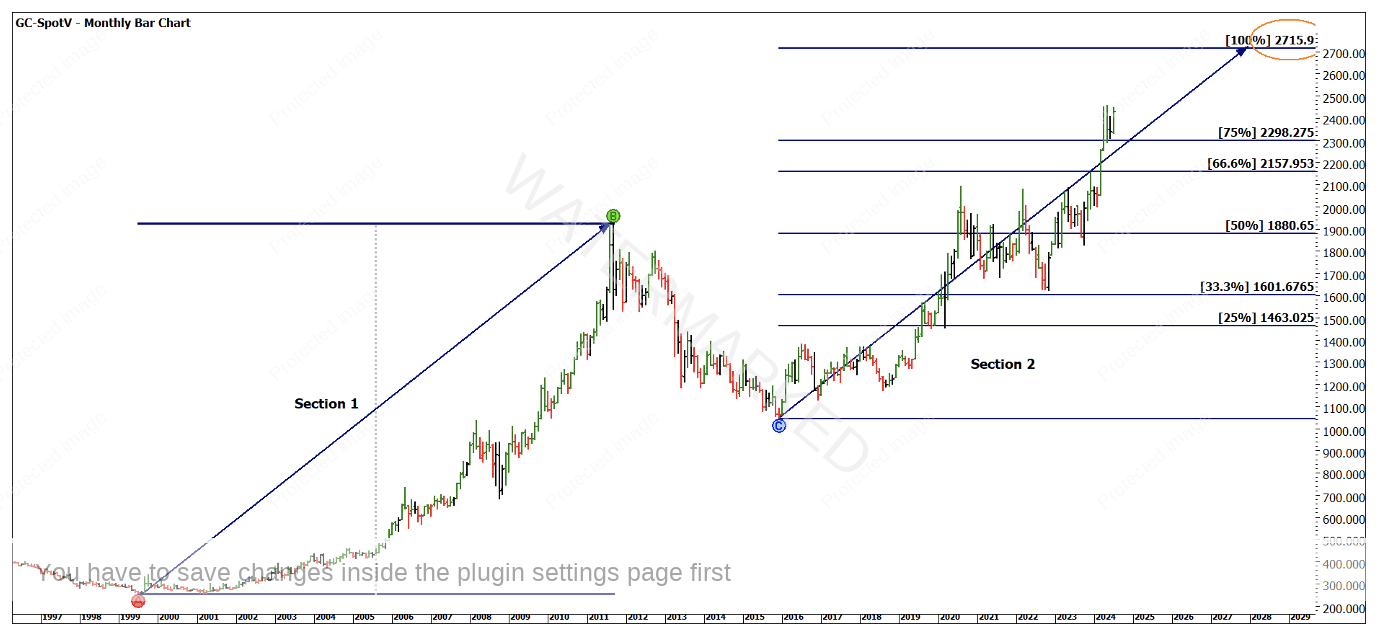
Chart 3 is the same chart from last month, with the same reference area of $2,715 holding as a logical place where history repeats for the end of this current section. At the time of writing Gold is trading at $2,542 which leaves a range of $173 if the 100% repeat comes in.
Chart 3 – Monthly Bar Chart GC-SpotV
Given the nature of Gold futures and the current margin rates of $10,000 per contract USD, there could be a case to use a CFD or even look to analyse and trade the major underlying stocks. In the case of Gold, Newmont is the largest miner currently and trades on the US NYSE. This can lessen then impact of USD currency movements as we can trade the stock proxy and underlying commodity in the same base currency.
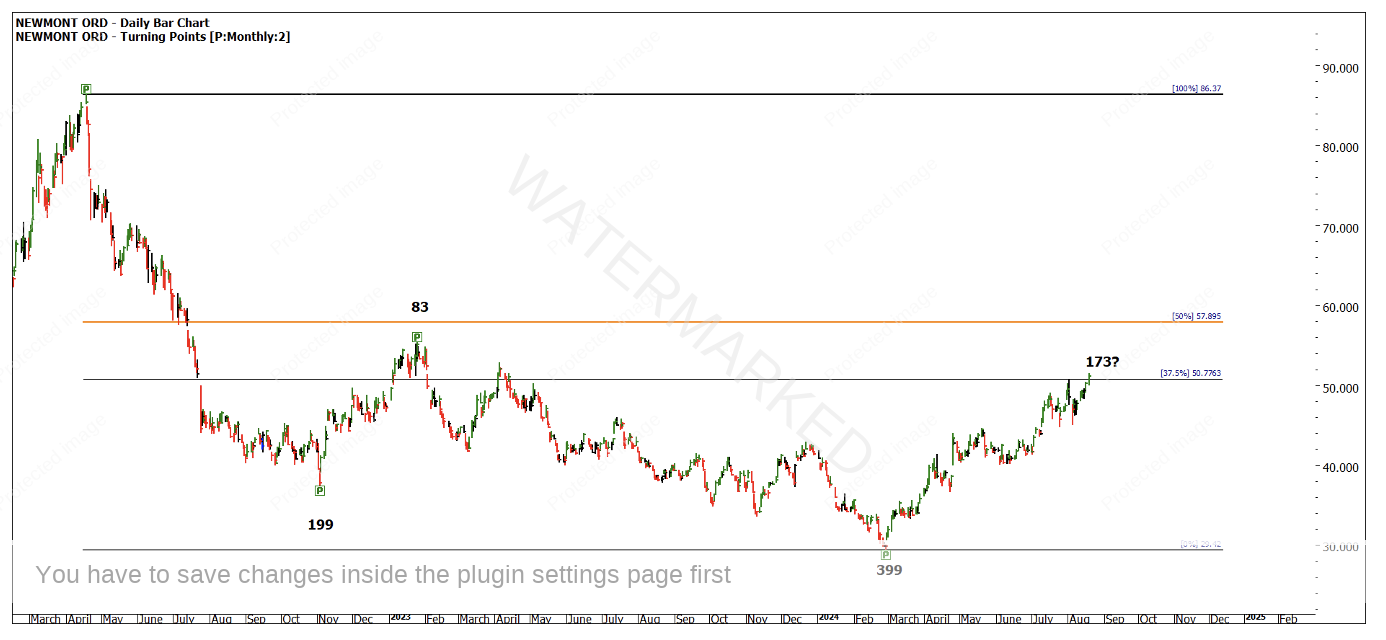
Chart 4 looks at the last 2 years on NEM.NYSE and the impact of a bearish cycle up until February 2024 where prices have nearly doubled in 2024 ($29.42 to $51.19).
Chart 4 – Daily Bar Chart NEM.NYSE
Of note will be the 50% pressure point at around $58 and the time frames of the major ranges as noted in black. There is some nice repetition in terms of multiples and from last months’ time frame analysis, September 7th is looming as a potential time pressure point for Gold futures.
Having a stacked view of a commodity, its currency in this case USD and a major stock in that sector can allow us to track the moving parts as they all run together. It’s very rare to see all the moving parts cycle exactly together (as we would expect) as each market has its own heartbeat, I do find it can assist in confirmation of market events.
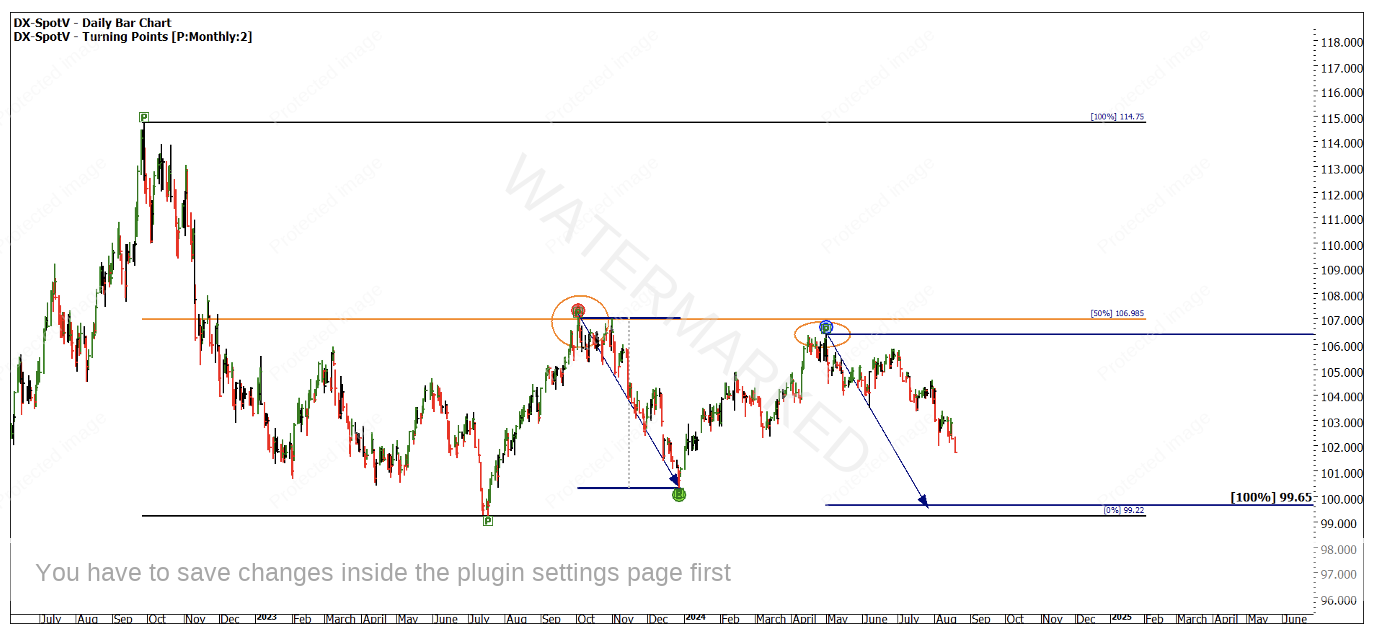
The last chart shows the position of the US Dollar Index. 2024 has been sideways with lower tops off the 50%. The time frames on the downside are getting longer as well without having travelled the same level in price. Another sign of a slowing market potentially waiting for a turning point.
Chart 5 – Daily Bar Chart DX-SpotV
The important aspect to undertake at this stage is to do the work yourself, set up the charts and see how you can overlay your thinking. Given there are lots of moving parts we must be clear on the detail.
Gold has a prominence in markets that attracts noise and commentary but when it trends it can offer excellent opportunity.
Good Trading
Aaron Lynch
