A World of Probabilities
What an interesting month on the SPI200! With a current All-Time High at 8121 made on 1 August, there is a current low on 6 August at 7472. That’s 649 points in 3 trading days!
Considering three days down moves the three-day swing chart, it’s a good one to examine to get a read on the situation.
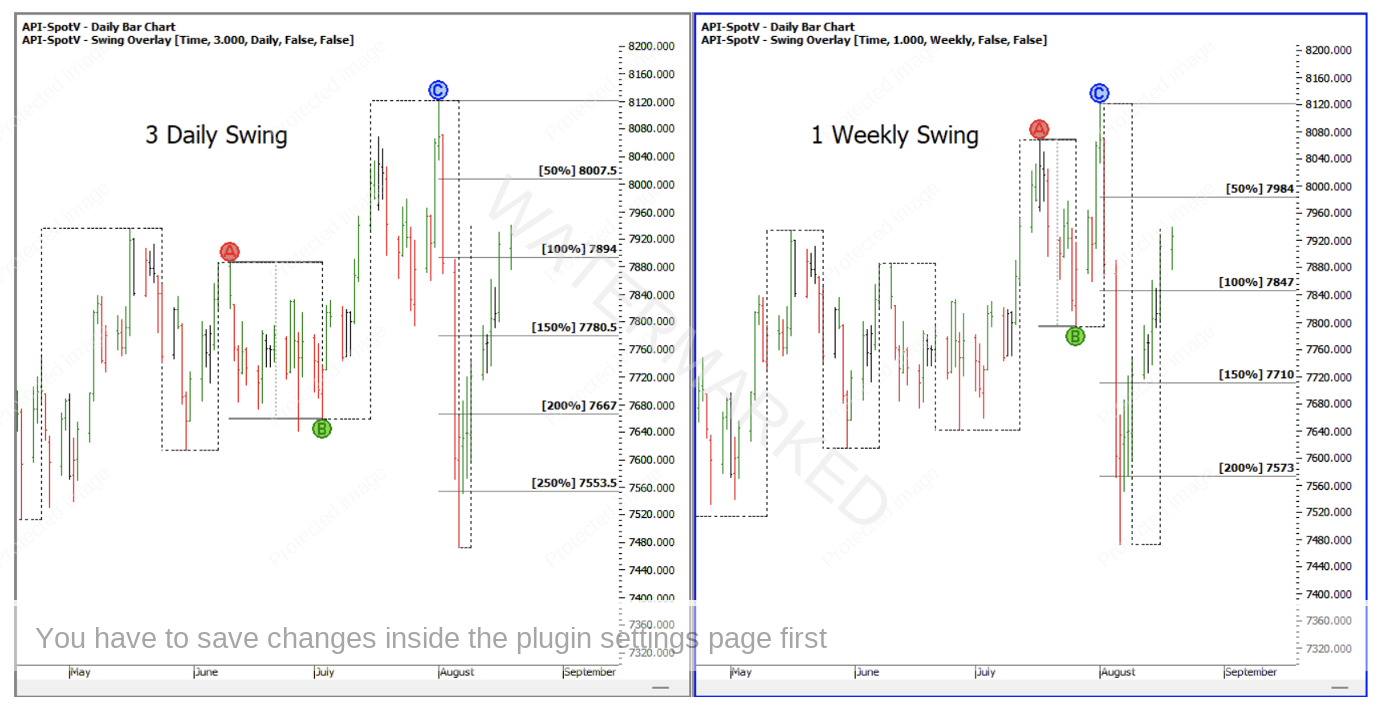
Both the weekly and three-day swing showed an Overbalance in Price that exceeded 200%. However, neither swing produced an Overbalance in Time. See Chart 1 below.
Chart 1 – Weekly and Three-Day Swing Chart
Since 1 August 2014, there have been 205 three-day swings, of which 28 were Overbalance in Price swings that exceeded 200% of the previous swing in that direction. Of the 28 Overbalances in Price, 21 of these also showed an Overbalance in Time of 200% or more.
Of the 21 Overbalances in Price and Time swings, 13 or 62% showed a continuation of the trend in the direction of the Overbalance after its three-day swing pull back.
That brings us to 7 instances of an Overbalance in Price without an Overbalance in Time. The seventh one we are still watching unfold so that leaves six we can analyse. Of the six, there were five occurrences where the Overbalance in Price did not change the trend!
This is an important percentage of probabilities. The above means:
83% of Overbalance in Price swings (without an Overbalance in Time) ended up being a pull back and DID NOT result in a change in trend!
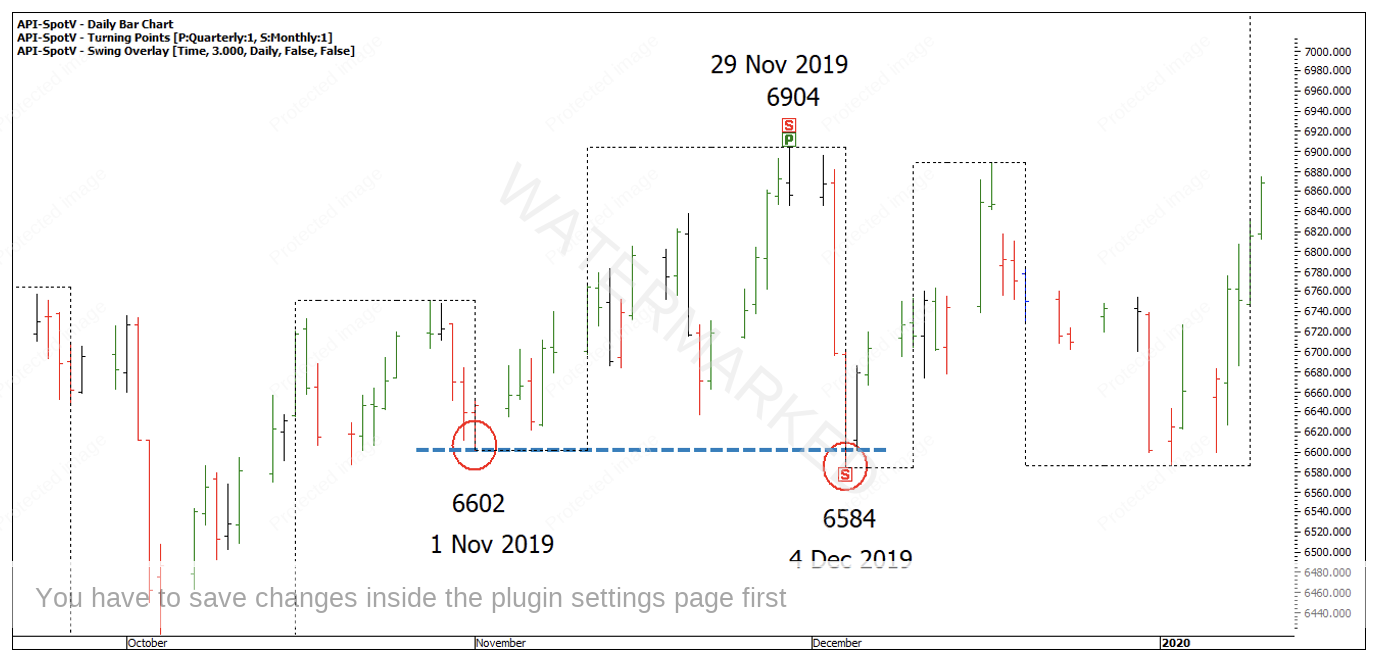
The only other time in the past 10 years that has produced a three-trading day Overbalance in Price was back in December 2019.
Chart 2 – Three Day Overbalance in Price
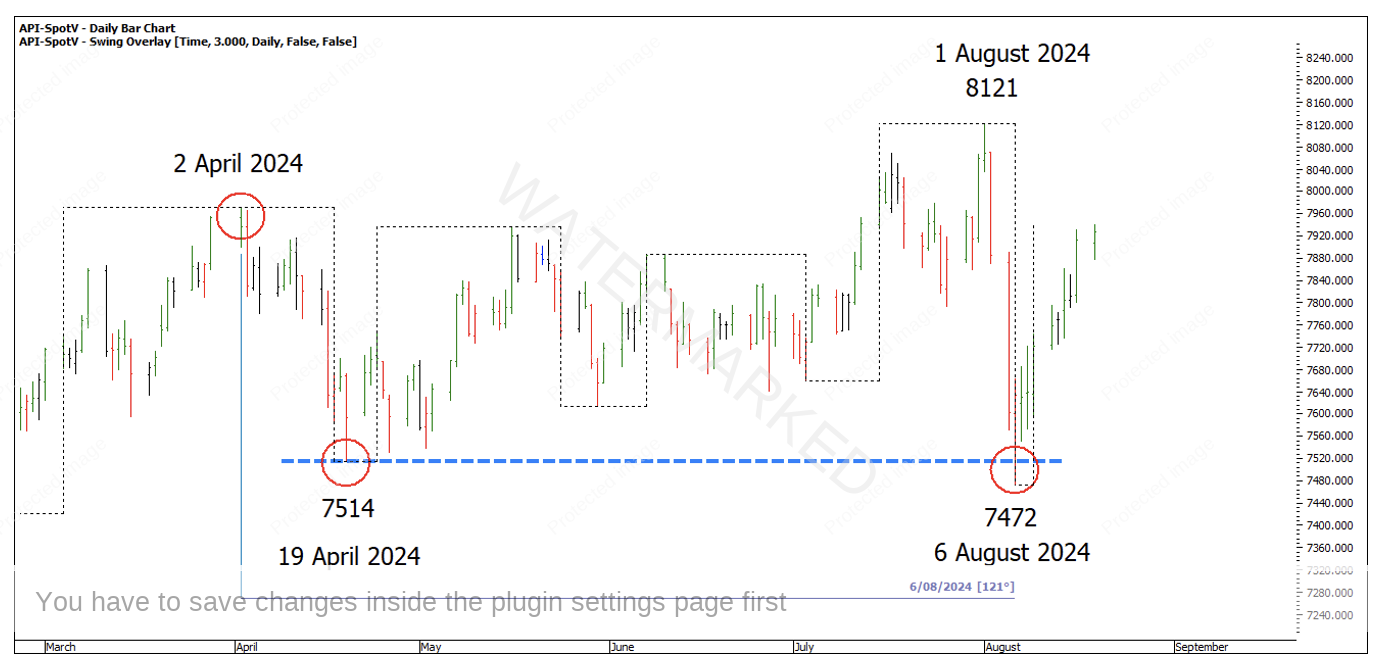
Comparing the 4 December 2019 low to the current market, there are some similarities. The current market shows three trading days into a false break double bottom on a seasonal date, 121 degrees from the 2 April 2024 top.
Chart 3 – Double Bottoms
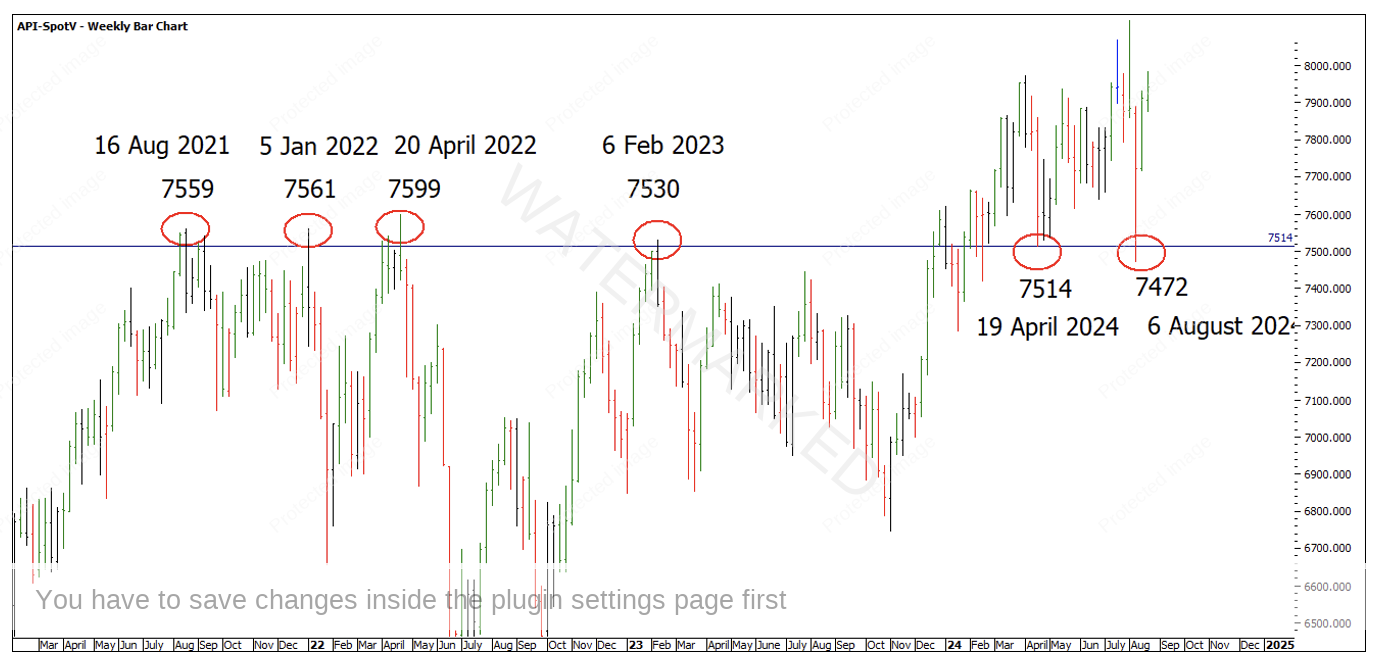
Having a look at the bigger picture, the current double bottoms sit on old all-time highs and what you would consider very strong support levels. Because the market broke through all-time highs in December 2023 and was the fourth time through, double bottoms are now sitting on four major tops.
Chart 4 – Old Tops, New Bottoms
Anyone with the Master Forecasting Course could check David’s Rating the Market alignment on the SPI200 for a potential outlook.
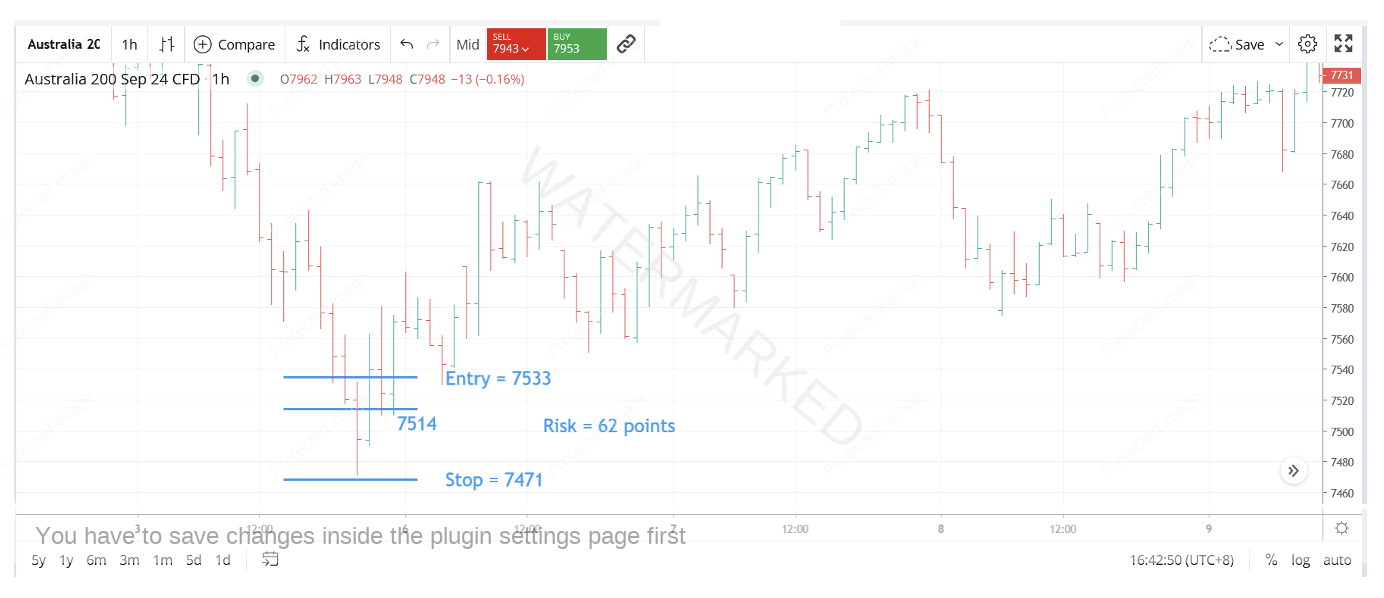
Looking for an entry, the four-hour bar chart shows a big expanding range down and no real signs of completion. The one-hour bar chart also shows an expanding range into the low.
An aggressive entry could have been taken as the one-hour swing chart turned up after 7514 (the previous low) was broken to the upside. With a stop under the extreme low that gave 62 points of risk.
Chart 5 – One-Hour Entry
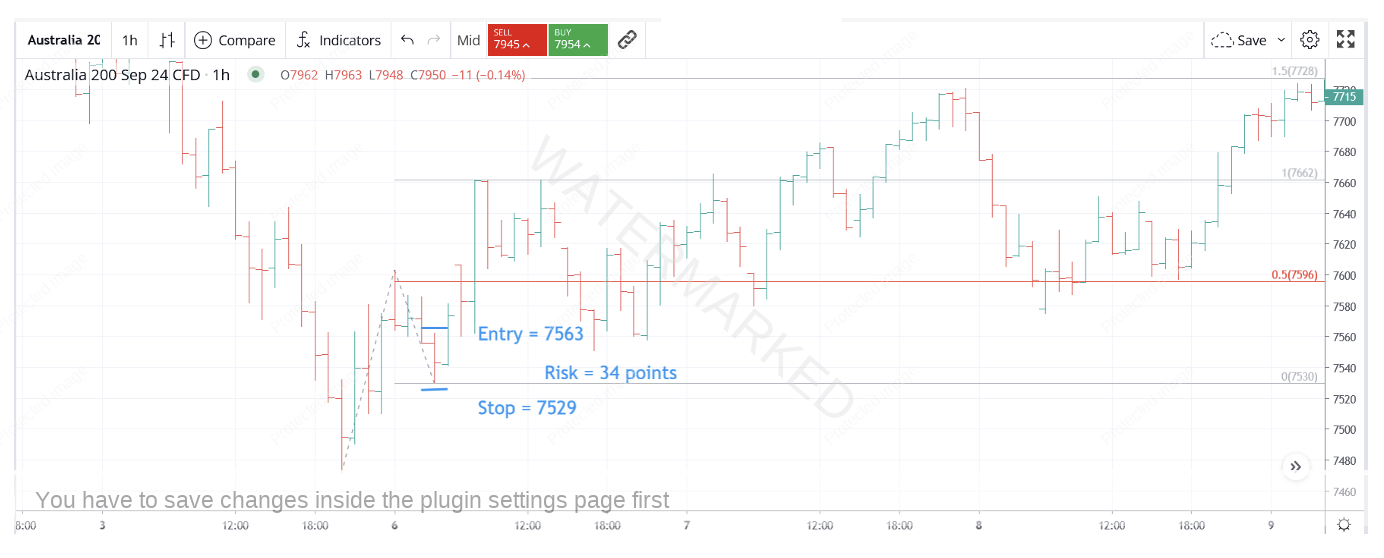
Another potential entry could have been the one-hour First Range Out re-test as the swing chart turns back up. This gave a much smaller risk of 34 points.
Chart 6 – One-Hour First Higher Swing Bottom
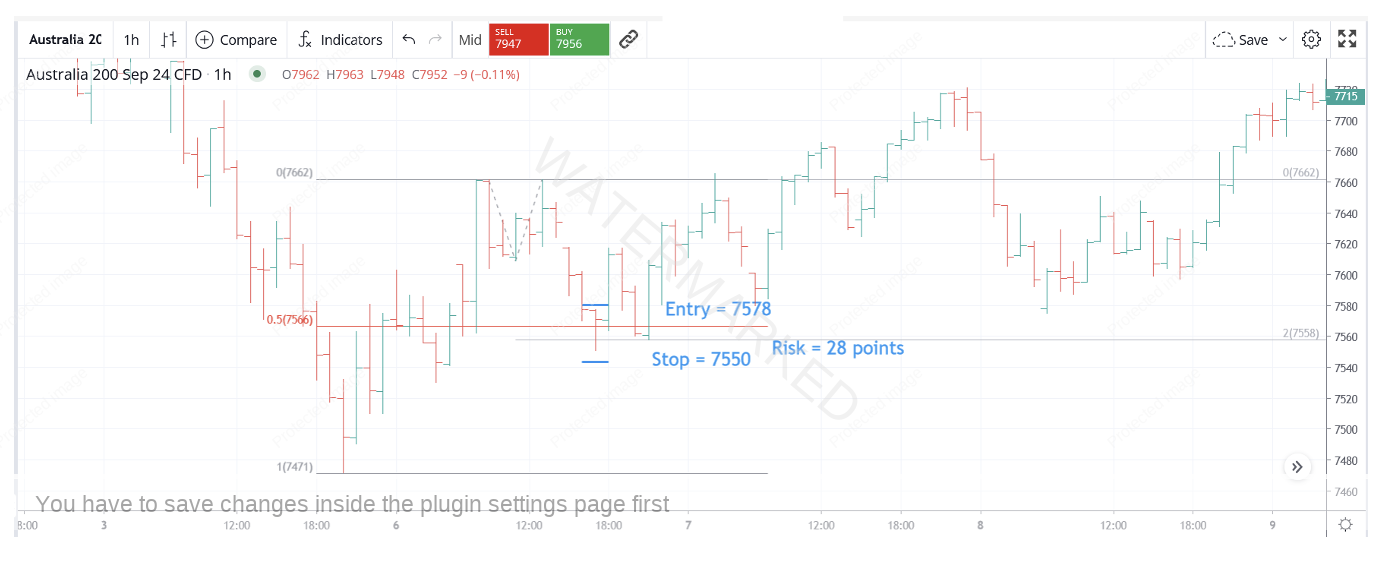
However, it was the four-hour re-test that gave the best signs of completion. A cluster that formed showed:
- 200% of the hourly First Range Out = 7558
- 50% retracement = 7566
- Entry at 7578 with a risk of 28 points
Chart 7 – Four-Hour Retest
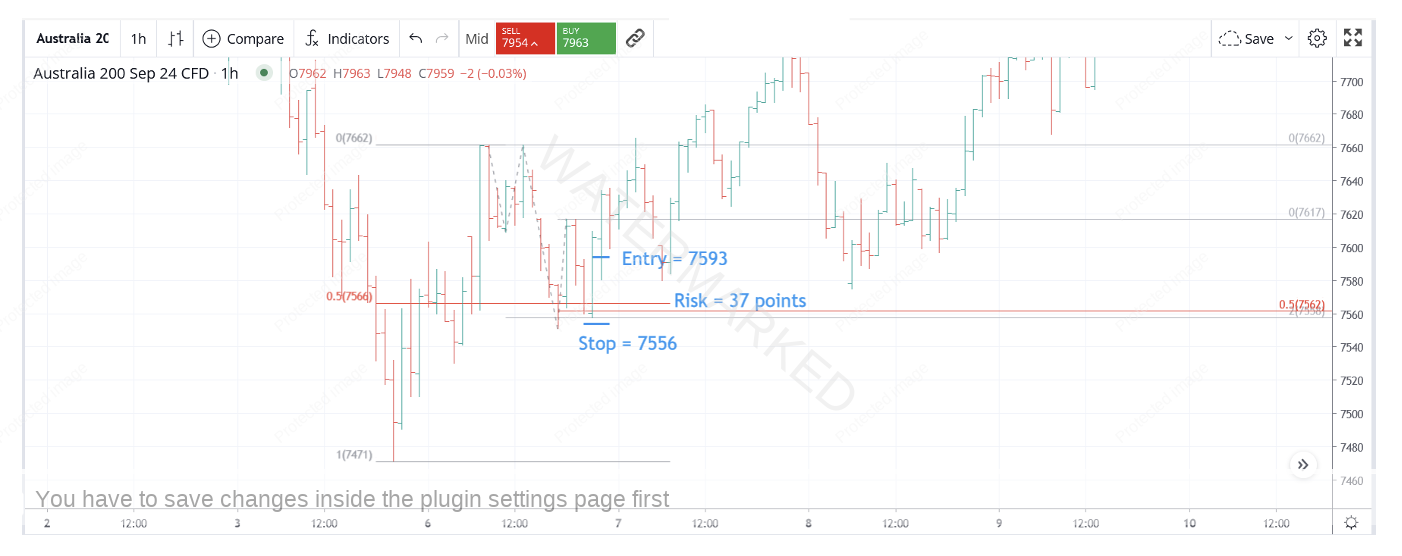
Waiting for a third sign of completion, the one-hour chart put in a failed swing down at 50% and a higher bottom. Entry here as the swing turned up gives us 37 points of risk.
- 200% of the hourly First Range Out = 7558
- 50% retracement = 7566
- 50% of last one-hour swing = 7562
- Entry at 7593 with a risk of 37 points
Chart 8 – Failed Hourly Swing Down
According to the three-day swing chart a long position has a higher probability of success.
Happy Trading,
Gus Hingeley
