Crude Oil Update
Consumption has long underpinned the growth of many markets and countries, and I get the distinct impression that the consumption story is starting to slow, especially in the energy and resource space. The good news is that in markets that can be influenced by the producers and participants, lower prices can be used to keep the train on the tracks. Just on cue, as seen many times historically, oil prices are falling and I start to ponder the possibility of major lows in the last quarter of the calendar year as we have seen so many times before.
There are two main price pictures I am looking at, and they could both play a part in the future pricing of Crude.
Chart 1 shows the current cycle and the bullish range of 2020/2022 and the subsequent sideways pattern. We see this sideways pattern occurring in what we now know as a high inflation environment, as commodities generally see price increases in inflationary environments, I find the last two years somewhat significant.
The challenge we see as chartists is that we have two highs in 2022 to use as an anchor for our Ranges Resistance Card. These highs could be looked at as the physical high ($130.50) and the true high $123.68. The main difference is that one was the absolute high and the second produced better conditions to sell short from.
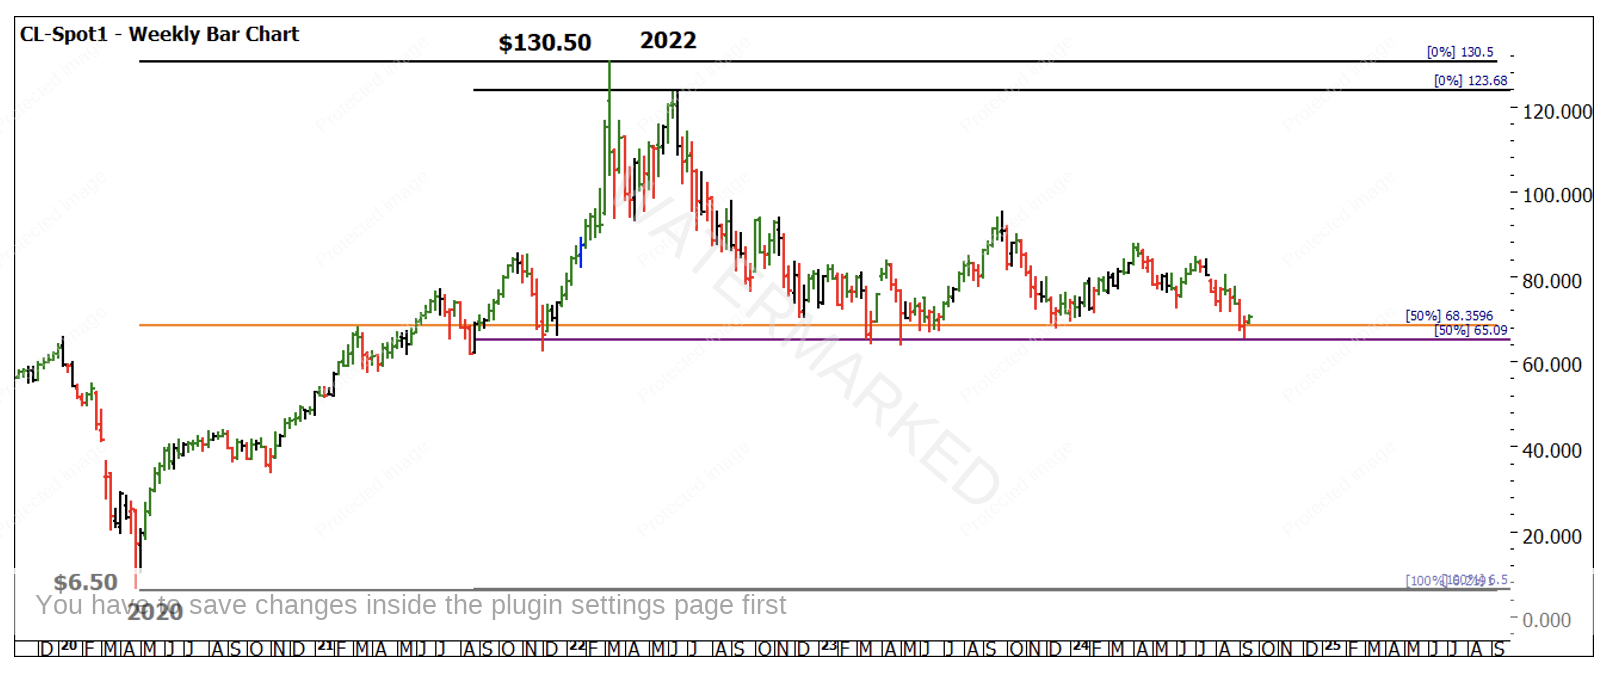
Chart 1 – Weekly Bar Chart CL-Spot1
Using both prices we see the current price action hovering around the 50% of each range. For the sake of best fit we might argue that the $123.68 high offers the best harmony as we have seen the price action reverse three times at this level.
Chart 2 shows this level (in orange) and I have marked the three times, including the most recent weekly swing low, for reference the price level is $65.09.
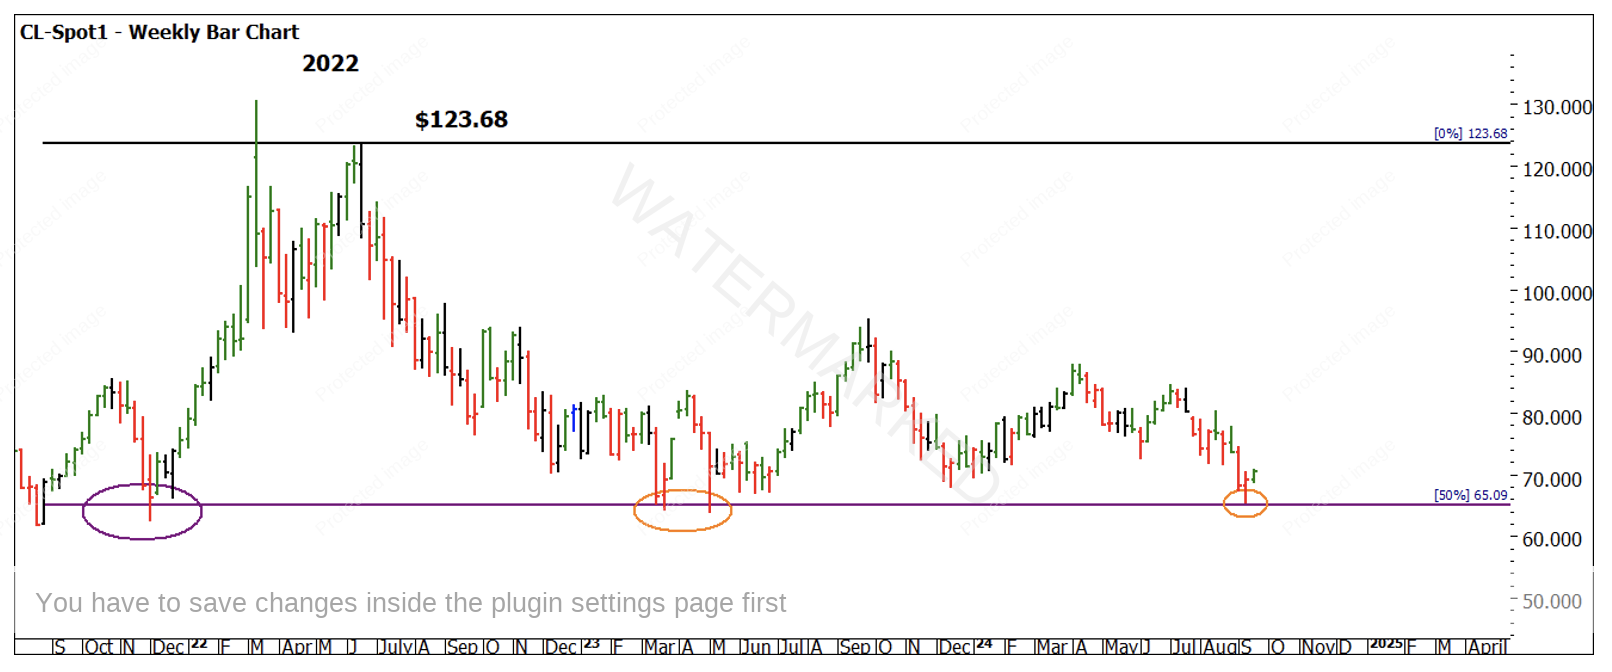
Chart 2 – Weekly Bar Chart CL-Spot1
Interestingly we see circled in purple, that this level was also a support area in the initial run up to the 2022 high. I don’t include this as a fourth time as the high and pullback had not formed yet, however it does suggest that there is harmony around this level. As we see prices at the petrol pump start to abate in many places in Australia, will this level hold and provide a base to build from? I would suggest if this level is broken a fourth time, then we could see lower prices in the short term.
Triple bottoms can be a place to watch as well in terms of big picture moves so we are somewhat in a conundrum until we see some confirmation of direction.
Chart 3 looks at the ranges in terms of Time, there is some commonality in the numbers we are seeing, however, the main theme is expansion of time frames to the downside and contraction of ranges to the upside. The time trend is suggesting a down trend, and we can look to confirm this if we see a break below the 50% level.
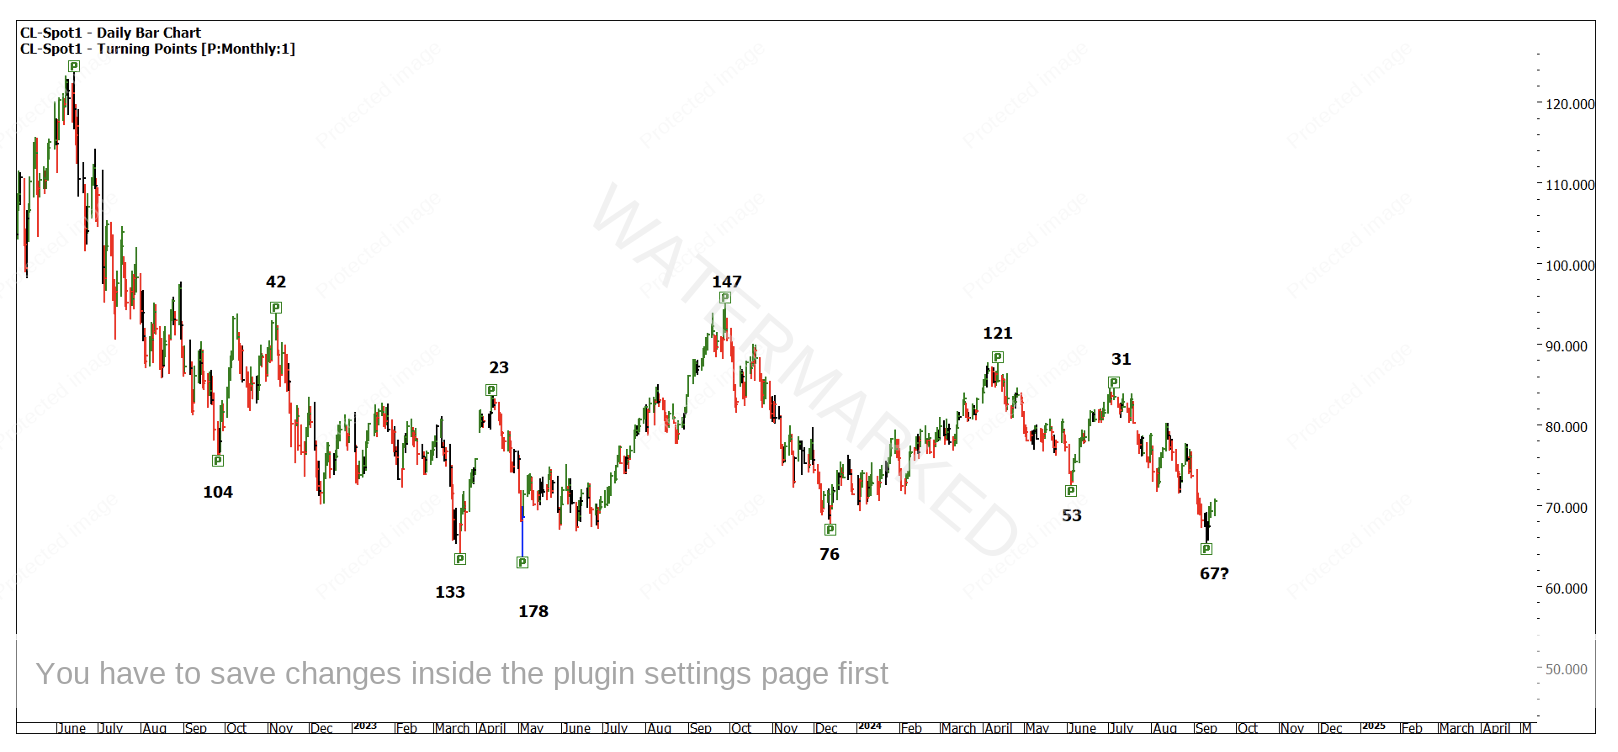
Chart 3 – Daily Bar Chart CL-Spot1
As students of David and Gann, you should have Wheels Within Wheels operating and an appreciation of where we are on the small and big picture. I am seeing two moves in the next 6 -9 months worth watching out for as a trader, and in the medium term, more sideways conditions to continue.
Of course, markets will do what they will, so combining perspectives is very important and applying your trading plan to signals will be a big part of the discipline needed for profits. The move out of current support could be watched closely for an Overbalance in Price setup, a break under $65 would suggest we are diverging from the larger road maps.
Good Trading
Aaron Lynch