What’s Your Gold?
What techniques have you thoroughly tested and now understand their success and failure rate? Is it documented, and something you could hand to someone for them to understand?
I think most people would be guilty at some point or another of spending hours in front of software charts or hand charts, trying a technique to see how it works but not actually applying and recording it in a way to give an outcome of probability.
These days I’ve simplified back testing with a clearly defined goal and outcome. In some recent testing, I’ve found by rating the close of Fridays bar with Friday’s open and Thursday’s close price on the SPI200, with 64% probability, it can predict whether or not the next week will be an up week or a down week. 26% of indications will be wrong, and about 10% will be an inside flat week.
I can improve on 64% if I count how many weeks the market has run up or down for. A lot of the time the SPI will only do 1-3 weeks in a certain direction before putting in a weekly swing top or bottom.
If the market gives the signal that it’s heading up next week, I look to buy the re-test trade on the next daily higher swing low or Point C and enter on a 15 minute, 1 hour or 4 hour swing chart.
Let’s look at a very recent example on the SPI200, the week ending 6 September 2024. This was an outside week that must put a swing in the market, but also gave the signal that it was heading up the following week.
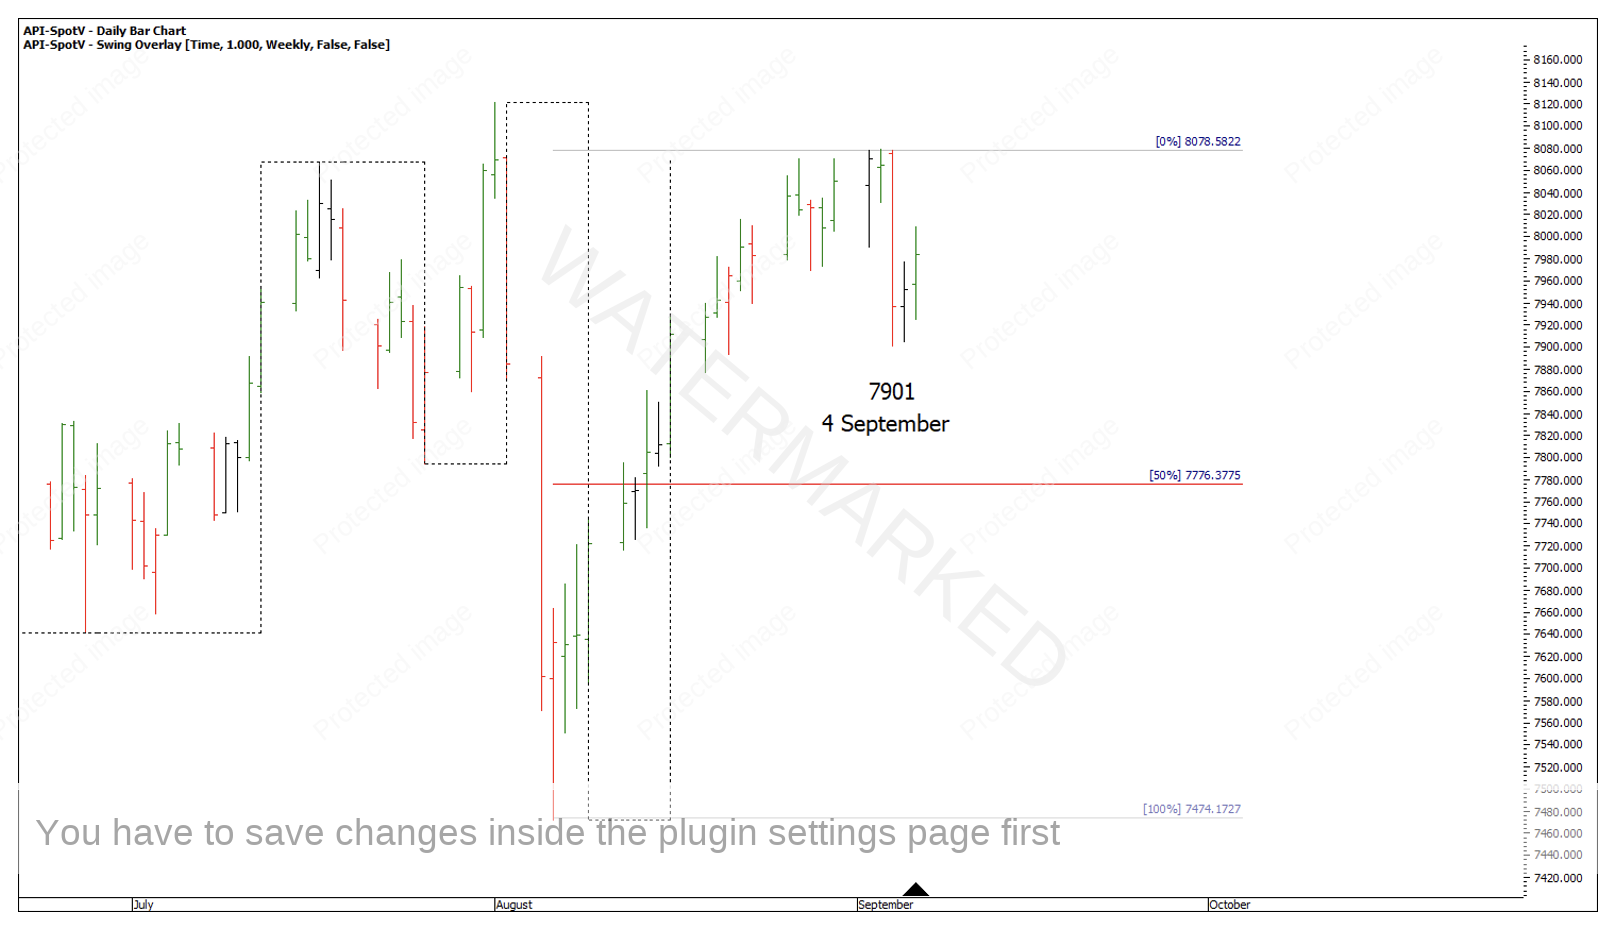
Chart 1 – SPI200
On Monday 9 September, the market made a low at 7867 showing a contracting daily swing down. Tuesday was an up day, giving an expanding daily swing up and Wednesday was a down day and put me on guard for a possible Point B to trade long out of. Friday’s close gave the signal for an up week, a higher bottom looked to confirm that.
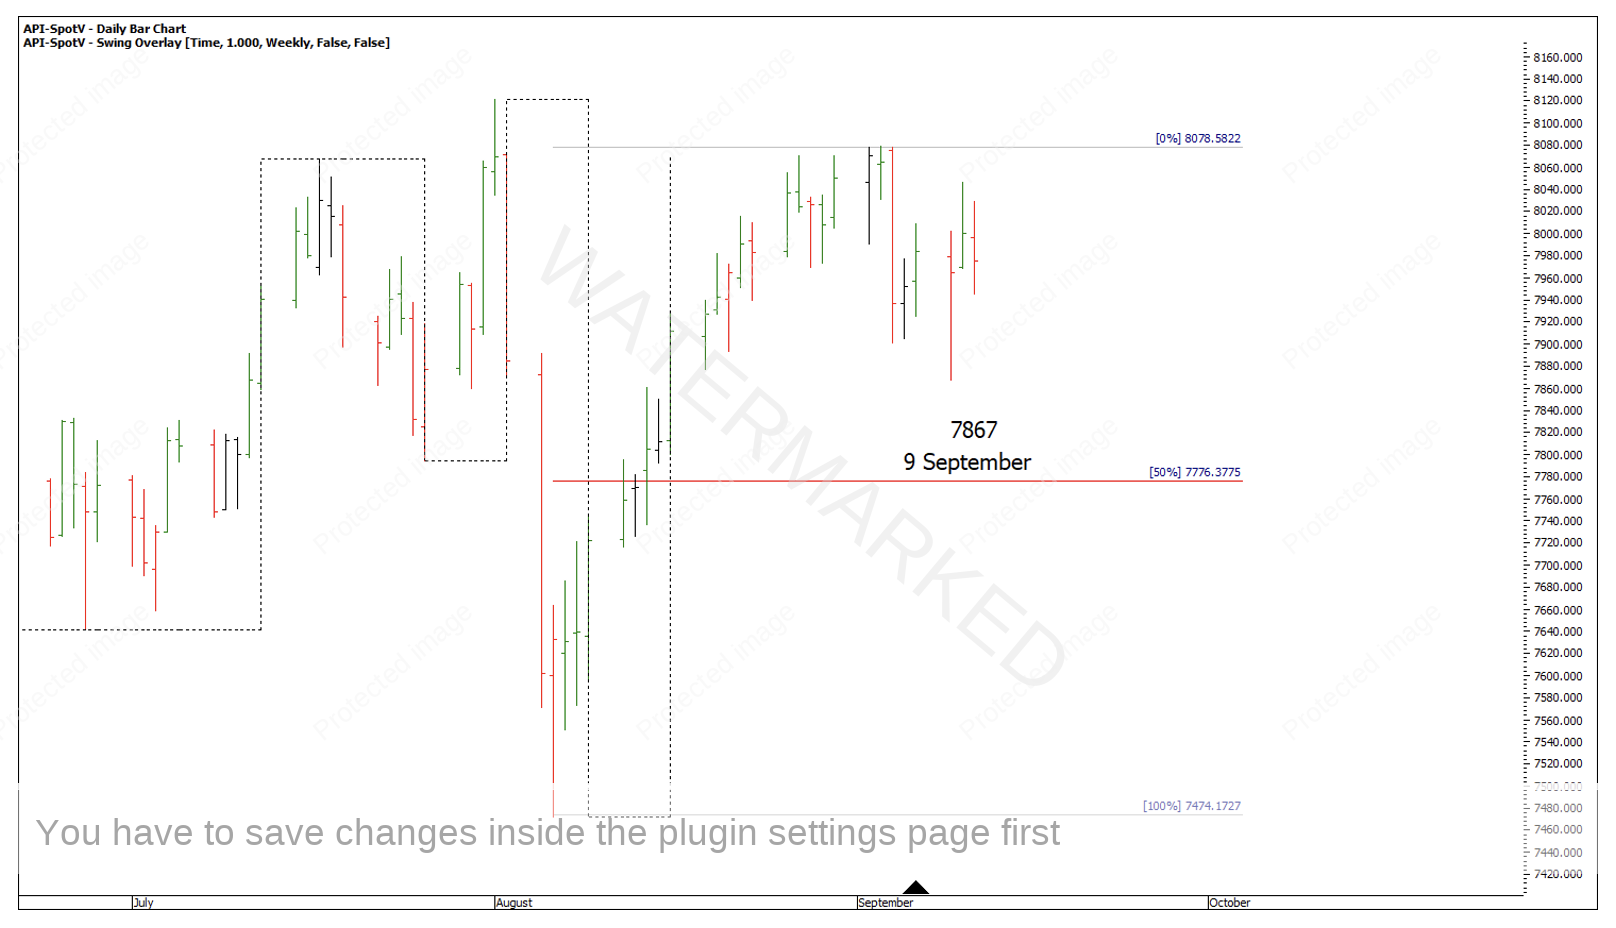
Chart 2 – Weekly Swing Low
At one point there was an expanding 4-hour swing range into a 50% retracement. This provides an opportunity to learn by asking, with a 4-hour expanding second section into 50%, what is the probability of this being the end of the re-test? Is this a sign of completion?
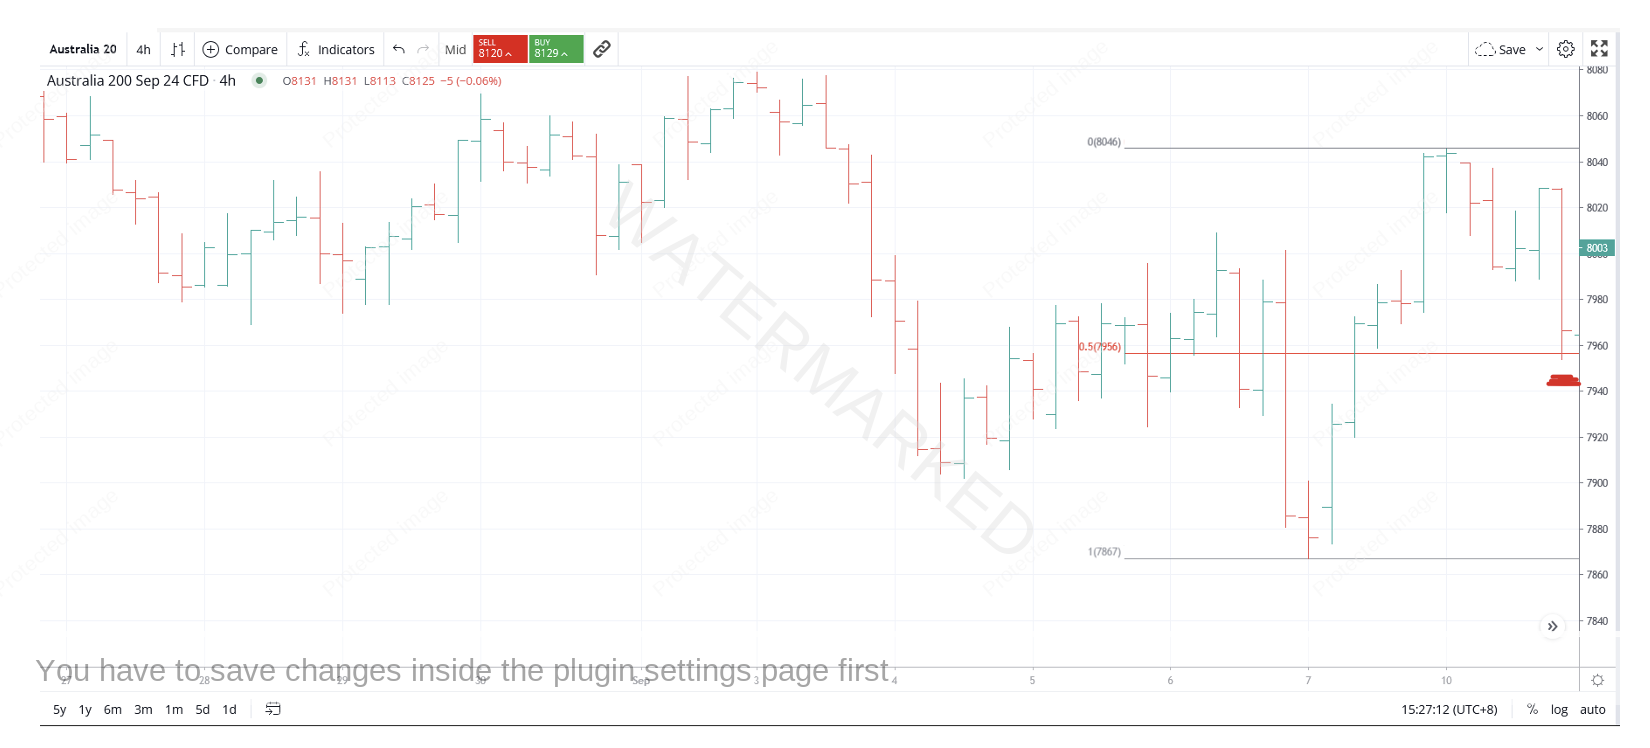
Chart 3 – 50% Retracement
There ended up being a third, 4-hour swing range down into the 66.6% retracement level with the third section a contracting section down. For added price forecasting, if you look at the last 4-hour swing into the low, it was made up of a single one hour swing that went to exactly 250% of the previous swing range.
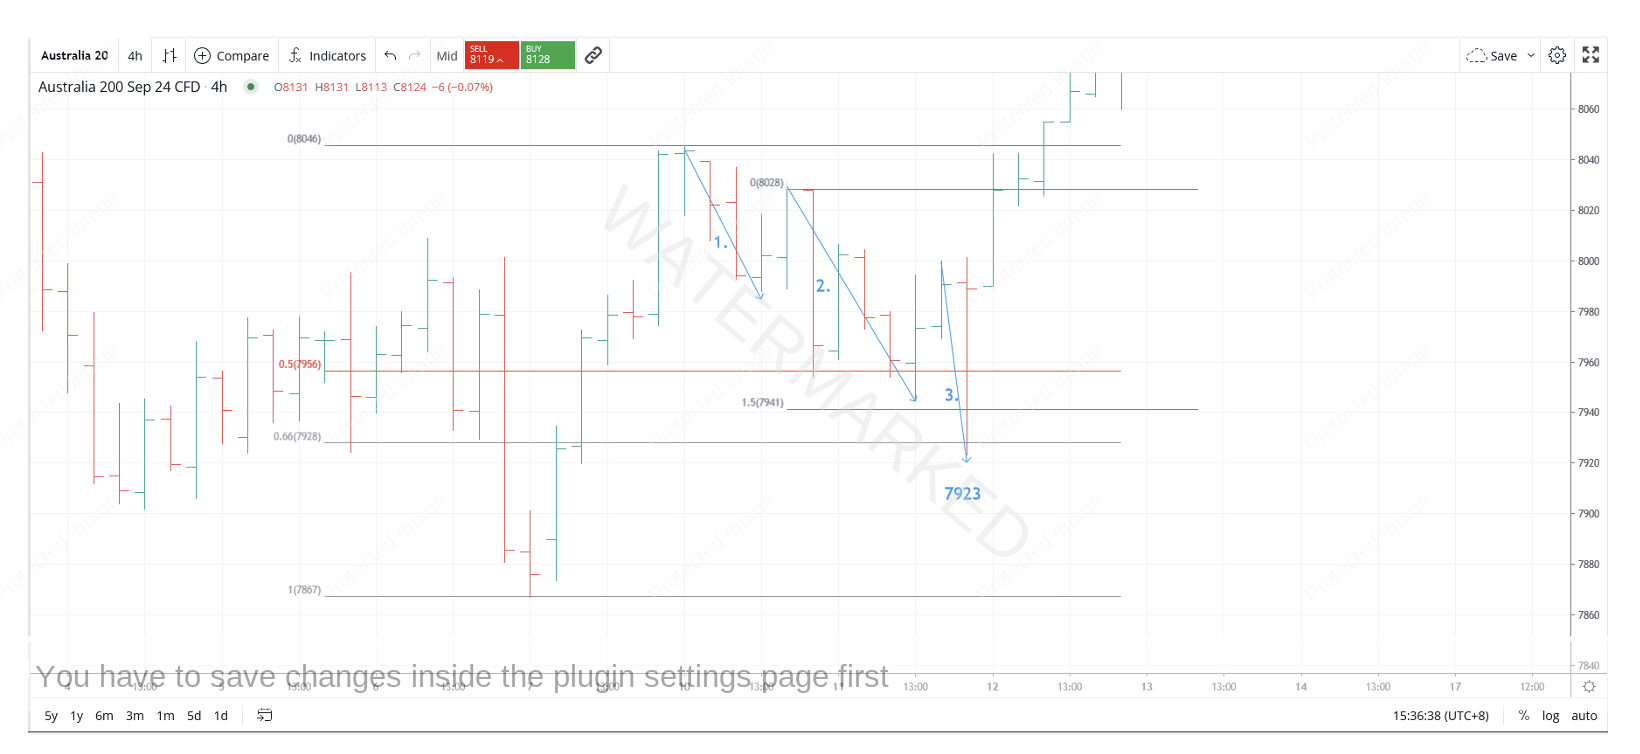
Chart 4 – Sections of the Market
A setup never seems complete without landing on a Time by Degrees date. September 12 to 13 or more accurately, 19-21 degrees of the month, was a Time by Degrees date I was watching that showed up on my 90-degree vibration wall chart. There was a one and two year weekly swing anniversary, and weekly turns 90 and 180 degrees prior.
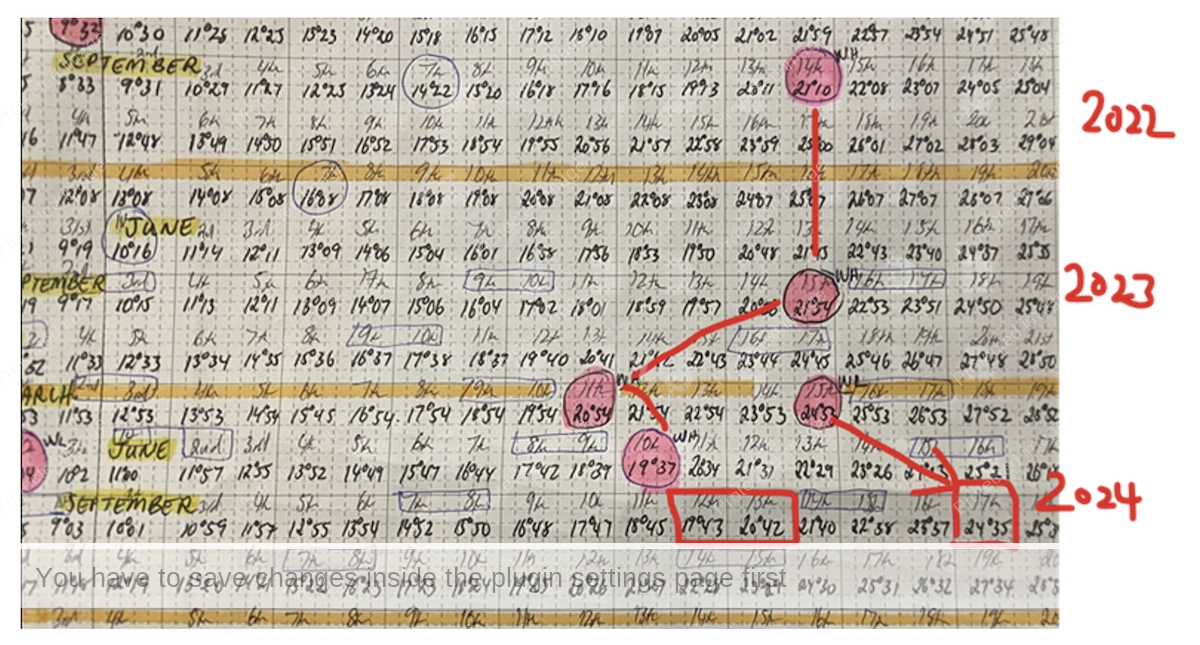
Chart 5 – 90 Degree Vibration Wall Chart
Time by Degrees doesn’t always have to give you weekly or monthly swing tops and bottoms. Sometimes, like in this instance, it backs up your date for a higher swing bottom.
How do you know where the market is going to stop? The answer is, you probably won’t know with a 100% certainty, but you can use probabilities to help you make a decision.
One technique I have purposely left off Chart 4 above is a First Range Out Speed Angle and like the title of the article suggest, makes up part of one of my ‘Gold Standard Setups’. I’ve left it off for anyone to go and discover for themselves to see how that may have helped you call the 12 September low.
Happy Trading
Gus Hingeley