October Cycles
We enter the month of October, and even casual observers all have an opinion as to why this month produces major market meltdowns. The pundits point to 1929 and 1987 as the majors, however I recall November 1st, 2007 vividly, as we saw the start of the GFC. How do these throw-away lines that fill column inches in articles come to be? In the case of cycles, a cursory study suggests things occur cyclically and to help keep it in a neat box we might point to the last quarter of the year for stock indexes as places to watch for. We know as students who have a deeper appreciation of cycles that there is more we can observe, measure and refine to allow us more accuracy in what to watch out for in October.
For a major correction to occur, we remember David’s words around Time, Price, Pattern, Position and Volatility. To touch briefly on the last, we can tick that box as we see US elections, weather events and conflicts as all potential triggers for market movements. I think we will see several markets define their paths as we move closer to the end of 2024. I have said this numerous times in 2024, it’s a great time to be a trader. There is movement in multiple markets and as I write, the US and Australian stock index markets, amongst others, are trading at record highs, that in itself is not a reason to expect the markets to decline, however, it adds to the melting pot of themes and currents that we are witnessing as they unfold in real time.
I am neck deep in markets currently with many exhibiting positive trading conditions for our methodology. I am cautioning myself not to spread myself too thin, but the saying make hay whilst the sun shines is at the forefront of my thinking, I wonder which of the major trading emotions is dominating that thought?
Last month I discussed Oil as being in an interesting position, and given the terrible events in the Middle East it’s not surprising that Oil is jumping around. A quick recap from last month discussed the $65 low as being a key make or break, and post that article, we saw Oil prices rally and that low hold. Using angles off the major turning points in history gave some other supporting reasons why the $65 level was key. I suggest using trading day angles for this review.
A note from last month triggered a potential setup when the price action rallied from the $65 level on September 10th. Gann always suggested the safest place to buy was the first higher bottom above major support. We did not see a classic Overbalance in Price to the upside. We see in Chart 1 a pseudo-ABC pattern using a 2-day swing chart, where entry was possible on 1 October on the outside continuation day and confirmed the higher bottom on the 2 day swing chart.
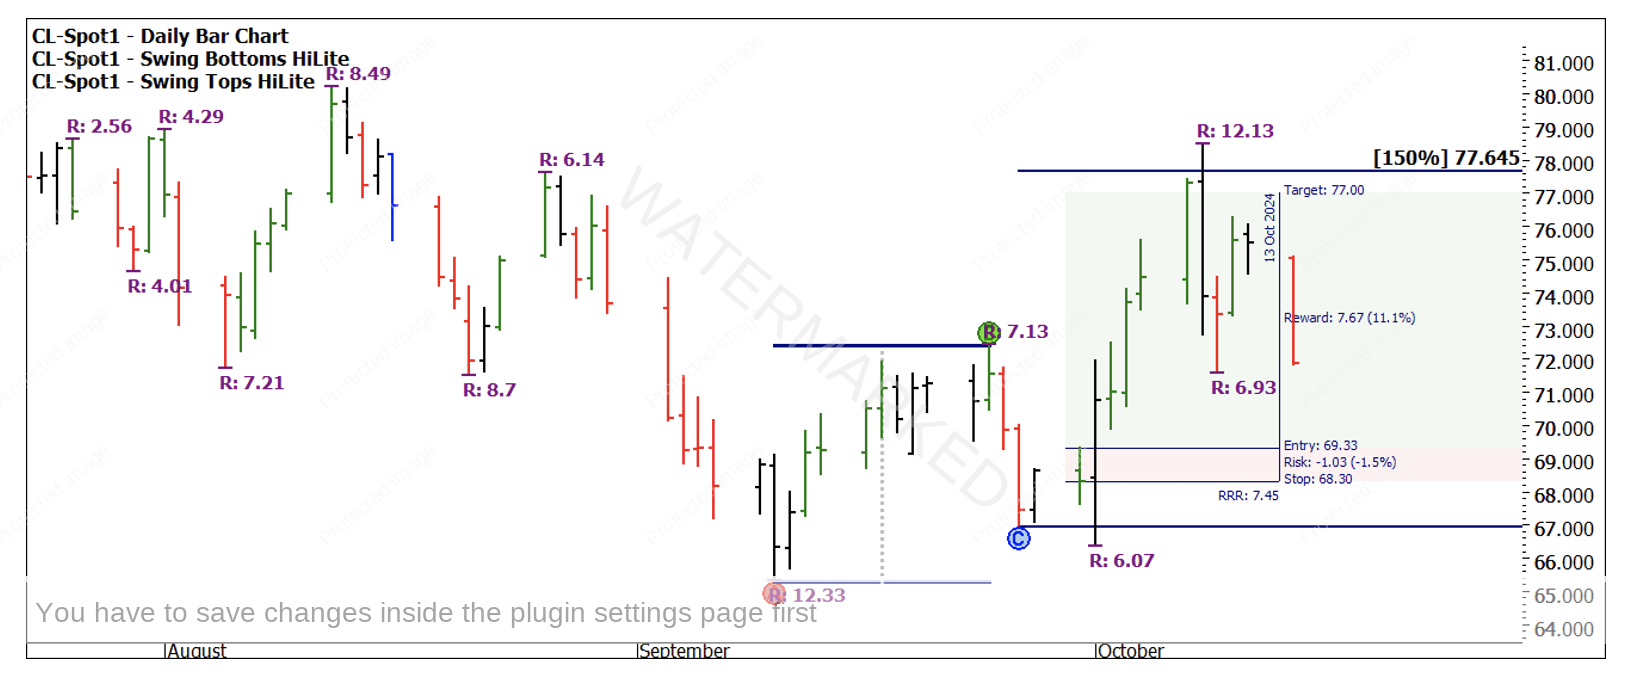
Chart 1 – Daily Bar Chart CL-Spot1
The move was relatively short and sharp and using the 150% point as the price target an approximately 7 to 1 Reward to Risk Ratio was achieved. There is a case where you may still be in, using a strategy of stops below swing bottoms. The volatility in the last week has been challenging, so being out may end up being the better outcome after this all washes through. If you identified the setup, regardless of how the volatility impacted you, the ability to identify areas for fast moving markets is a good skill to have.
As a side note, a possible alert for another setup would be if the price action at any stage returns to test the $65 level, we could legitimately tick that off as the fourth time it’s attempting to break through and we can refer to Gann’s discussion around breaking the 4th time.
Onto another market we have been discussing in 2024 which is Gold futures. Earlier this year we identified a price target of $2,715.90 as the 100% repeat of the previous major range that took 12 years to unfold.
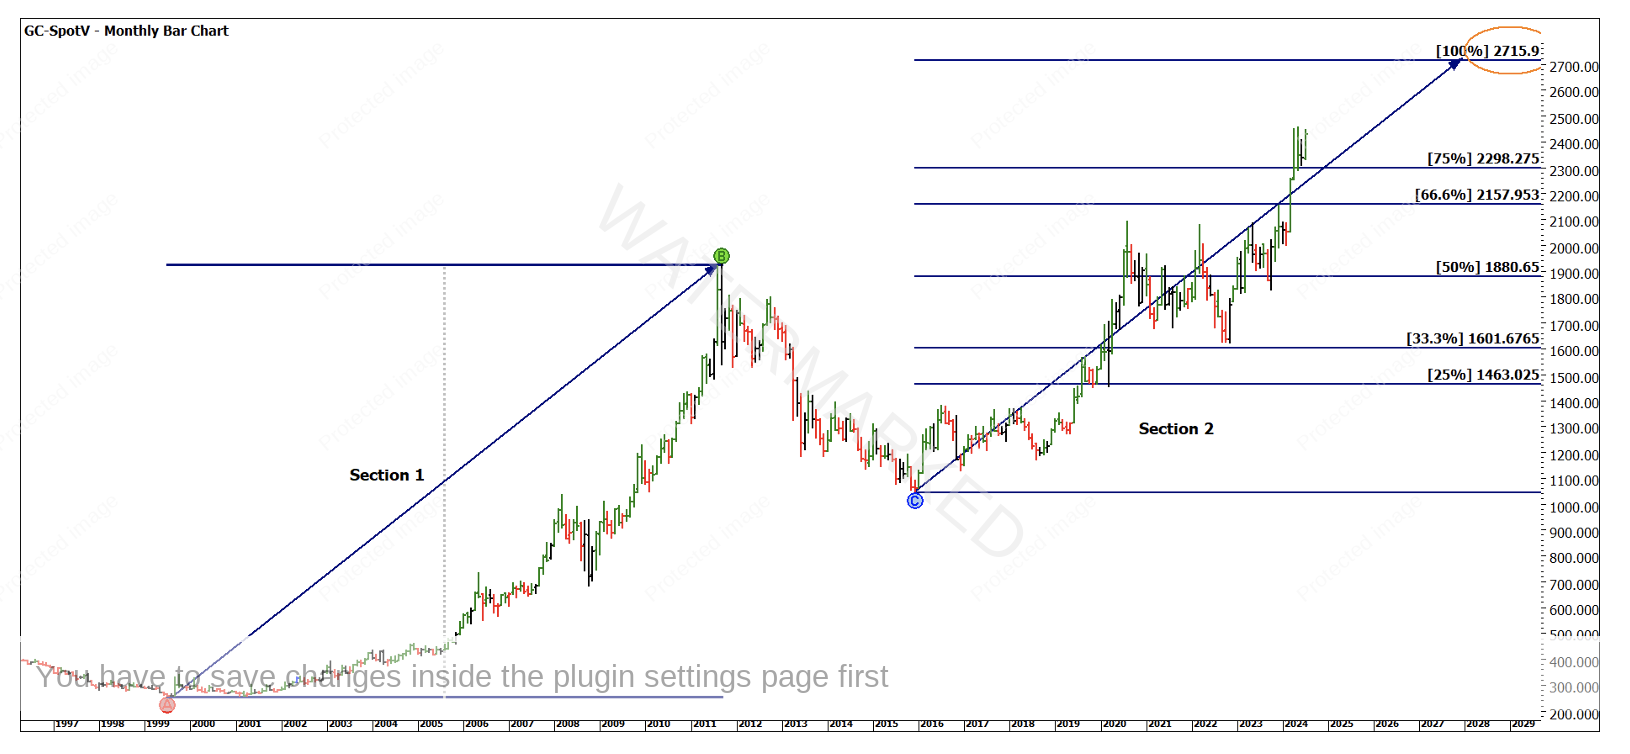
Chart 2 – Monthly Bar Chart GC-SpotV
Chart 3 shows the current price action for Gold as it has also made new all-time highs for the futures prices. Our target of $2,715.90 has not yet been touched with the closest price being achieved on September 26th at $2,708.70. I have included the 200% milestone of the most recent First Range Out and this gives us $2,719.30. Fair to say we are seeing a cluster here and of course there is more that can be overlayed with our other techniques.
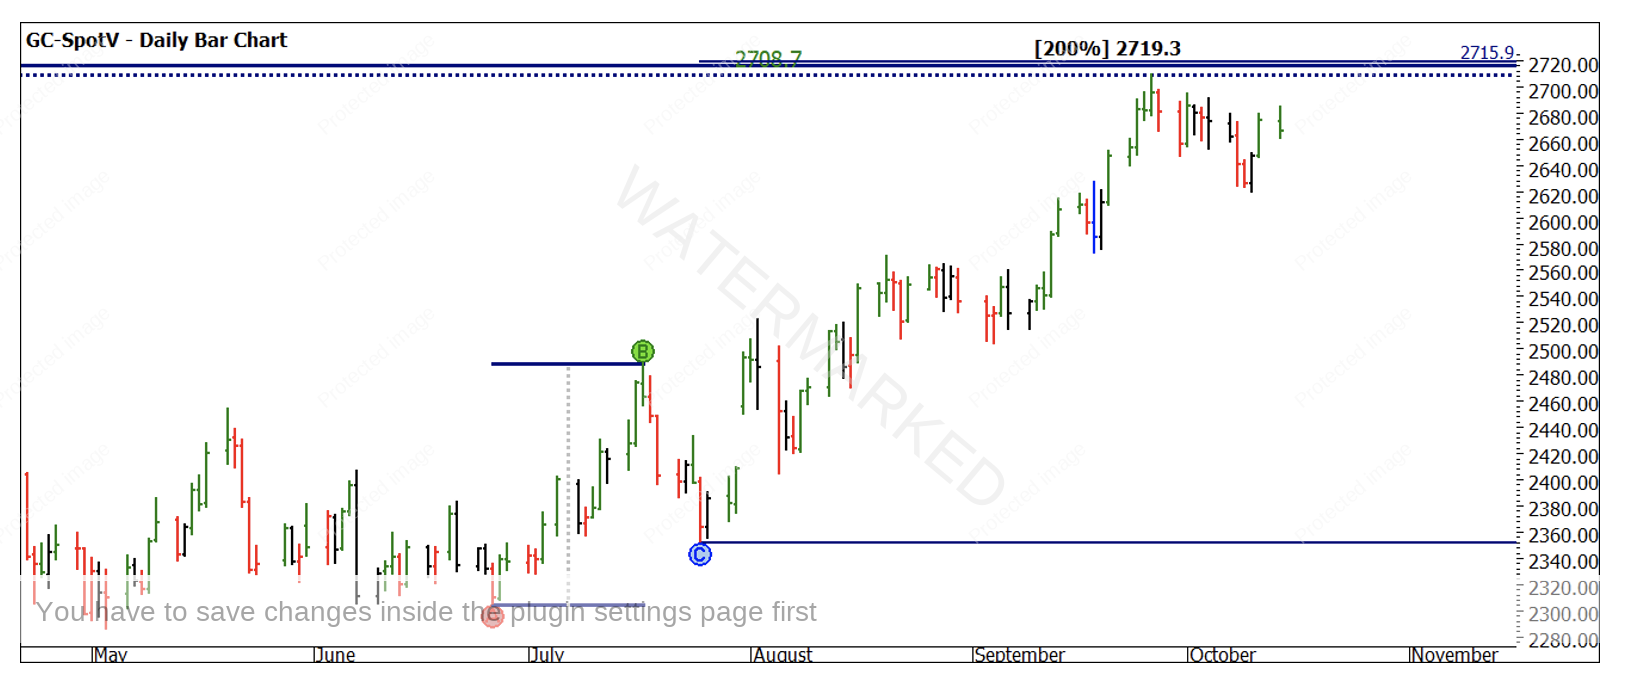
Chart 3– Daily Bar Chart GC-SpotV
I drag your attention back to the Platinum newsletter from July this year and the possible basic time projections we used to generate some dates. The first being September the 7th, and if you review the chart, our big price target was still some way off and the market generated no tradeable move of any significance.
The second of those time frames is the 22nd of October, which is in the next week or so. Ideally, we may see the price action retest our price point and if there was a small picture double top to add to the pattern, we might like to see that and we could be “off to the races” a week earlier than the Melbourne Cup.
It’s all about building a plan of action around what you would like to see and then adjusting to what occurs. The other scenario that I am contemplating is the 26 September top may be a high of some importance, and around our 22nd date we may see a lower top that does not deliver us a hit at $2,715.90. This is based upon looking at the complete history of Gold futures and identifying that it is often a lower top that delivers the best entries for shorts. If this develops, we can unlock this in next month’s discussion.
Until then, keep a close eye on markets. Develop some Price and then Time targets for those markets you are closely following and then be patient and watch to see what comes your way. Build a robust entry/exit and risk management process to ensure you are not just jumping in without a signal, and study previous patterns and areas of volatility to understand the small hints that markets drop to those who study.
Good Trading
Aaron Lynch