A Study of Ranges
I find it fascinating looking over previous great bull markets and seeing the ranges markets were making.
The best market for this analysis is the Dow Jones as it has over 100 years of data. Taking a look at the big picture analysis on a quarterly bar chart, it’s a good reminder of where the market has come from.
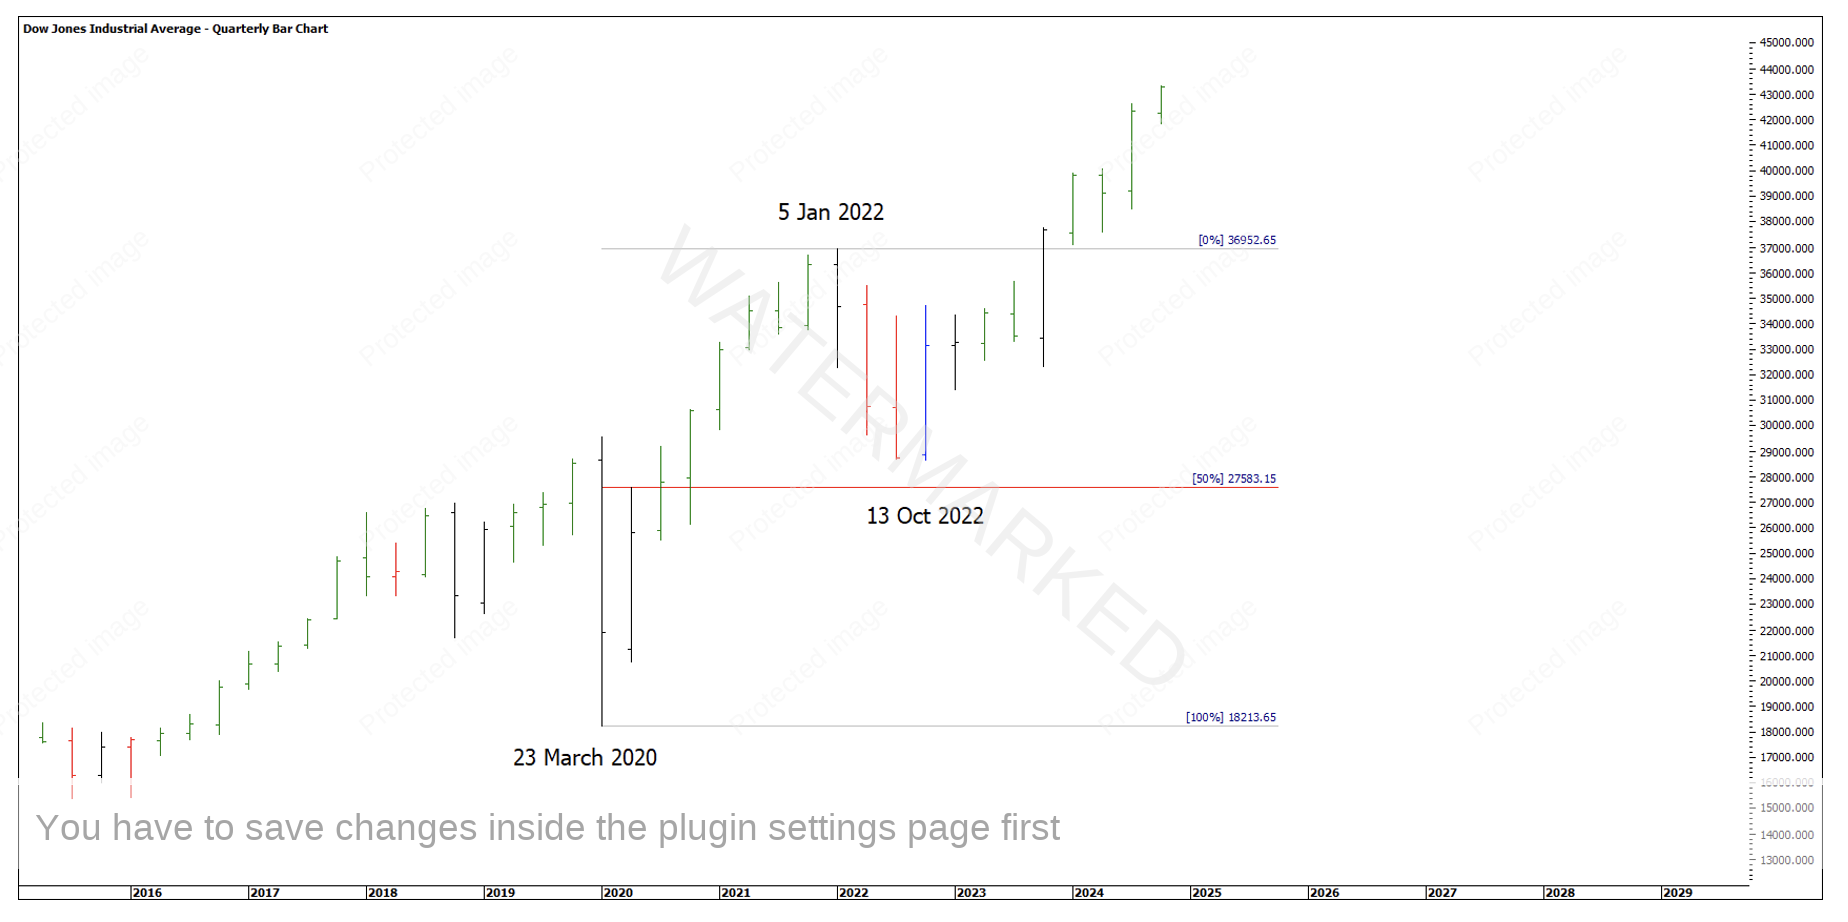
Chart 1 – Dow Jones
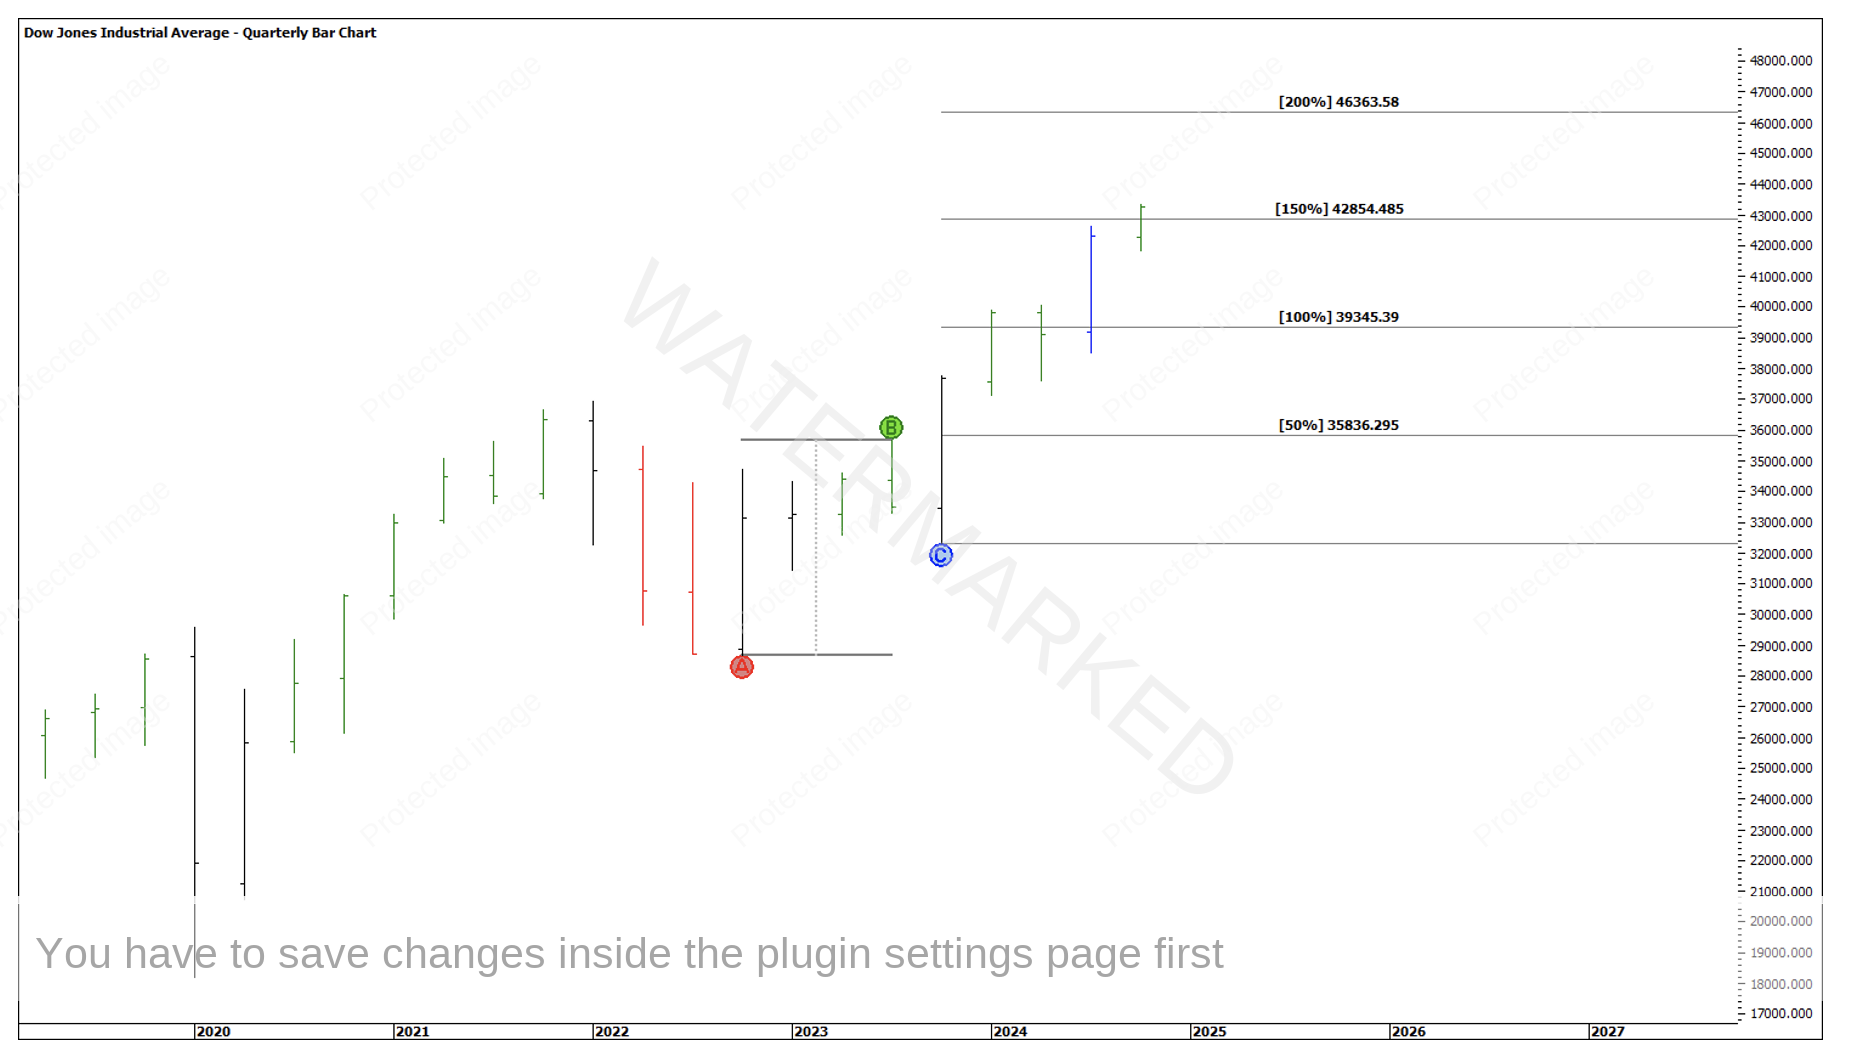
In the past 4 years we’ve witnessed the COVID crash followed by a doubling of prices into 5 January 2022. Then a retracement that was less than 50% into mid-October 2022.
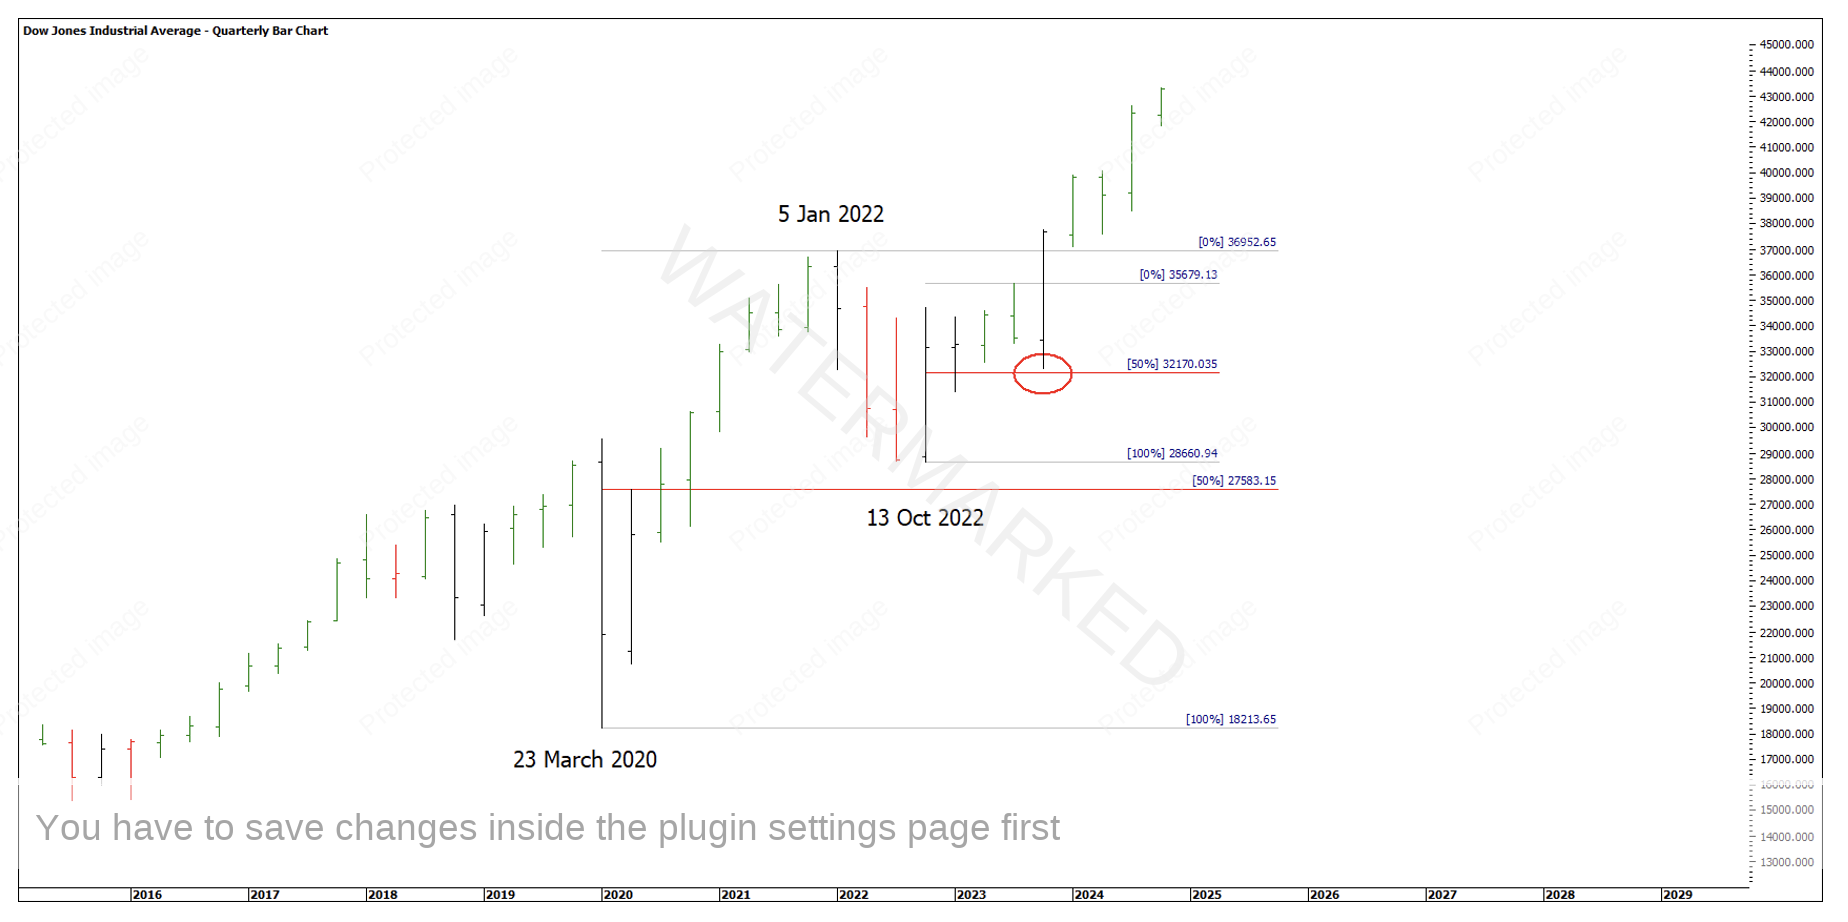
Since then, the market has been long and strong and managing only to put in a quarterly outside bar that confirmed a First Higher Bottom.
Chart 2 – Quarterly Outside Bar
These Outside Continuation bars often occur during strong moves in the markets, meaning you see it more often when the market is in a sideways holding pattern.
Some testing results from another market brought my attention to the extents of the First Range Out when created by an outside swing or normal swing pull back. I found the outside bar swings often have the tendency to put in bigger swing ranges than the normal swing. I also found that shallow pull backs of 33%-37.5% often then showed a contracting second range up, followed by an expanding range down then more upside.
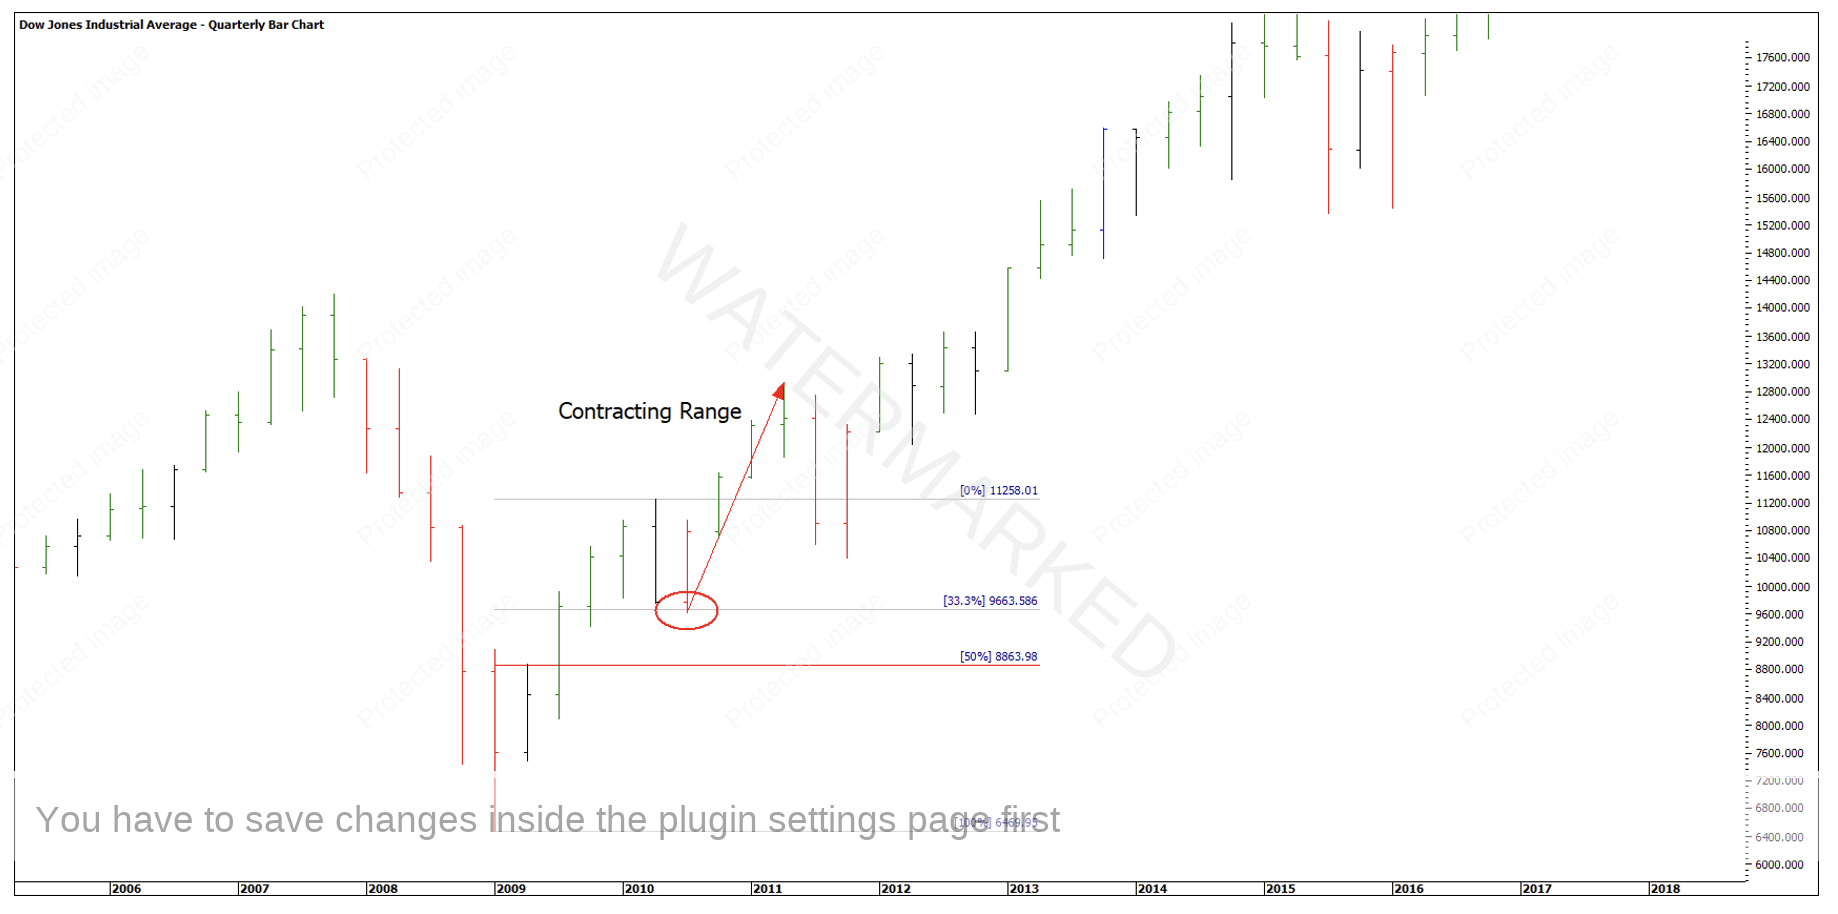
Some previous examples to study can be seen out of the GFC low back in 2009. The quarterly First Range Out swing came in on a 33.3% retracement. The next quarterly swing up was a contracting range followed by two quarterly bars down and an expanding range down before the market took off again.
Chart 3 – Quarterly First Range Out
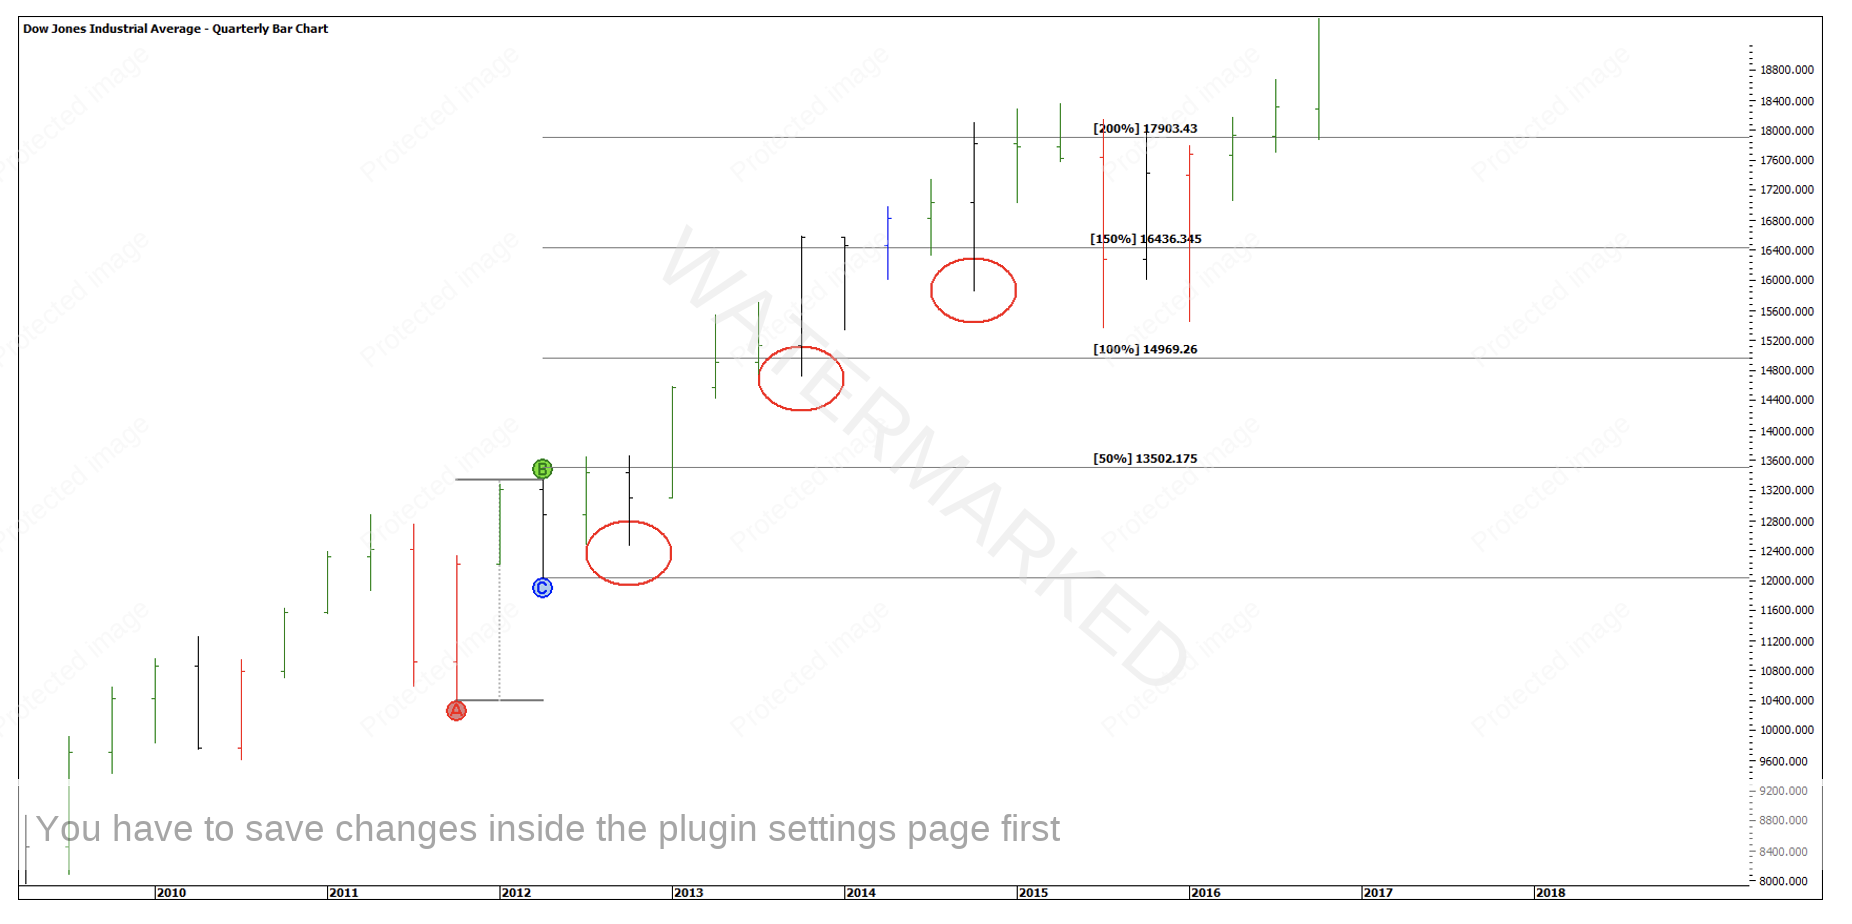
The next 14 quarters up into mid 2015, showed pull backs that are only outside reversals and continuation quarter bars producing nothing but higher swing bottoms.
In Chart 4 below you can see the market ran to 200% of the swing created by the outside bar before making a reasonable top.
Chart 4 – 200% First Range Out
You can go back and study other times when the market really gets going and how far they can run. Currently the Dow sits above the 150% milestone of the First Range Out caused by the outside quarter and well into All-Time Highs.
Chart 5 – Current Dow Jones
A couple of things I will keep an eye on are shallow quarterly pullbacks and Outside Continuation swings giving more potential buying opportunities.
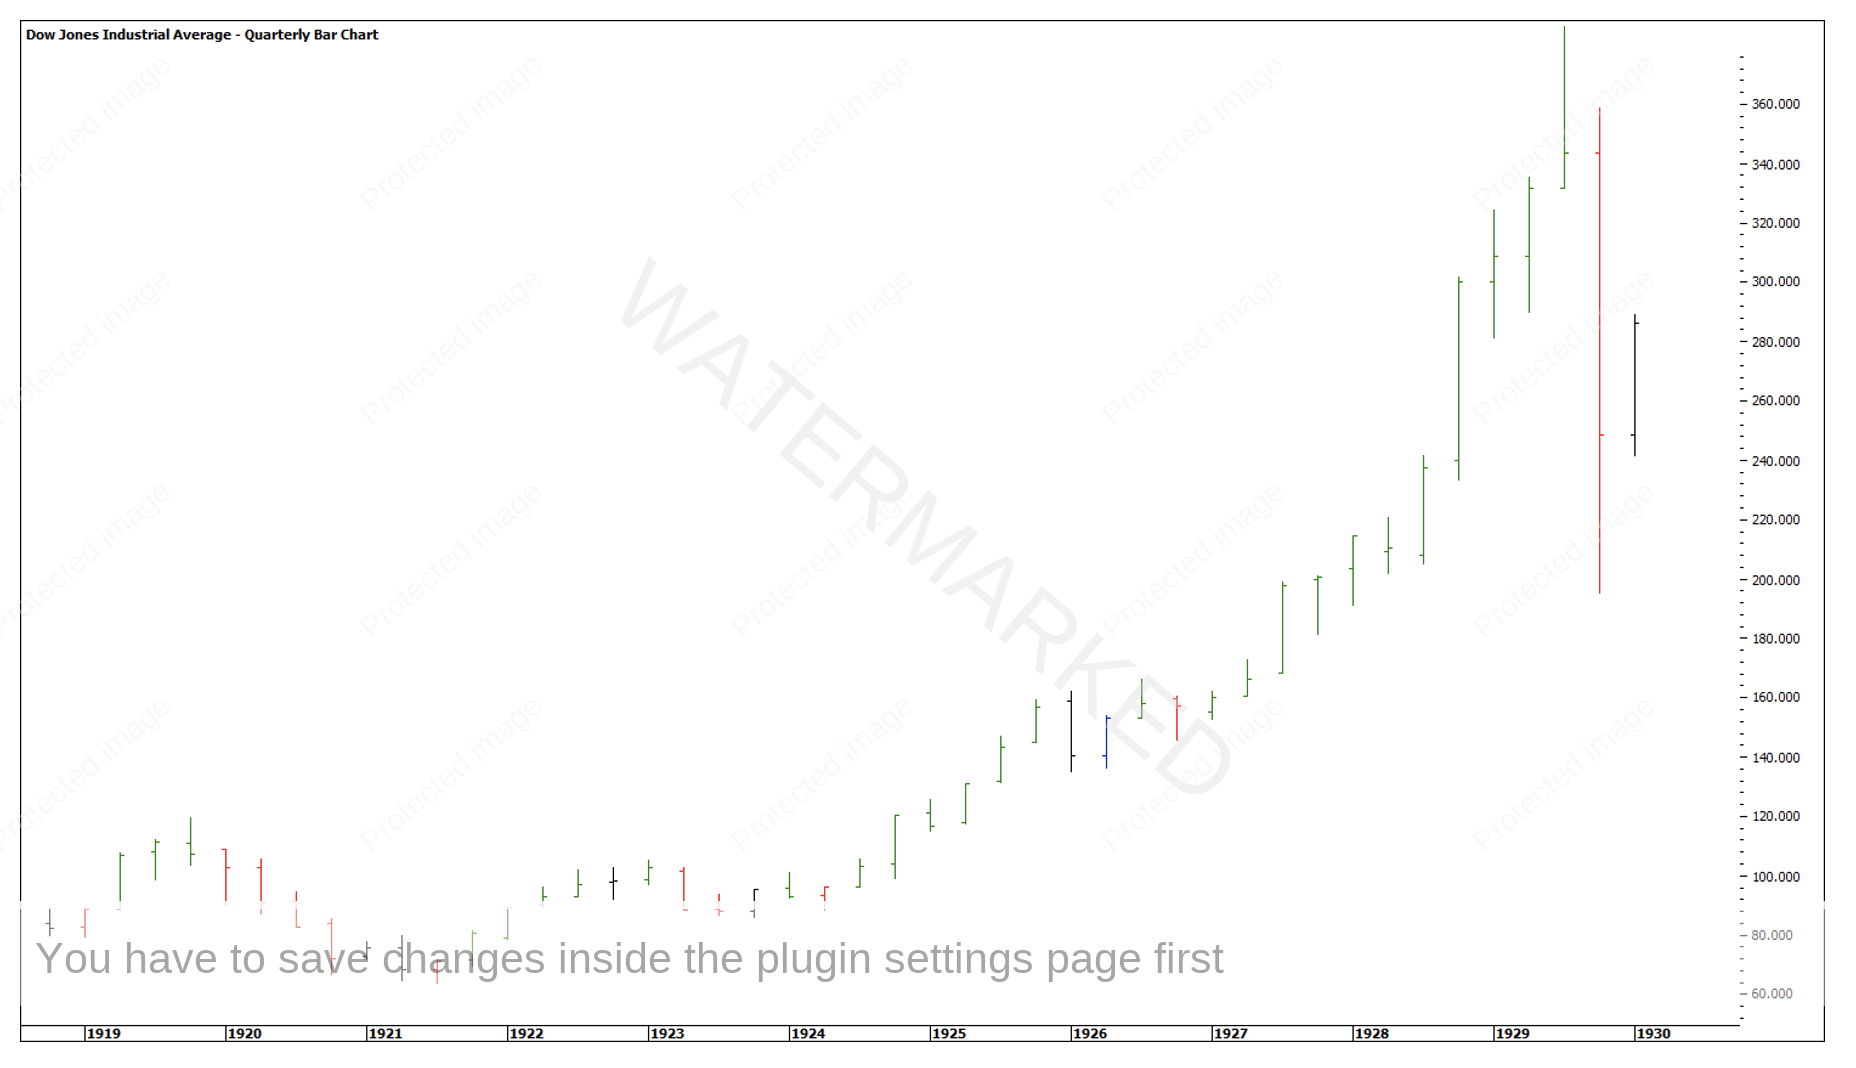
Looking over the history of the Dow Jones and a comparison to 100 years ago, it shows how strong the market can get especially towards the end of the move!
Chart 6 – Dow Jones 1920’s
Having been around long enough to witness a number of big bull markets, I’m well aware of the narrative when the market is in the last run to the top. When it’s quiet or even bearish talk there’s a high chance that the market has plenty more upside.
On the contrary when you start to hear things like, “the market is too big to fail” or“the market is going to 500,000”, this is usually a sign that things are about to come to an end, and in a drastic way!
Happy Trading
Gus Hingeley
