Wheat – Current Market
This month’s article takes a look at the current position of the wheat futures market. It engages simple but important techniques from the Smarter Starter Pack and Number One Trading Plan manuals and encourages the reader to develop their own sentiment (bullish or bearish or neither) prior to the unfolding of a trade.
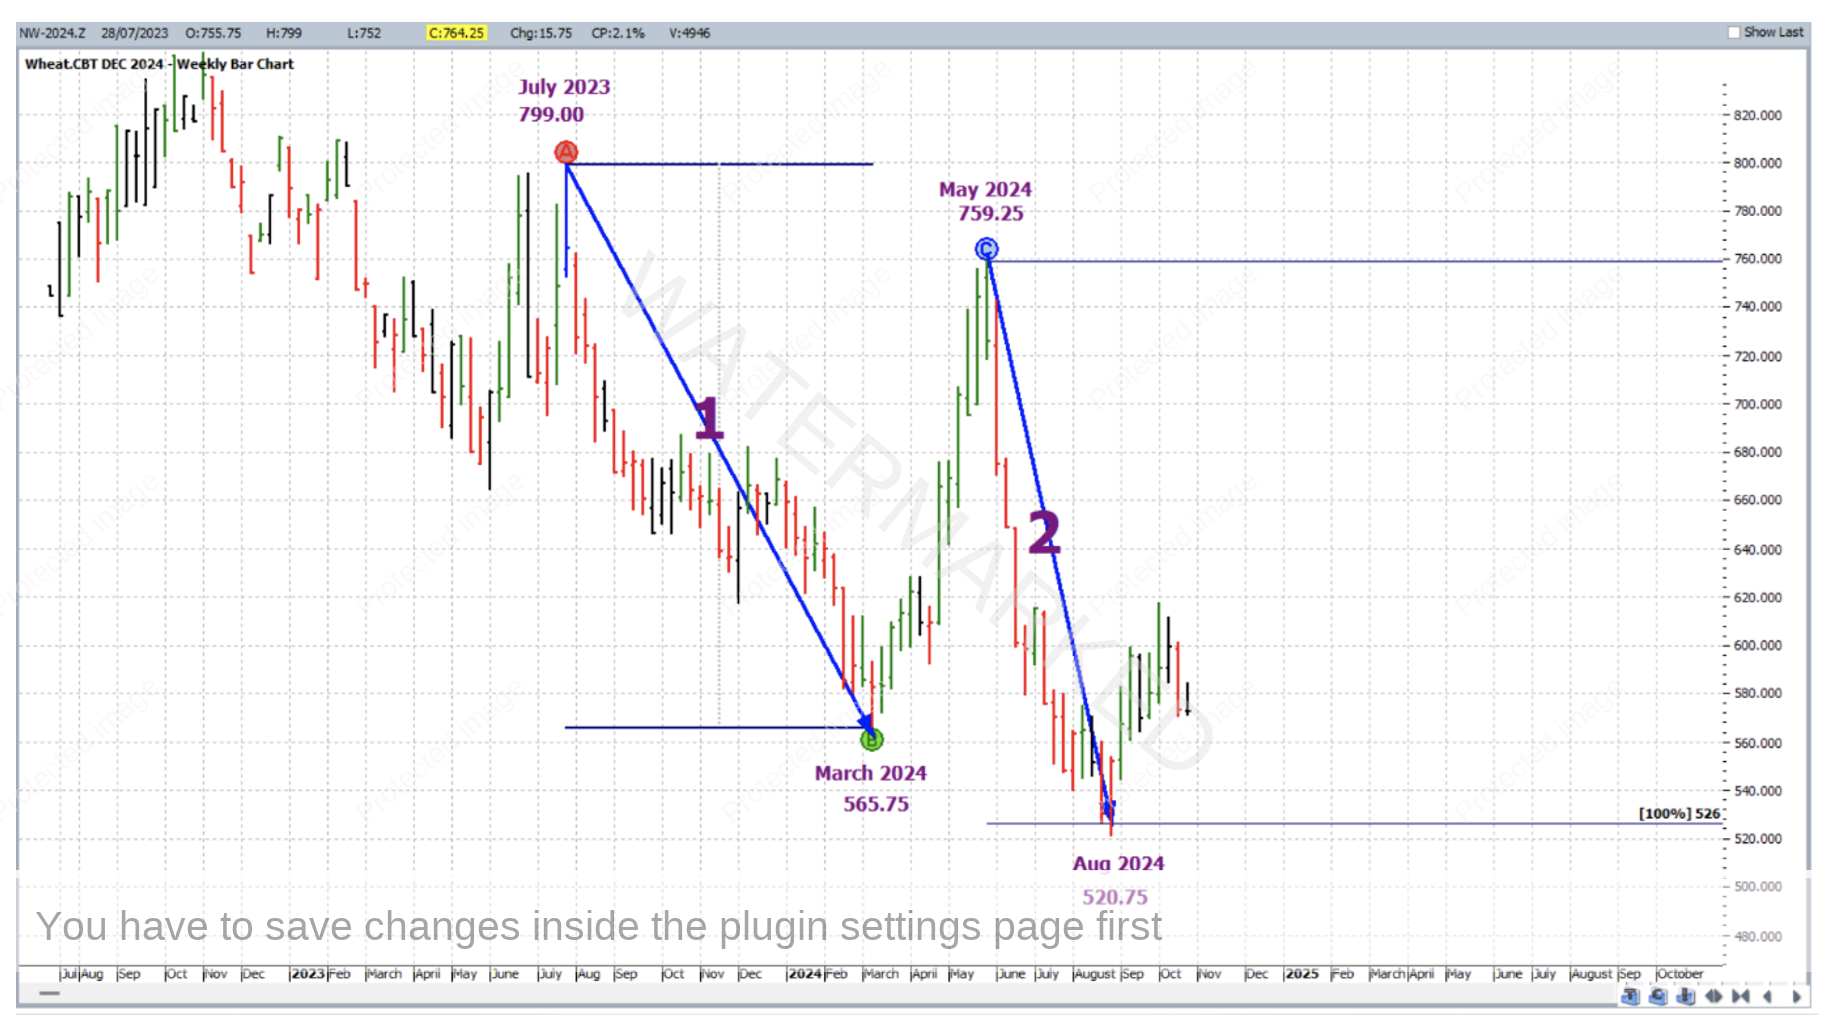
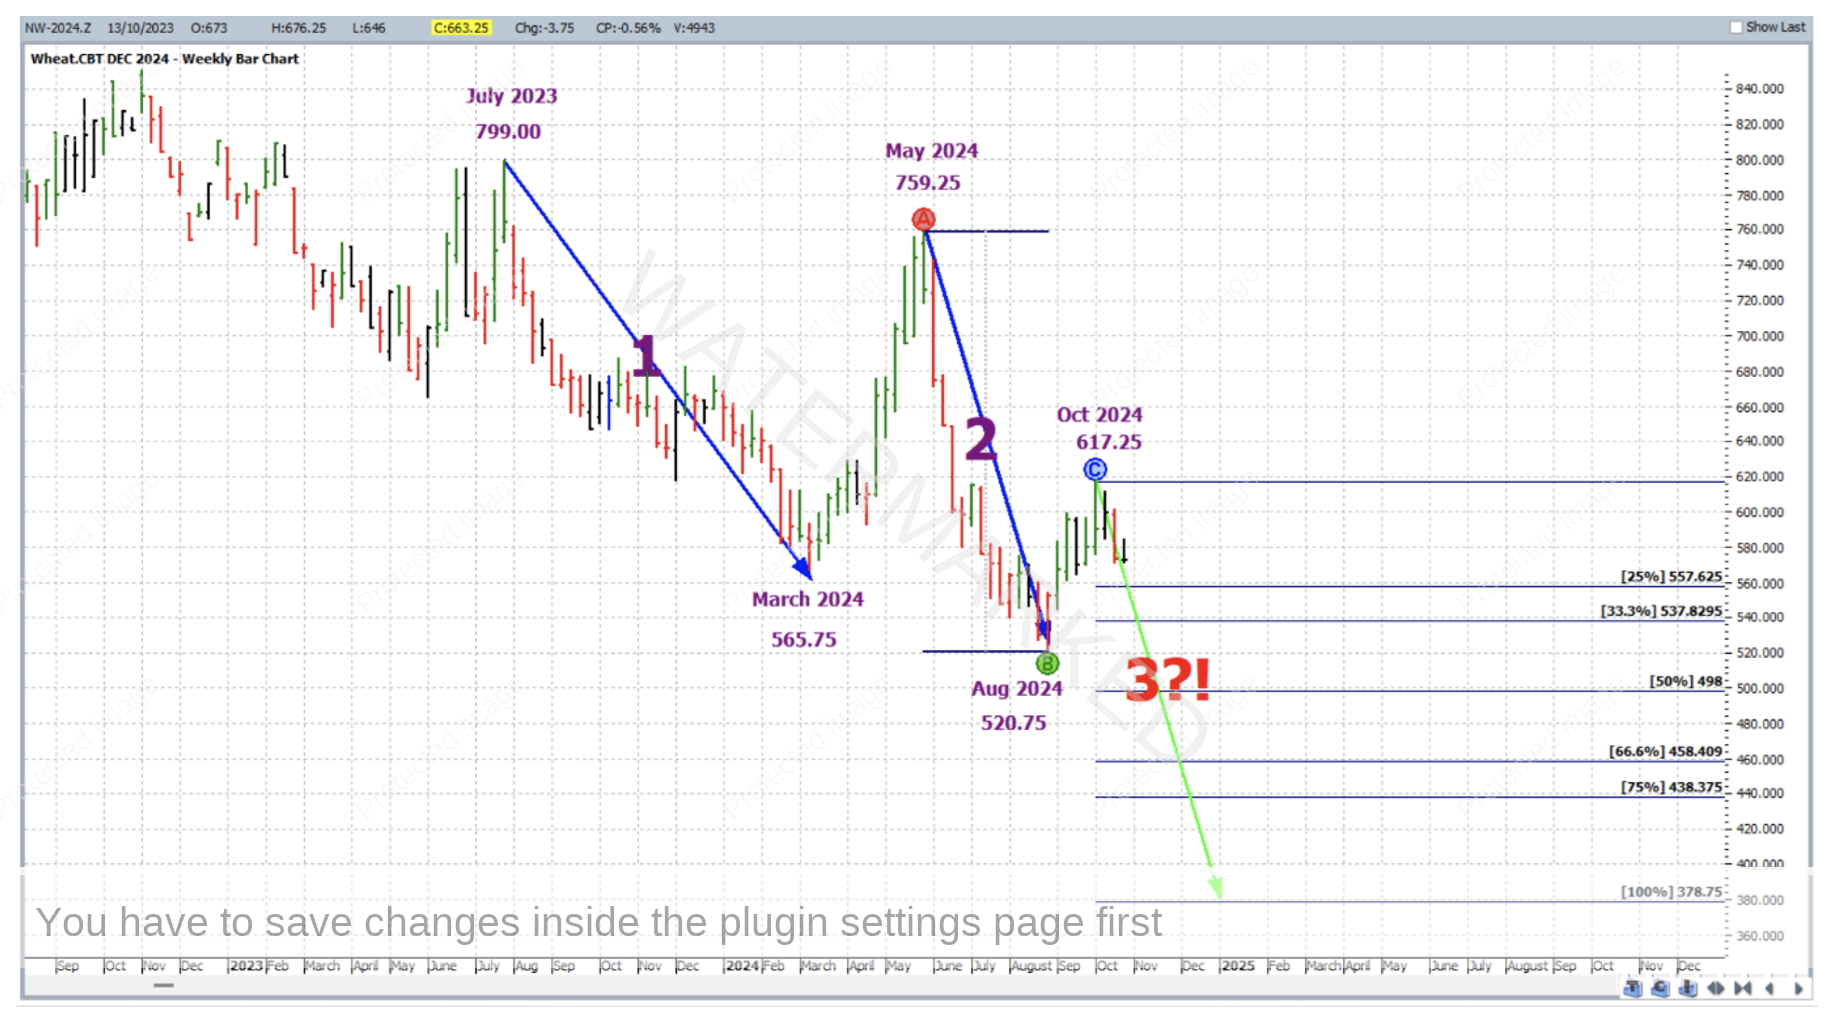
Below is the individual contract chart of the December 2024 Wheat futures contract, symbol NW-2024.Z in ProfitSource. With this bar chart at weekly resolution, it can be seen that two sections down have unfolded since the contract’s July 2023 top of 799 US cents per bushel. A little sideways at times, but definitely there were some opportunities for the savvy and prepared bear.
The ABC Pressure Points Tool is applied and illustrates that the second section was close to an exact repeat of the first. The August 2024 low at 520.75, only false broke the 100% milestone by roughly 5 cents. Gann behaviour as such is more likely in a market when it’s in motion!
Well and good, but do we have a case for another top and hence the unfolding of a 3rd section down? Gann did say that market action tends to unfold in 3 sections.
Before that, let’s go into more detailed analysis about the current position of this market – by the way continuing to analyse the same contract and its chart, based on its own merit.
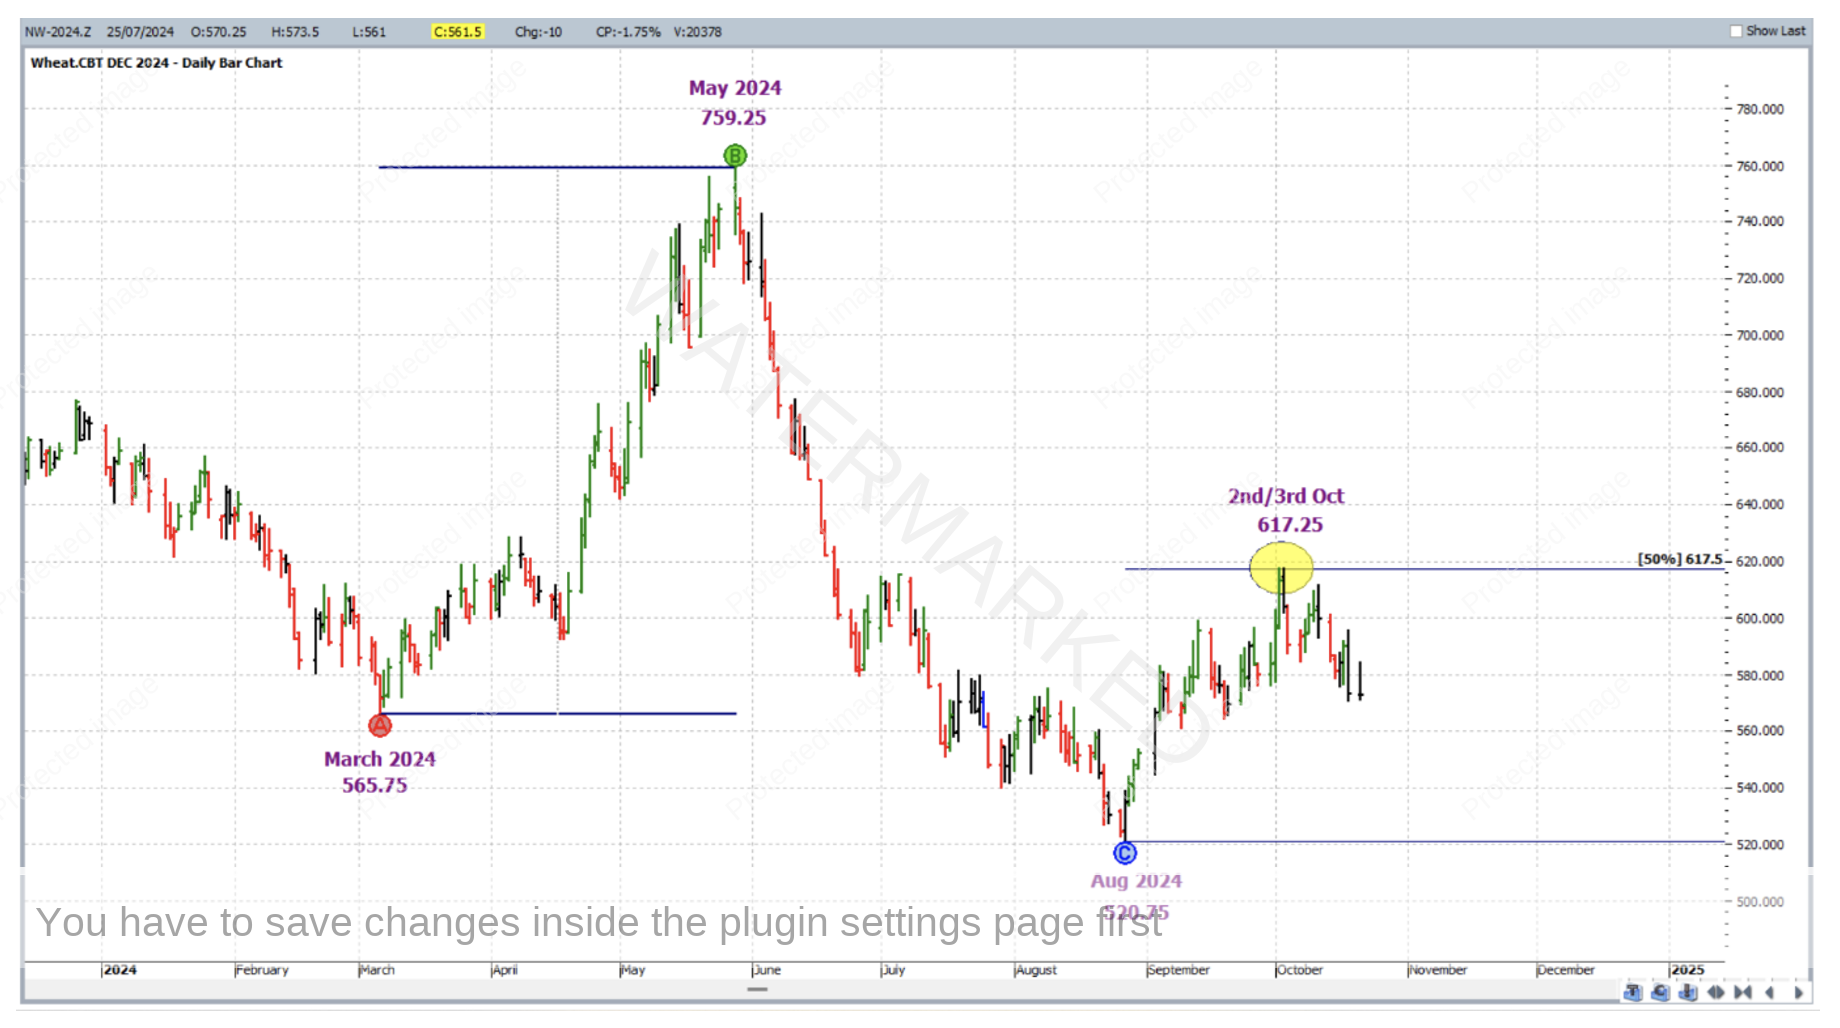
Zooming in this time the ABC Pressure Points Tool is applied to the same chart as follows:
Point A: March 2024 low 565.75
Point B: May 2024 high 759.25
Point C: August 2024 low 520.75
The 50% milestone of this application is 617.50, and the current early October top is only one point away from that (point size being 0.25) at 617.25 – two small picture, but exact double tops at this price on 2 October 2024 and 3 October 2024.
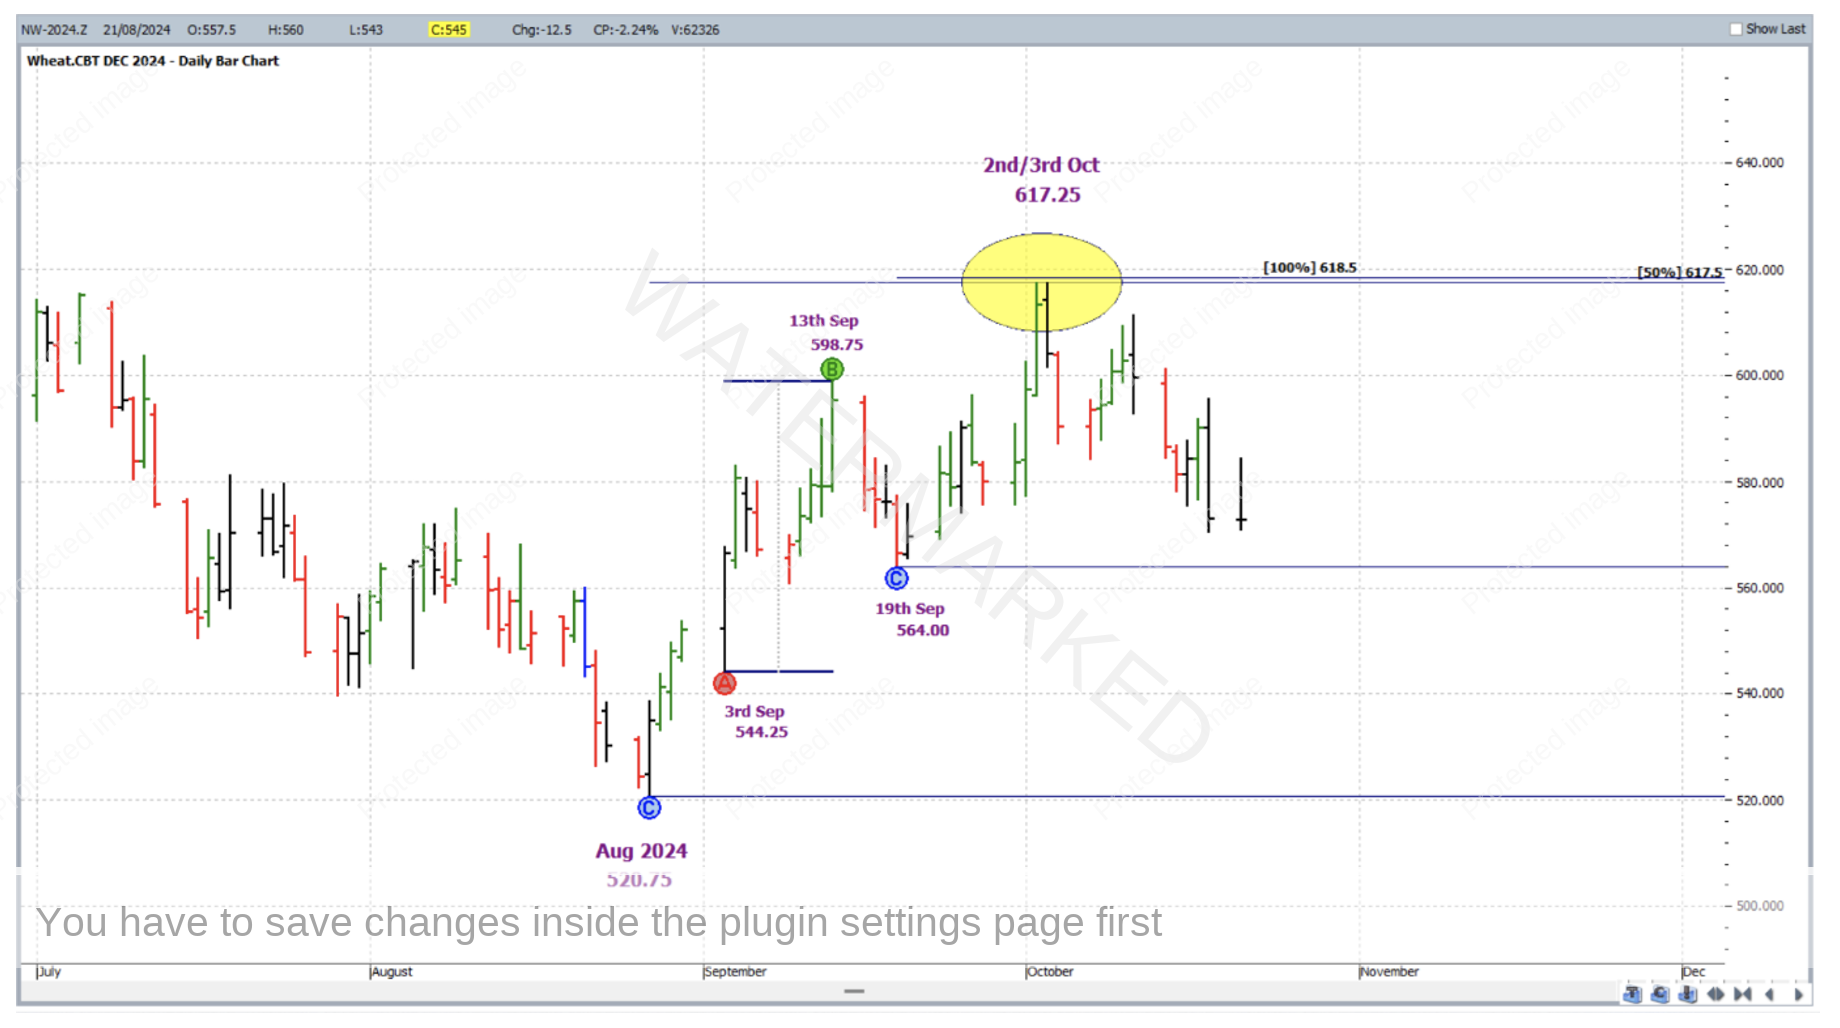
Zooming in further to the run up from the August low, a smaller picture application of the ABC Pressure Points Tool is as follows:
Point A: 3 September 2024 low 544.25
Point B: 13 September 2024 high 598.75
Point C: 19 September 2024 low 564.00
The 100% milestone of this ABC application is 618.50, clustering tightly with the two small double tops and bigger picture ABC milestone as shown above.
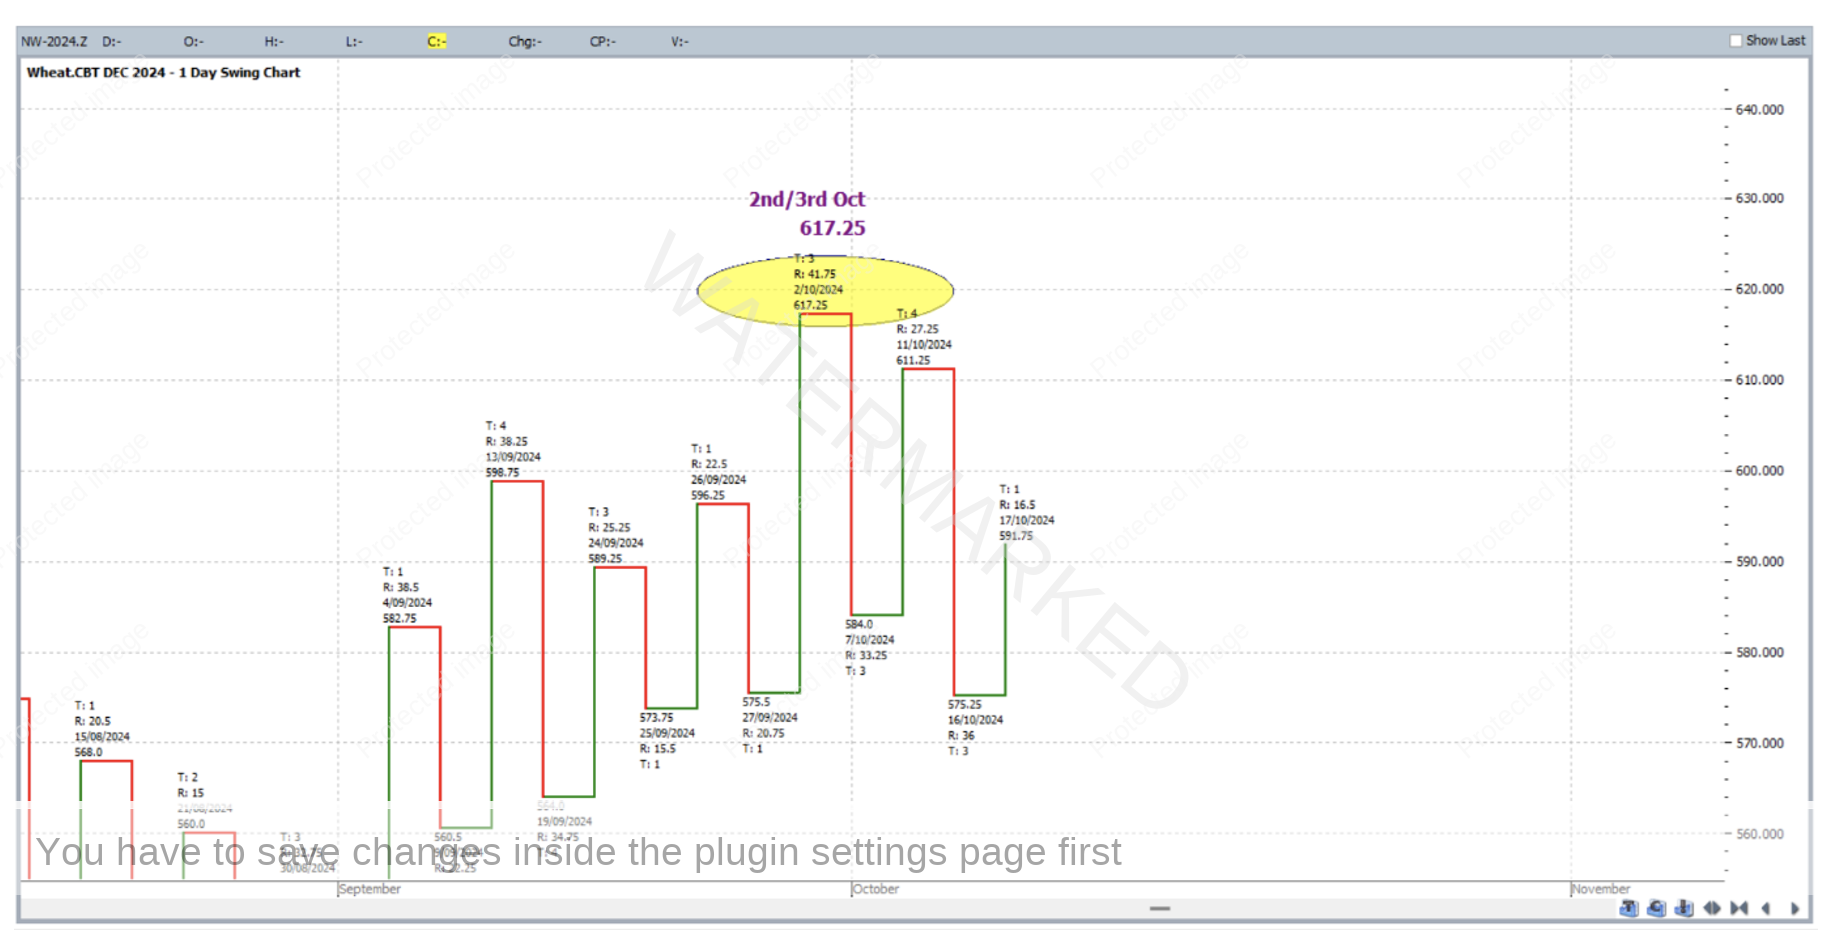
What about the swing chart? The daily swing chart is shown below – current trend is down, with lower tops and lower bottoms out of the early October top – is this an early sign that the bears are back in control, further adding to the case for the early October top?
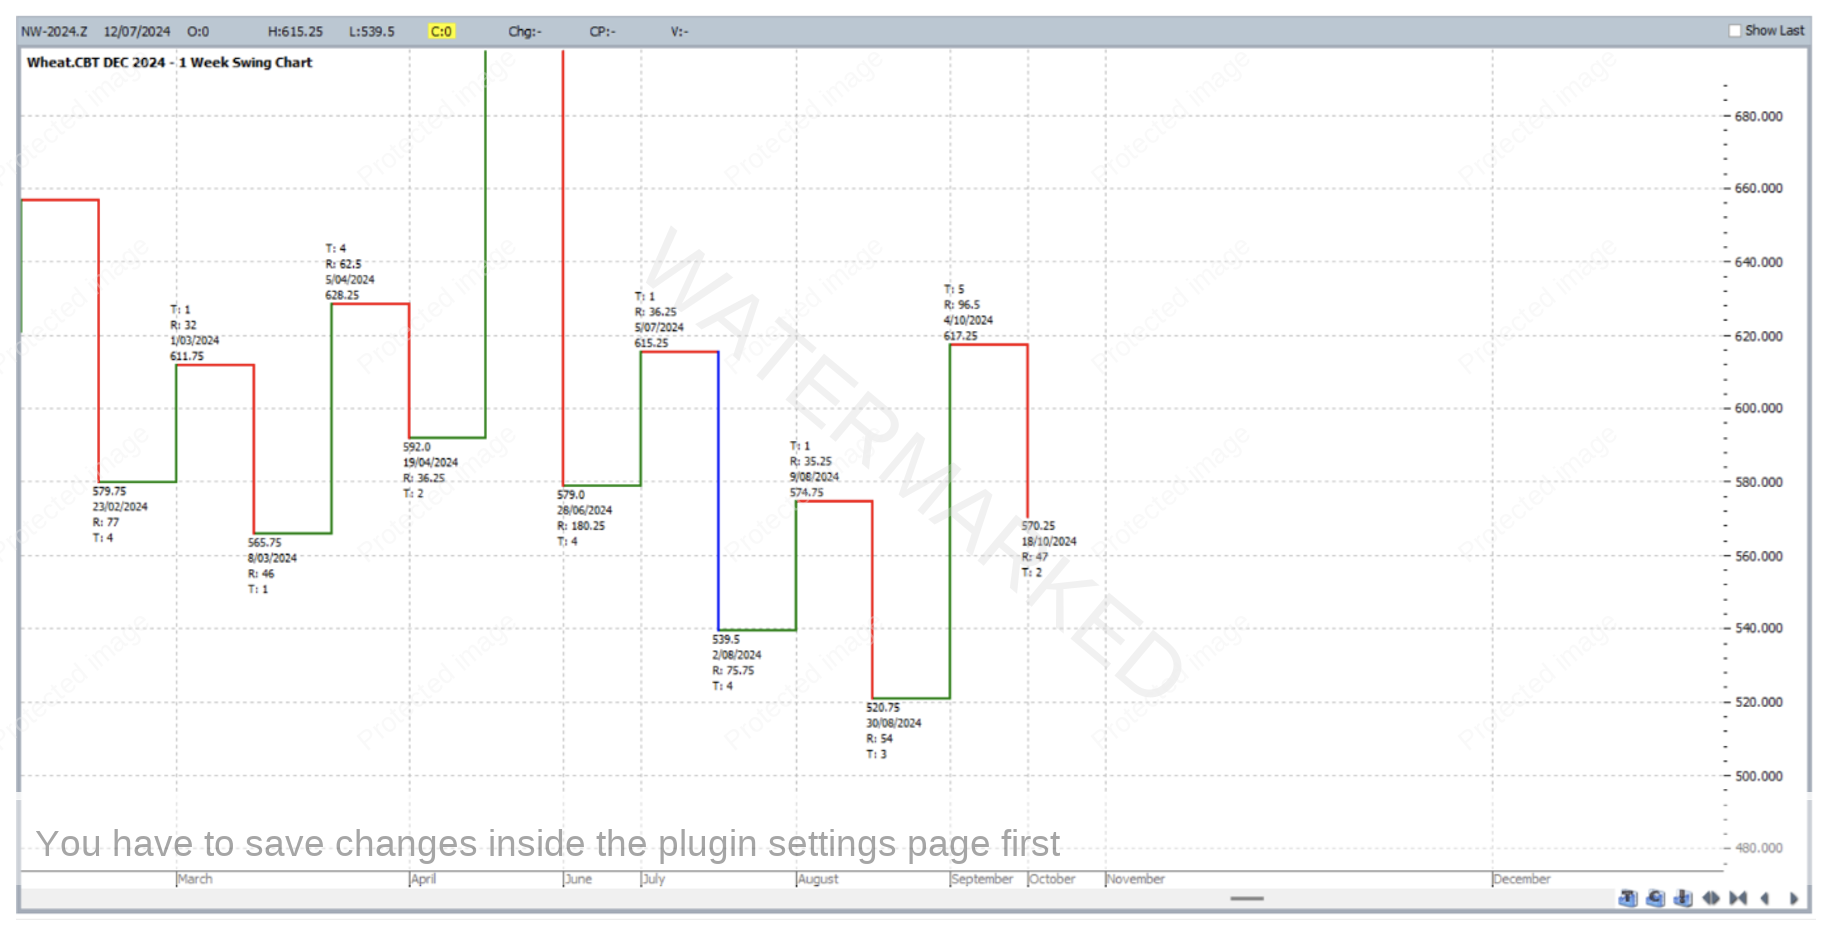
The weekly swing chart says otherwise currently – trend uncertain with a higher top and a lower bottom. The expanding upswing (96.50 compared to 35.25) and contracting downswing (54.00 compared to 75.75) offer more sentiment to the bulls.
That being said, if there are some bears sniffing around owed to the early analysis in this article, they’re always first evidenced by the daily swing chart. If a major 3rd section down is to unfold, a lower weekly top could still be tradeable within the spring time of the trade.
If you’ve missed a major top, there are still price clusters to be found in a market at its swing tops on the way down.
Work hard, work smart.
Andrew Baraniak
