All That Glitters
The saying all that glitters is not gold is a rule of thumb for life and of course in trading. The global glitter of elections and geopolitical risk has moved to the next one in line, as markets come to digest a change in administration in the US come January next year. Markets saw this as a positive for asset classes like Crypto and saw the US Dollar Index surge through October and now November. Remember that a strong US Dollar places pressures on commodity prices and it’s not surprising that Oil and Gold have weakened in recent weeks.
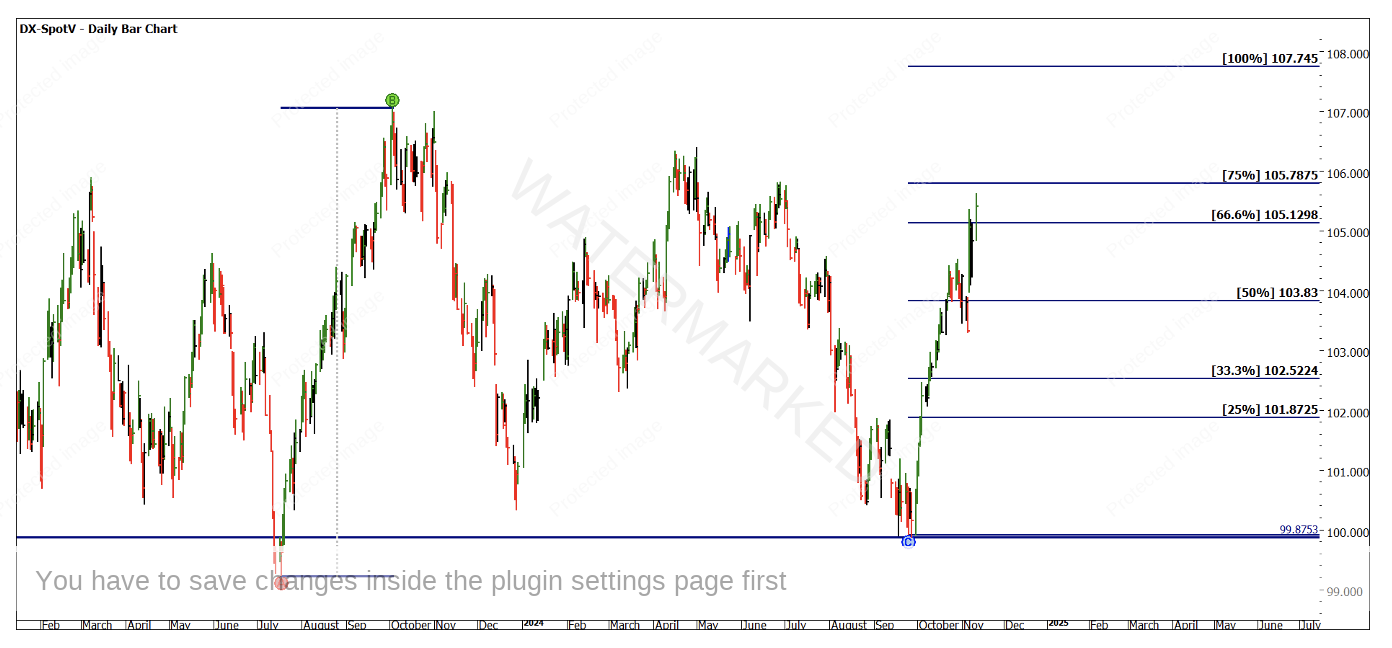
Chart 1 shows the US Dollar Index and its rally off support around the September seasonal date. Based on previous moves this rally is strong, and we should watch keenly to see if the previous tops and resistance can slow down this movement.
Chart 1 – Daily Bar Chart DX-SpotV
Gold has been a market I have written about numerous times in 2024, and the simple reason has been linked to large cycles coming into play. We can monitor them and adjust our thinking as markets either confirm or refute what we are looking to see. There is one main challenge when using large cycles, which is that they can take many years of patience to deliver. If you review the discussions this year, I have been assessing the use of the number 144 on Gold and then applying it to a time frame of months.
The month of October was the area I was watching for this cycle to complete, the challenge is that a month is a long window when looking at the daily chart but a 1-month error over 144 is only a small percentage error. In previous articles the $2,715 level was a price target that was blown through, and a loose date was around the 22nd of October. This date was using some very basic repeating time frames and was never the basis of a “forecast” more so a marker we can place down and then fit other analysis around it.
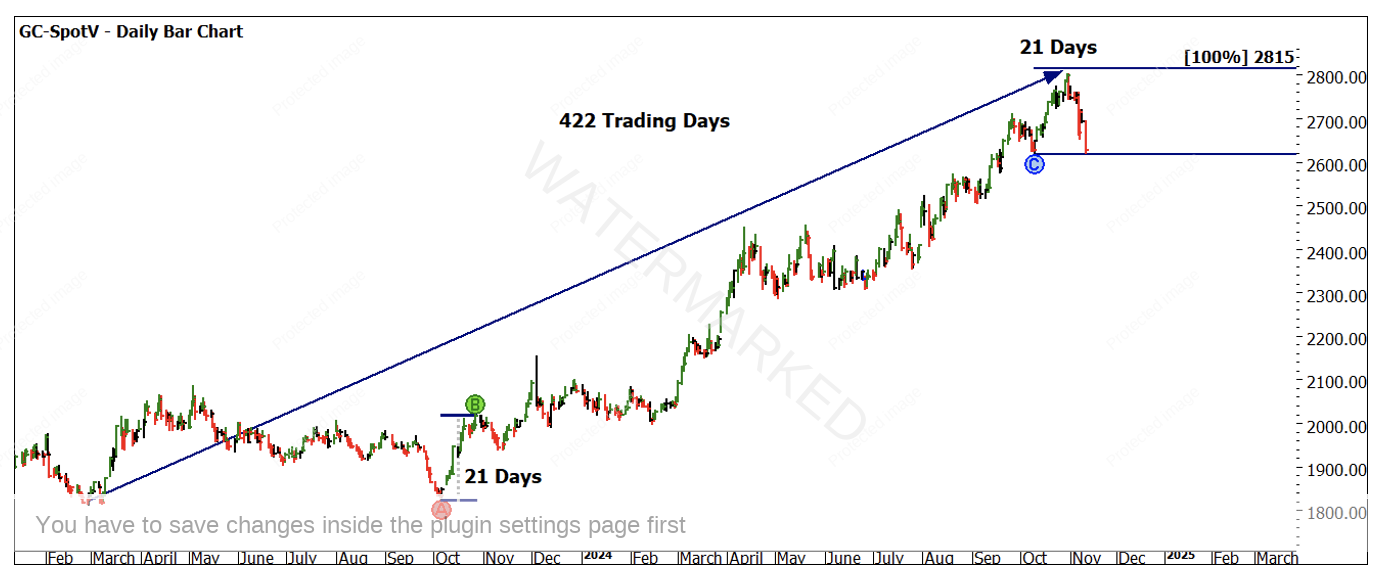
The recent market action has confirmed a current top (also All-Time High at $2,801.80). Of note are the 3 times frames I discussed in August, using the 422-time frame (that this market gave us) and applying it backwards in trading days we see the lows in 2022 have some harmony around them. I also like to see the First Range Out offering some harmonies at the end of a move and whilst the 100% in price was short, the timing of the first and last range were both 21 days.
Chart 2 – Daily Bar Chart GC-SpotV
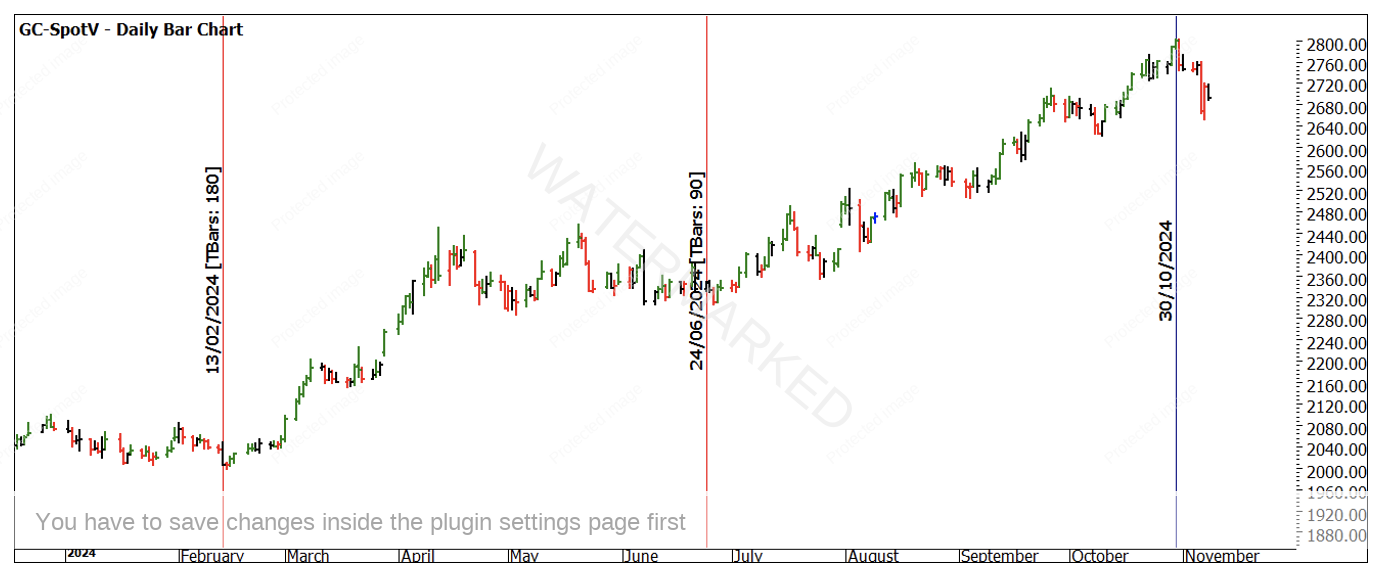
Chart 3 also allows us to use trading day counts to align some harmonies. This can be used as forward looking but more so a confirmation or zero date tool to work backwards when you are looking to confirm a potential turn.
Chart 3 – Daily Bar Chart GC-SpotV
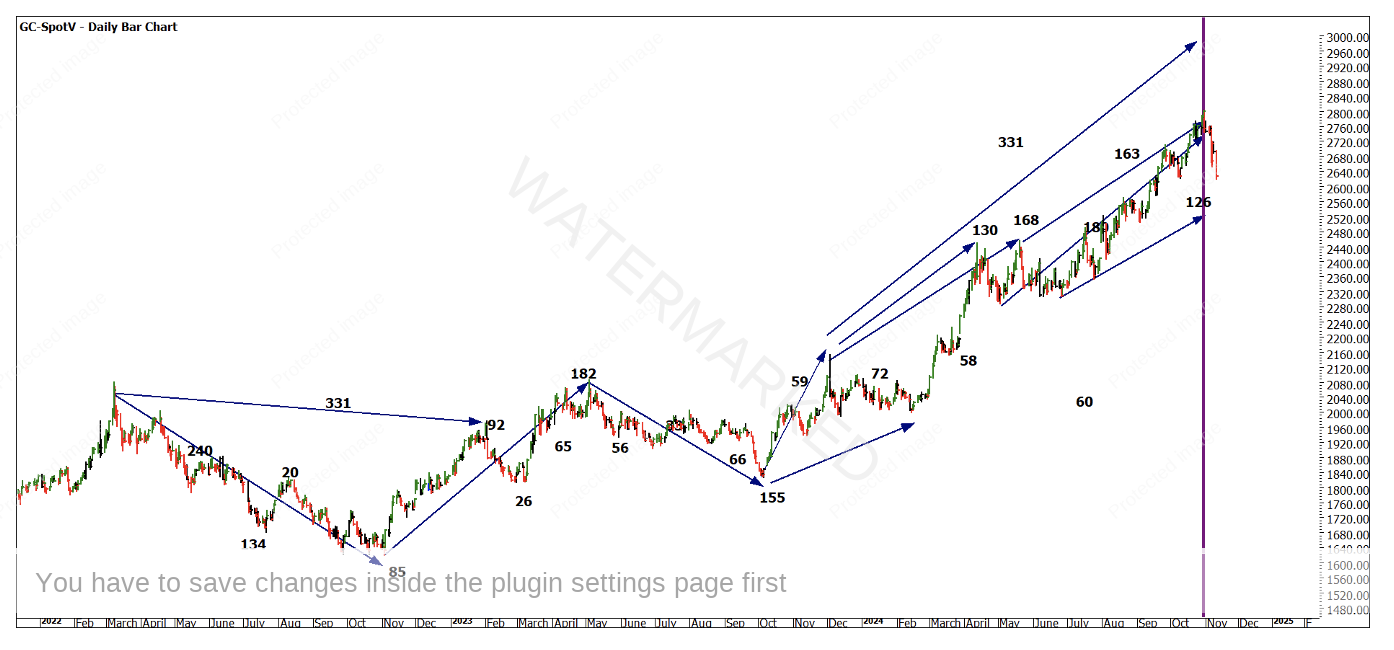
Chart 4 is quite messy and not one that I would normally use for analysis, it contains a lot of information in terms of day counts but I wanted to include all the numbers I have been tracking to look for repetition. This allows me to push forward or backwards zones to watch as they start to lock into place. Keep in mind we started using 144 months or 12 years as a primary cycle, we must be flexible with individual dates as the market vibrates.
You should open a chart and isolate one of these time frames and measure / test where you can see its repetition. Then we can overlay to see how they align with the current top.
Chart 4 – Daily Bar Chart GC-SpotV
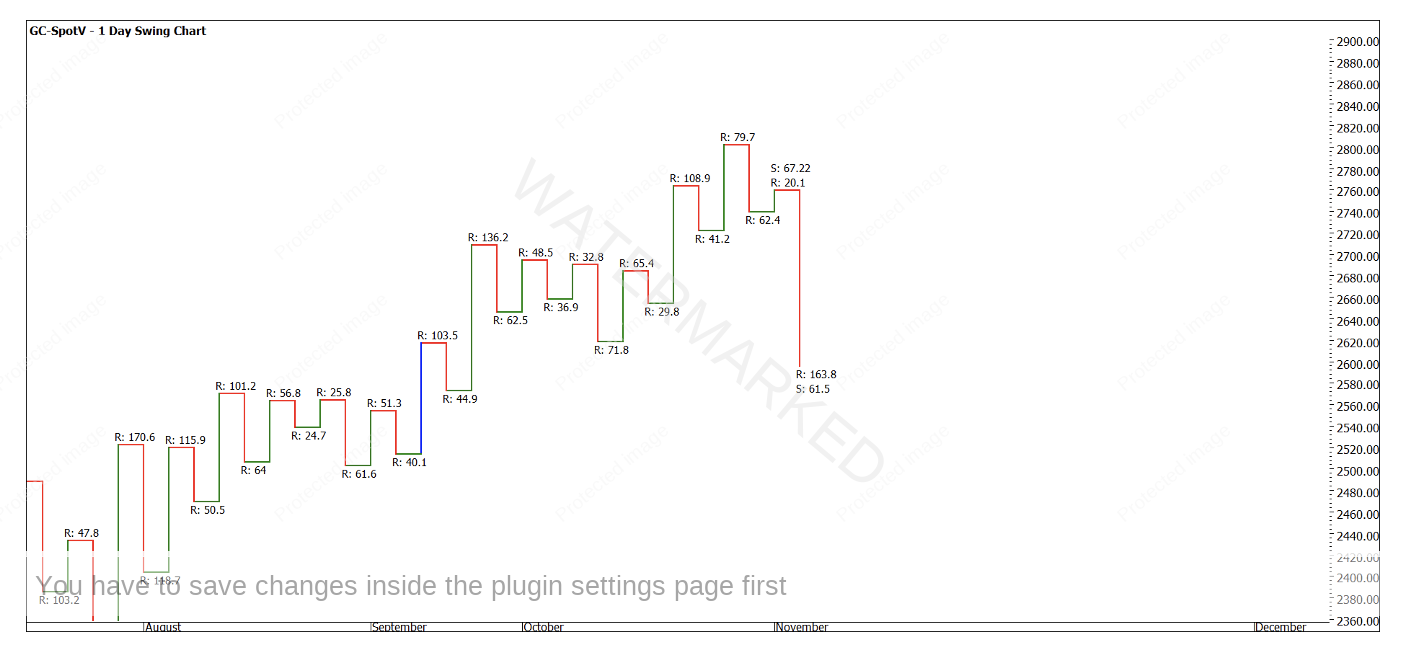
Currently we see Gold trading back under $2,600USD an ounce as I am compiling this article. We are not yet able to say with certainty that the current high is anything other than a pause in the existing trend. If an entry on the short side was desired, there has only been a turn down on the 1-day swing chart with the assistance of an outside day, however, we have seen an approximately $200 move south from the highs.
An intra-day entry was possible using breaking bar chart lows or another strategy was possible using a 50% retracement, again this needed some intraday data and a willingness to keep close to the market. More on that next month.
Chart 5 – Monthly Bar Chart GC-SpotV
Time will tell what the long-term outcome is for precious metals and in particular Gold. I look forward to discussing this next month, we should be able to confirm more clearly if a high has come in on Gold at least for the near term.
Good Trading
Aaron Lynch
