Post US Election
With the US election now decided, whether you like Donald J. Trump or not, he is president number 47 and only the second president in history to serve two non-consecutive terms in office, with Grover Cleveland being the first.
Truth of the Stock Tape has some interesting sections under the headings of ‘Stocks Discount Future Events’, ‘Elections’ and ‘After Election Rallies’.
“When any important election either presidential or otherwise takes place, and the market has pretty well discounted it, but the general public throughout the country figure that the event is favourable, they of course send in buying orders the next day after election and stocks are strong until the demand is satisfied”
“It will always pay for you to wait two or three days after election and see whether the market continues to move in the same direction after election as it did before”
W.D Gann – Truth of the Stock Tape
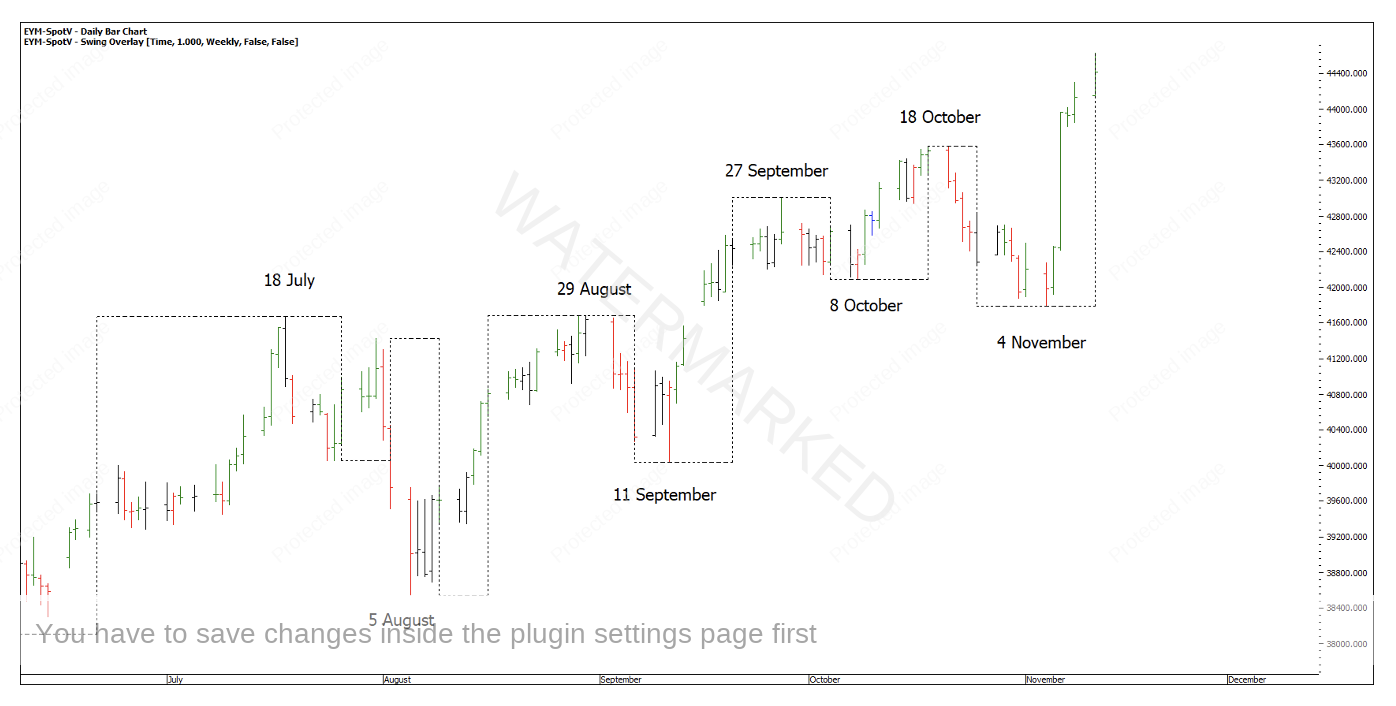
Chart 1 – Dow Jones
From a pure swing chart perspective, the above weekly swing showed a third contracting weekly swing up and an expanding weekly swing down. If I can cast your mind back to last months article An Unusual Setup, I referred to work on probabilities regarding shallow retracements for bull markets.
In this instance on the Dow Jones, the shallow retracement in early October did put a swing in the weekly swing chart only to be broken and now is confirmed a false break double bottom.
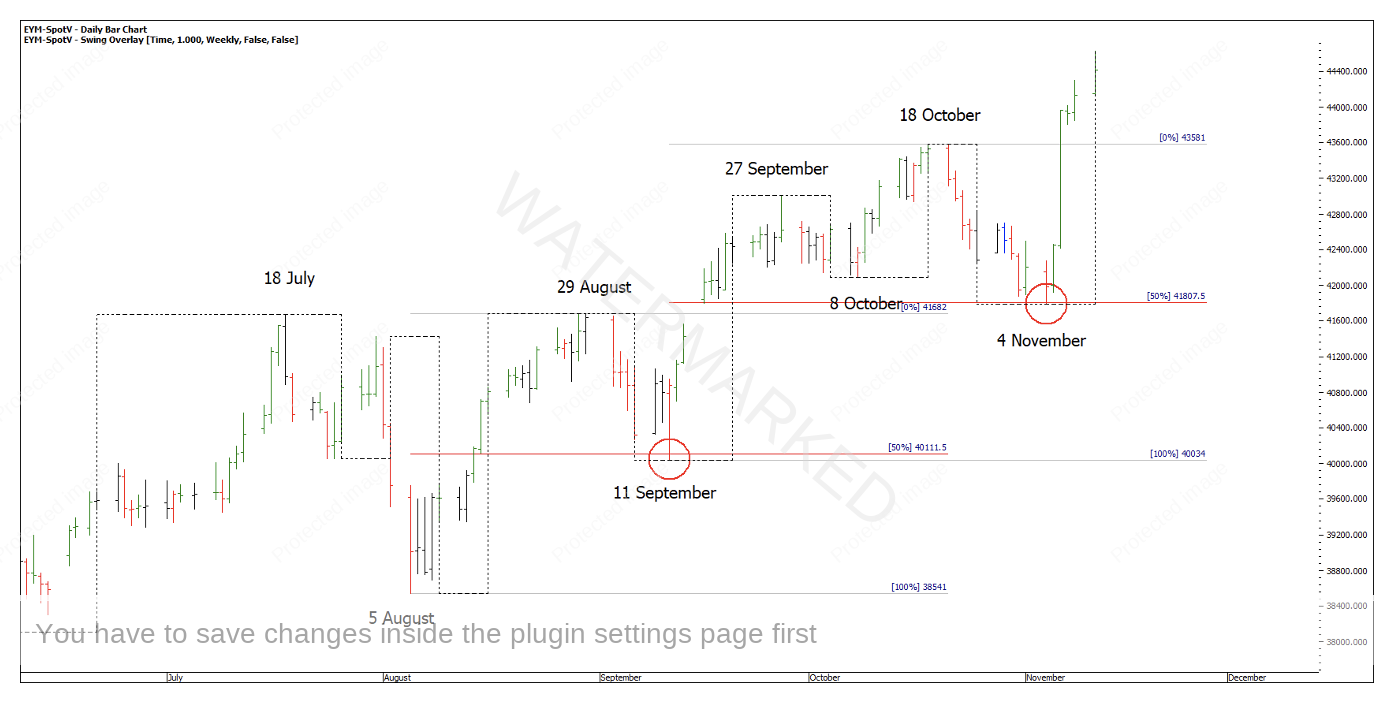
Looking at the market through a more subjective lens of Sections of the Market, you could argue two weekly sections up and two weekly retracements bang on 50%.
Chart 2 – 50% Retracements
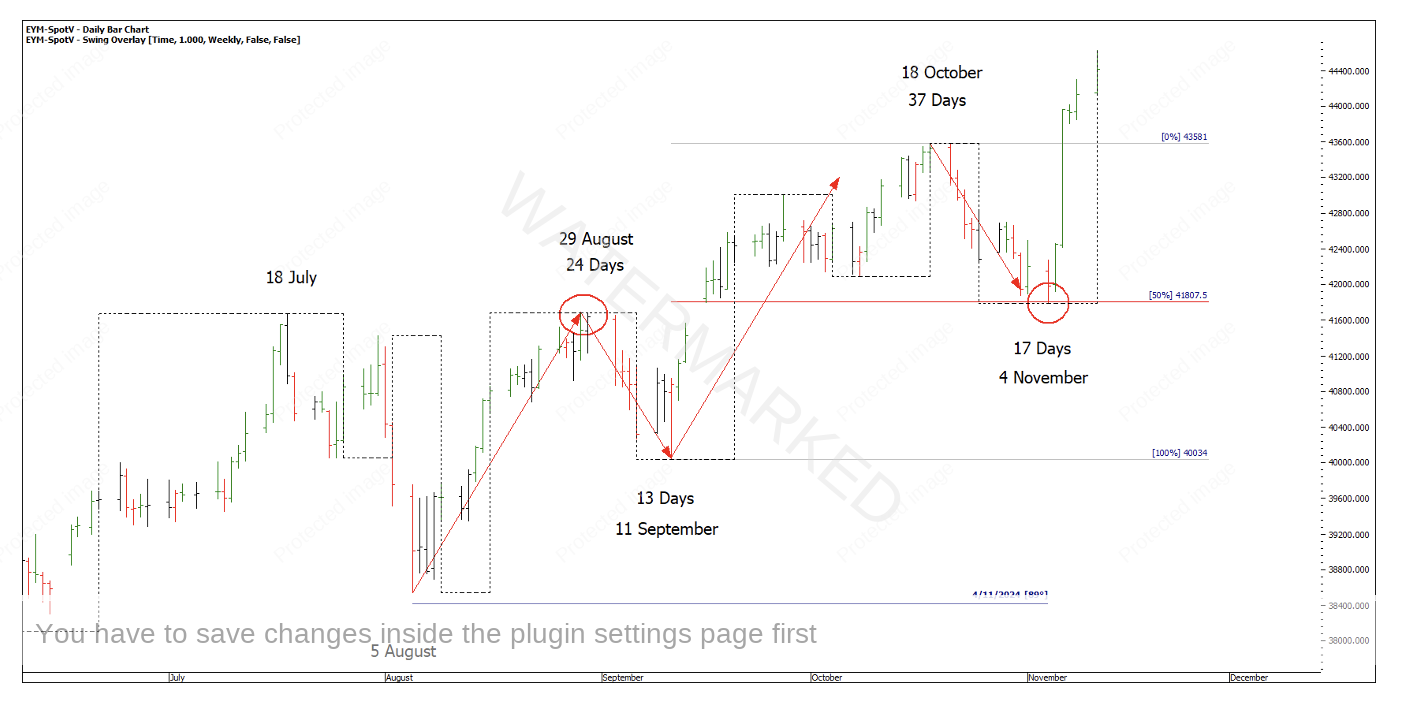
Sections always appear much clearer in hindsight. In this case there’s an expanding time and price section to the upside then a 50% time and price retracement into the 4 November low, sitting nicely just above old tops, 90 degrees from the 5 August low.
Chart 3 – Sections of the Market
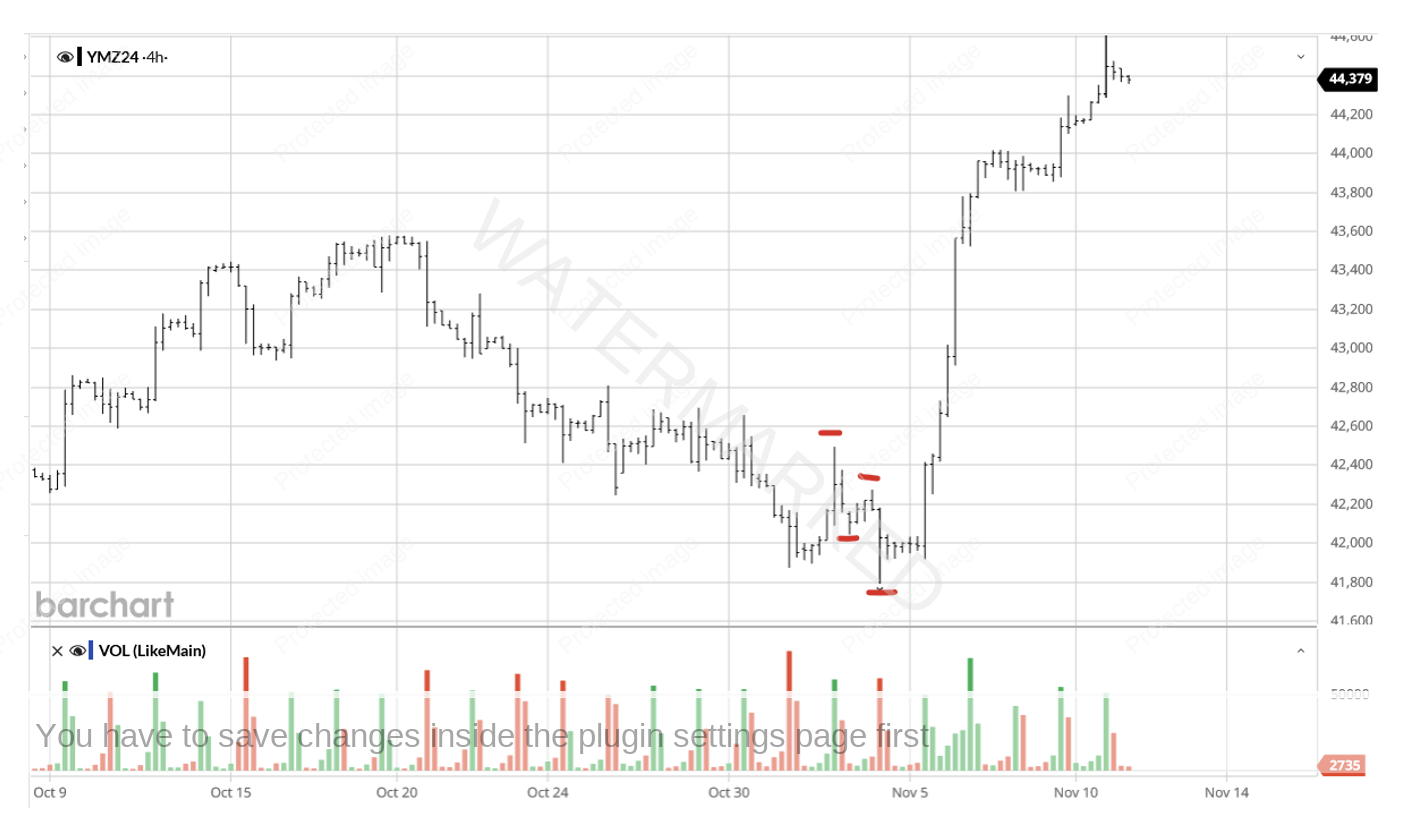
Regardless of the upcoming news of election results, at the time you could argue a setup was there with a third contracting daily swing range into the 4 November low. Breaking down this last daily swing range, you can see a 4 Hour repeating range. Both of these would be classed as signs of completion.
Chart 4 – Signs of Completion
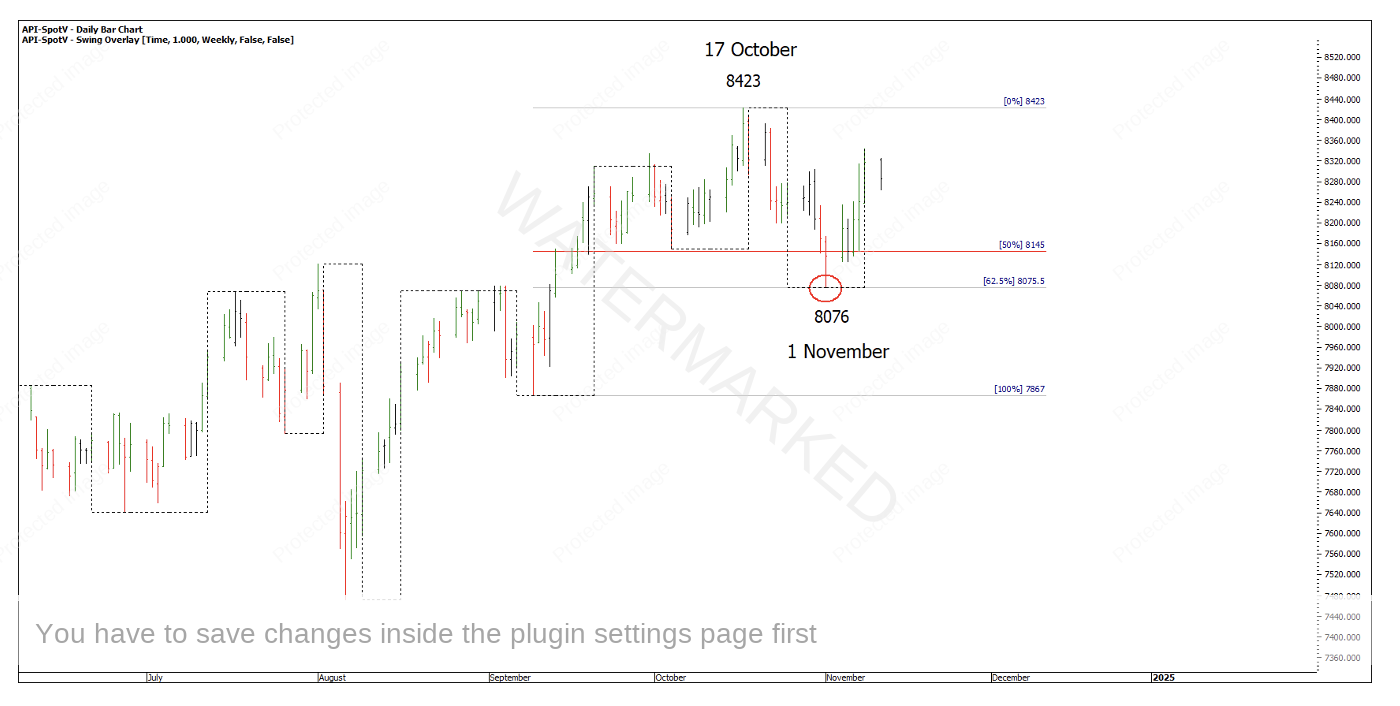
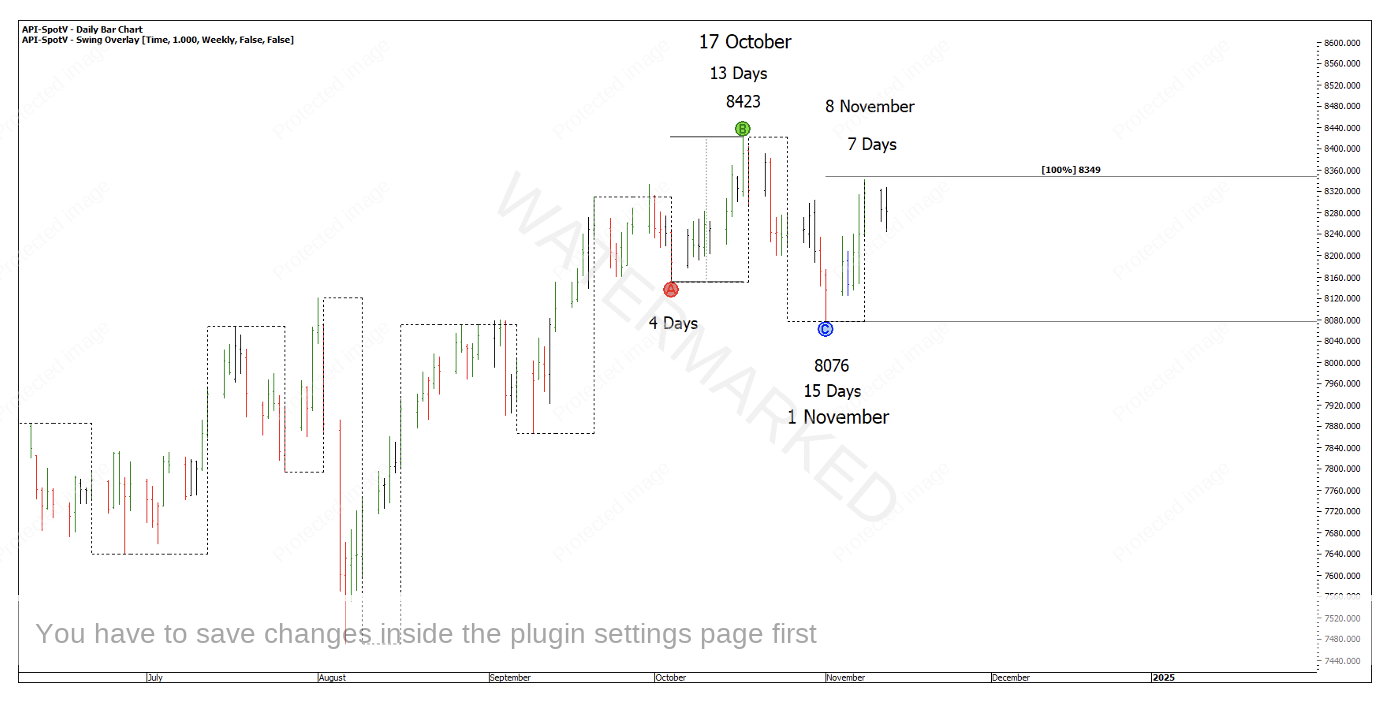
Whereas the Australian market looks a little different with a bigger false break off the last weekly swing low on 1 November and post-Election trading is yet to take out the 17 October high of 8423.
Chart 5 – SPI200
Back to pure swing charts and reading the ranges, there is an Overbalance in Time to the downside with 15 days down compared with 4 days down, and currently a contracting time and price weekly swing to the upside. Even with my previous work on probabilities, I still approach this with an open mind that the market could go either way.
Chart 6 – SPI200 Weekly Swing Chart
At the end of the day, we don’t have to try to trade every single move, rather just trade our trading plans.
If you get FOMO (fear of missing out) or feel an elevated emotion watching the market move off with or without you then an exercise I rate highly is to write down the exact thought and accompanying emotion you felt at the time to become aware of any subconscious thoughts and feelings that may result in an action not in line with your trading plan.
Happy Trading,
Gus Hingeley
