Waiting… No Run!
Summer in Australia means cricket for so many, none more so than my son. He watches his heroes on the TV and plays twice, every weekend, arriving at least an hour early to warm up! What is interesting as a proud parent, is to watch how patient he and his teammates are while out in the field. These 14-year-olds spend the rest of their time constantly engaged in devices, commuting to and from school, rushing from one activity to the next, expending energy at any cost. Until that moment on the weekend when the umpire shouts “play”, then they are in game mode, they are focused (like their heroes), and above all they are so very patient, whether batting, bowling or fielding! Somehow this feels like a life lesson to me.
In trading, you spend a lot of time in the outfield waiting for your moment, which can take days, weeks or even months. Our lives are also busy 24/7, and that’s why we need a trading plan, a routine and lots of control and patience. Like our young superstars, we need to be observant, patient, but on our toes and alert, so when the umpire calls “play”, we too are ready to pounce!
1. Setups on our markets
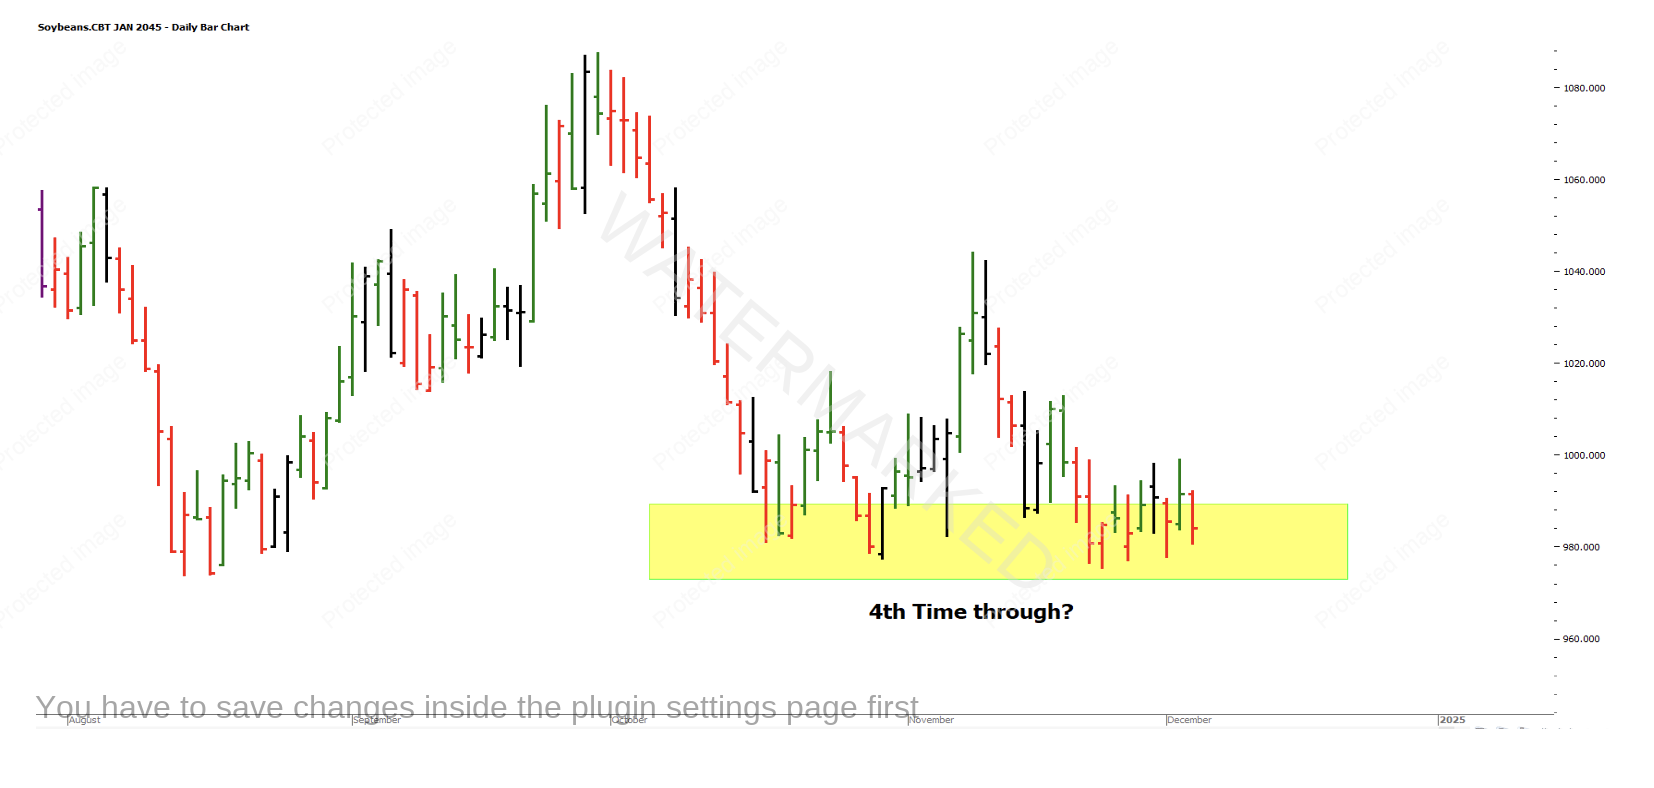
Soybeans:
Soybeans is teaching us about patience and is still above the multiple bottoms from last month, but only just. A lot of energy there waiting to be released, either way…
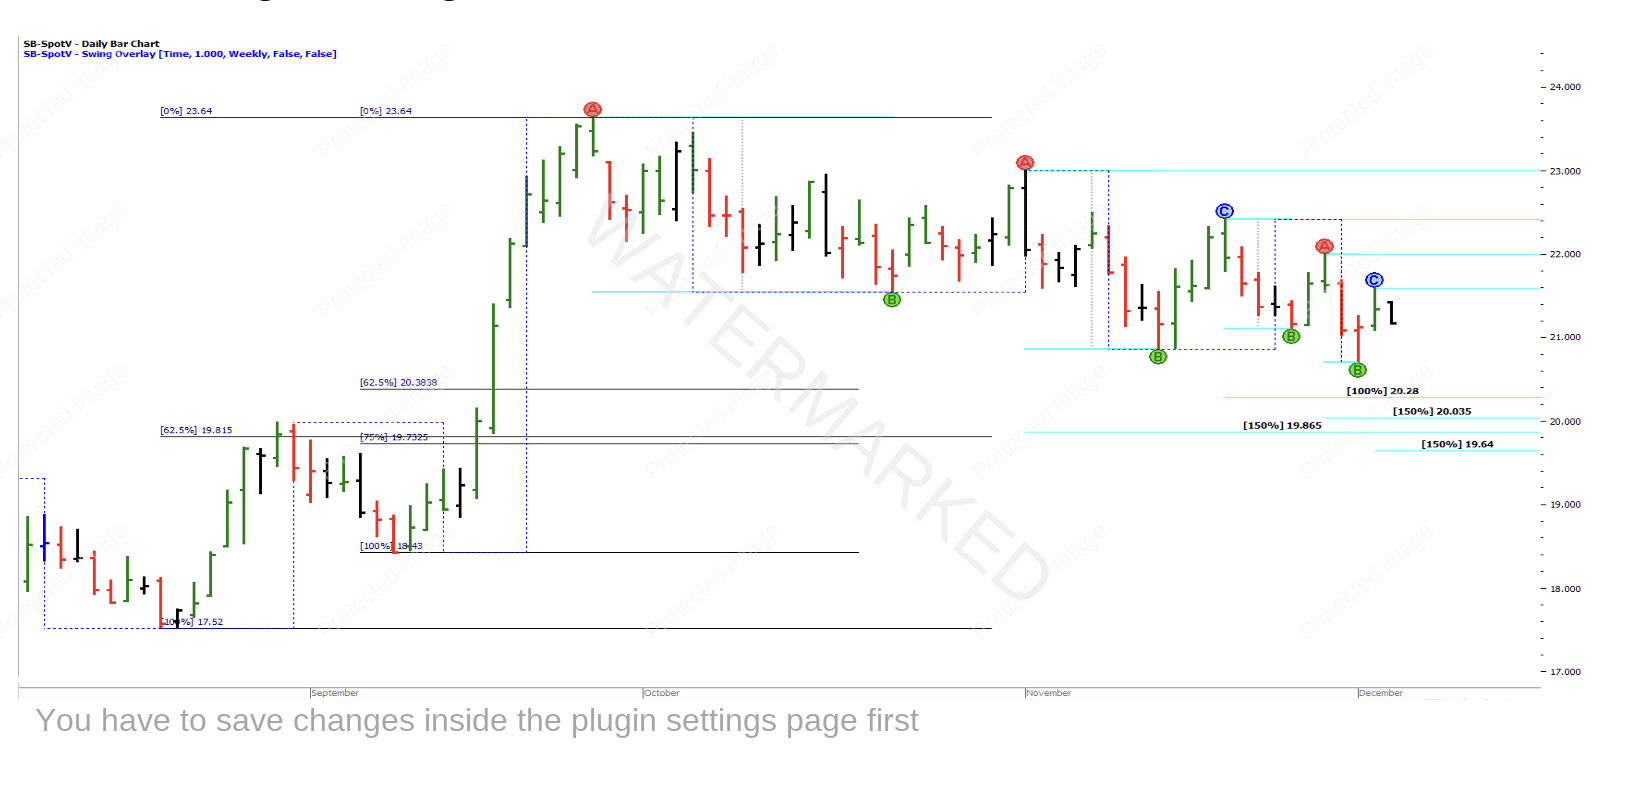
Sugar:
Still heading towards those clusters and retracement points down below. While we travel down, Sugar is giving us some ABC shorts to trade but is in no particular hurry. This feels like it is in a larger B-C range to me.
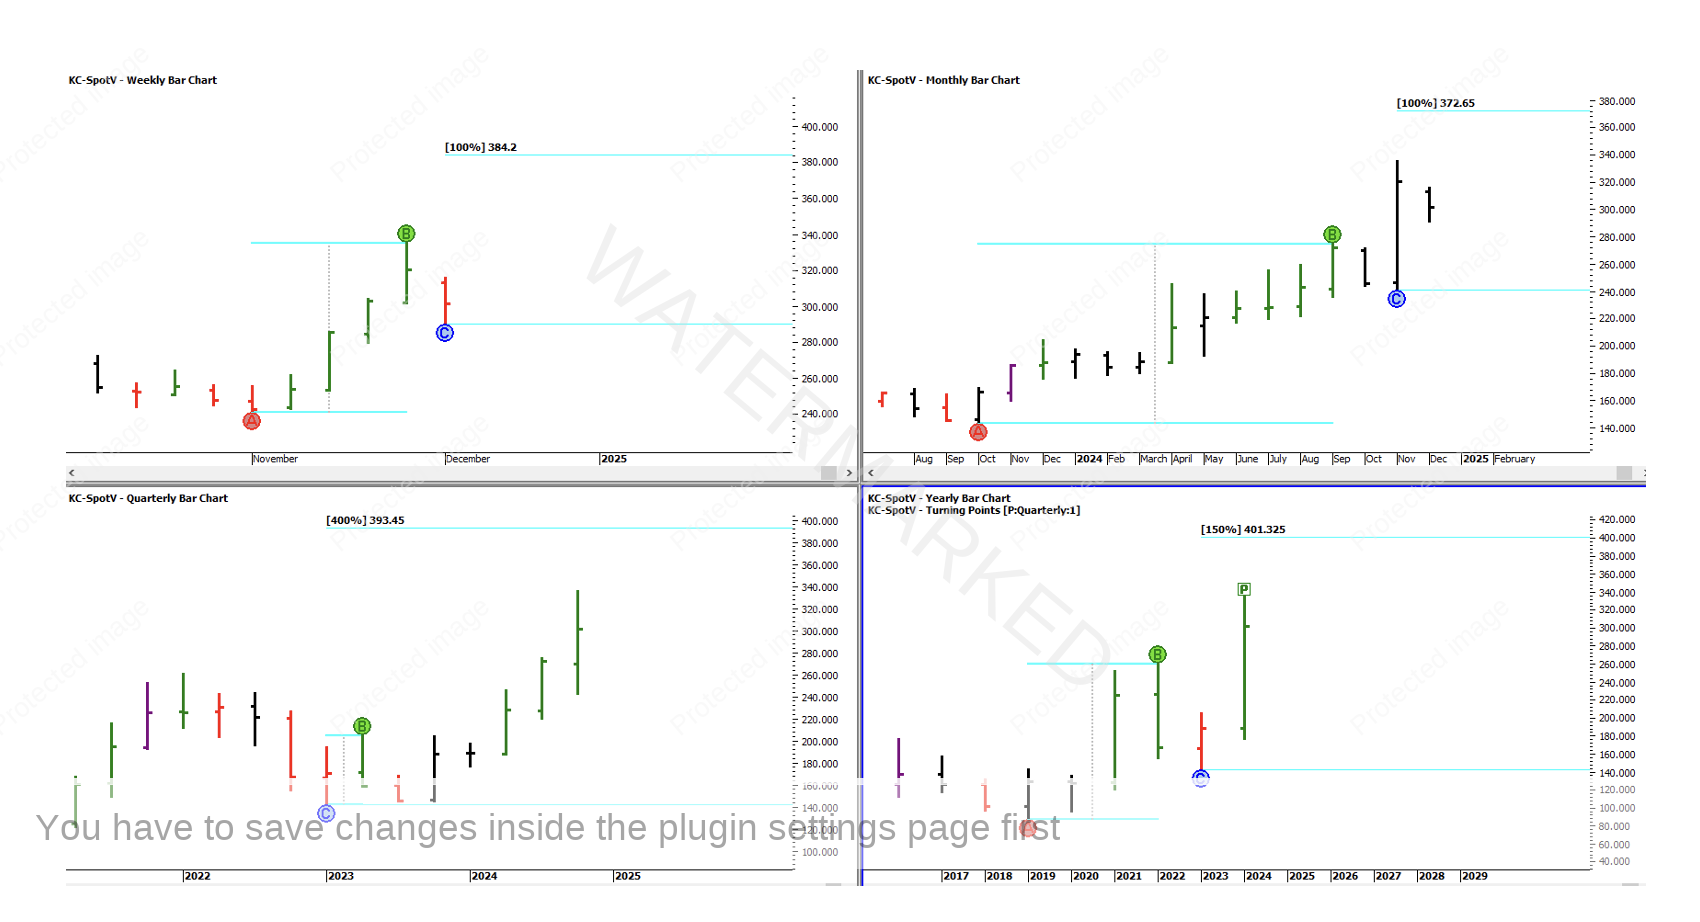
Coffee:
Even though it has reached its price ceiling from previous years and has reacted initially, I can’t see too many other signs of completion. So I think Coffee may go even higher, and I have outlined a possible cluster on the horizon that I’m on the lookout for down the track. The window stretches from 372 to 401 so you could argue that it is too wide. Maybe if/when it gets a bit closer the smaller charts will help to refine this broad target. Meanwhile, Coffee may offer up some long trades for those who are ready…
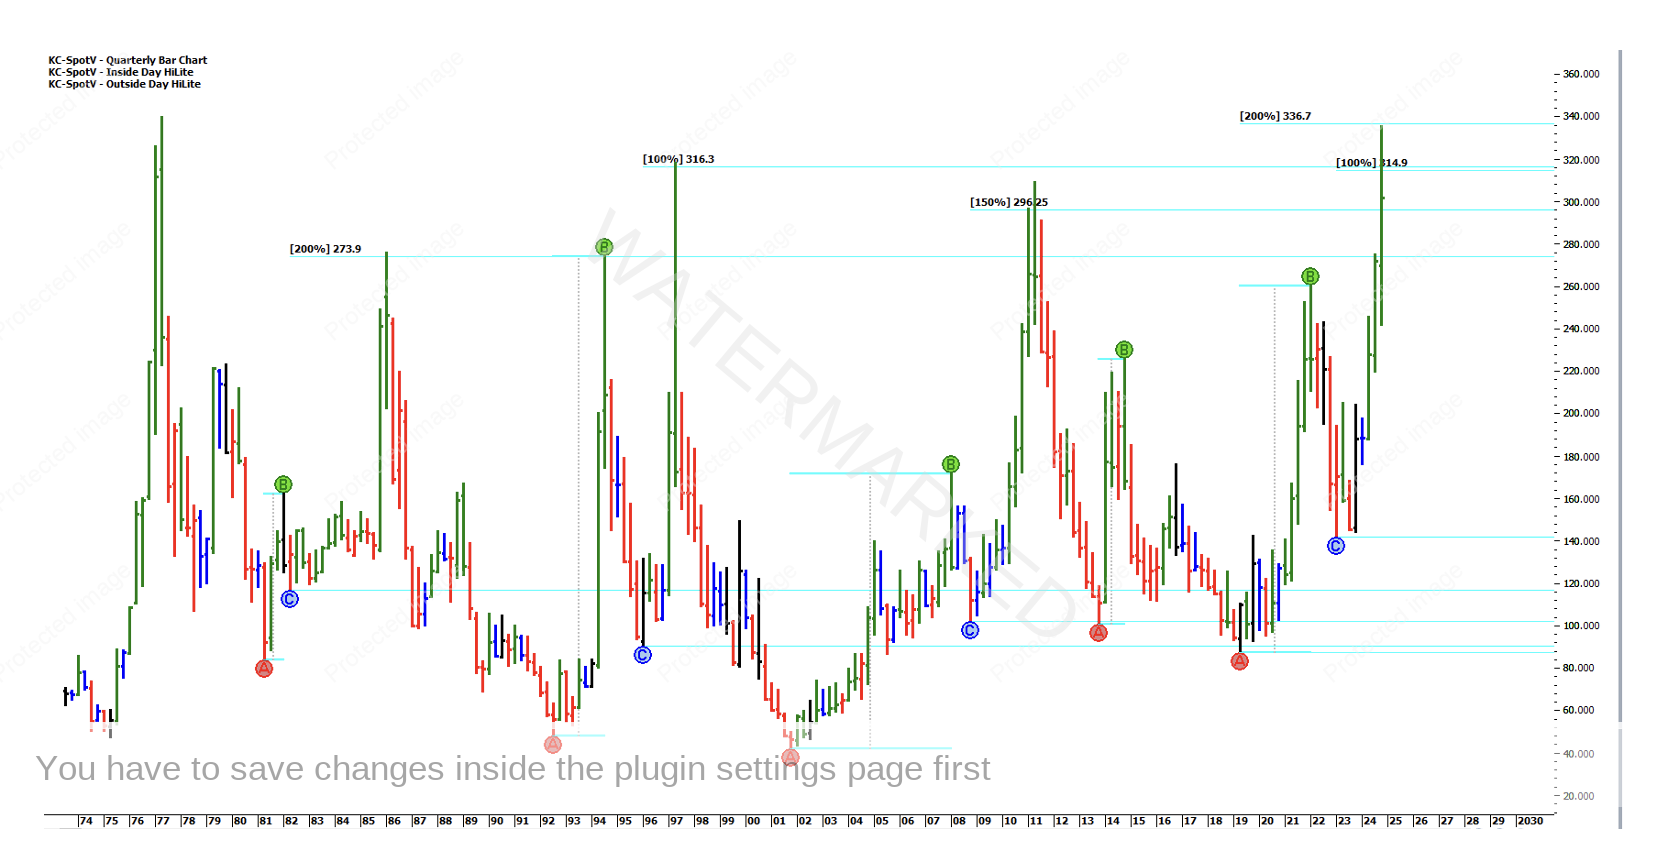
Saying that, I do have a big picture chart below of previous large Coffee highs in this price area and the percentages that stopped the market on those occasions. Maybe the answer is in the smaller bull market that proceeds the main one? If that is the case, then there might be a reason for the market to turn down from here. Either way you just work off the swing charts at hand and monitor the ranges.
2. Cocoa Investigation
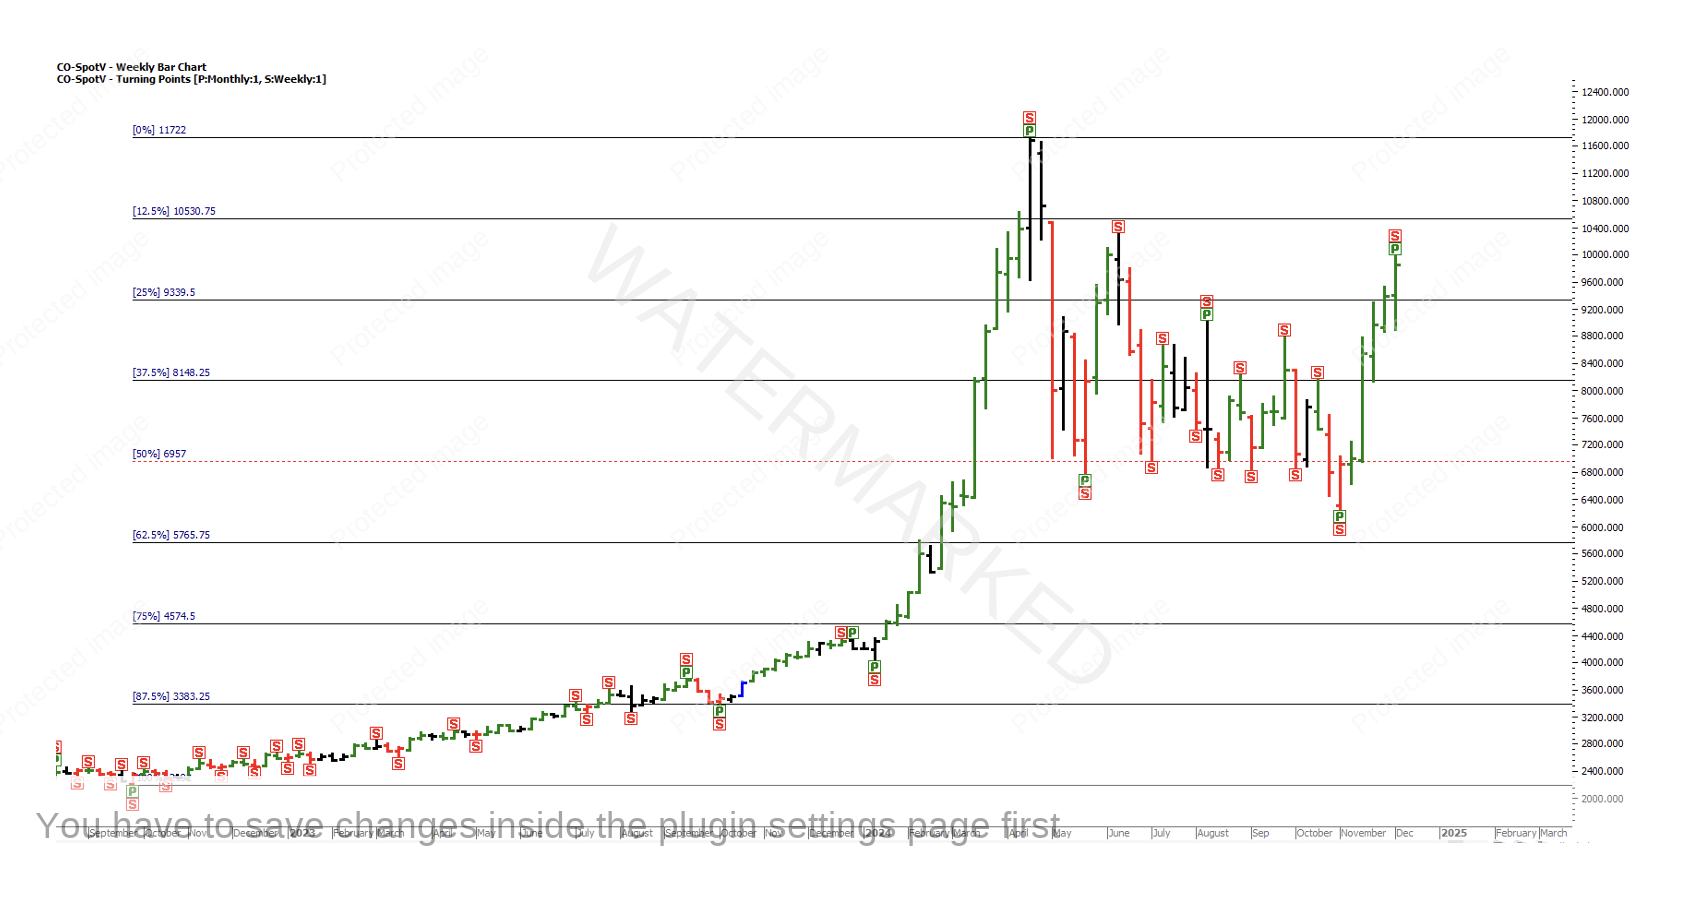
The chart below shows the market since late 2022 when Cocoa started to rise. Look how it has used the 50% as support so many times.
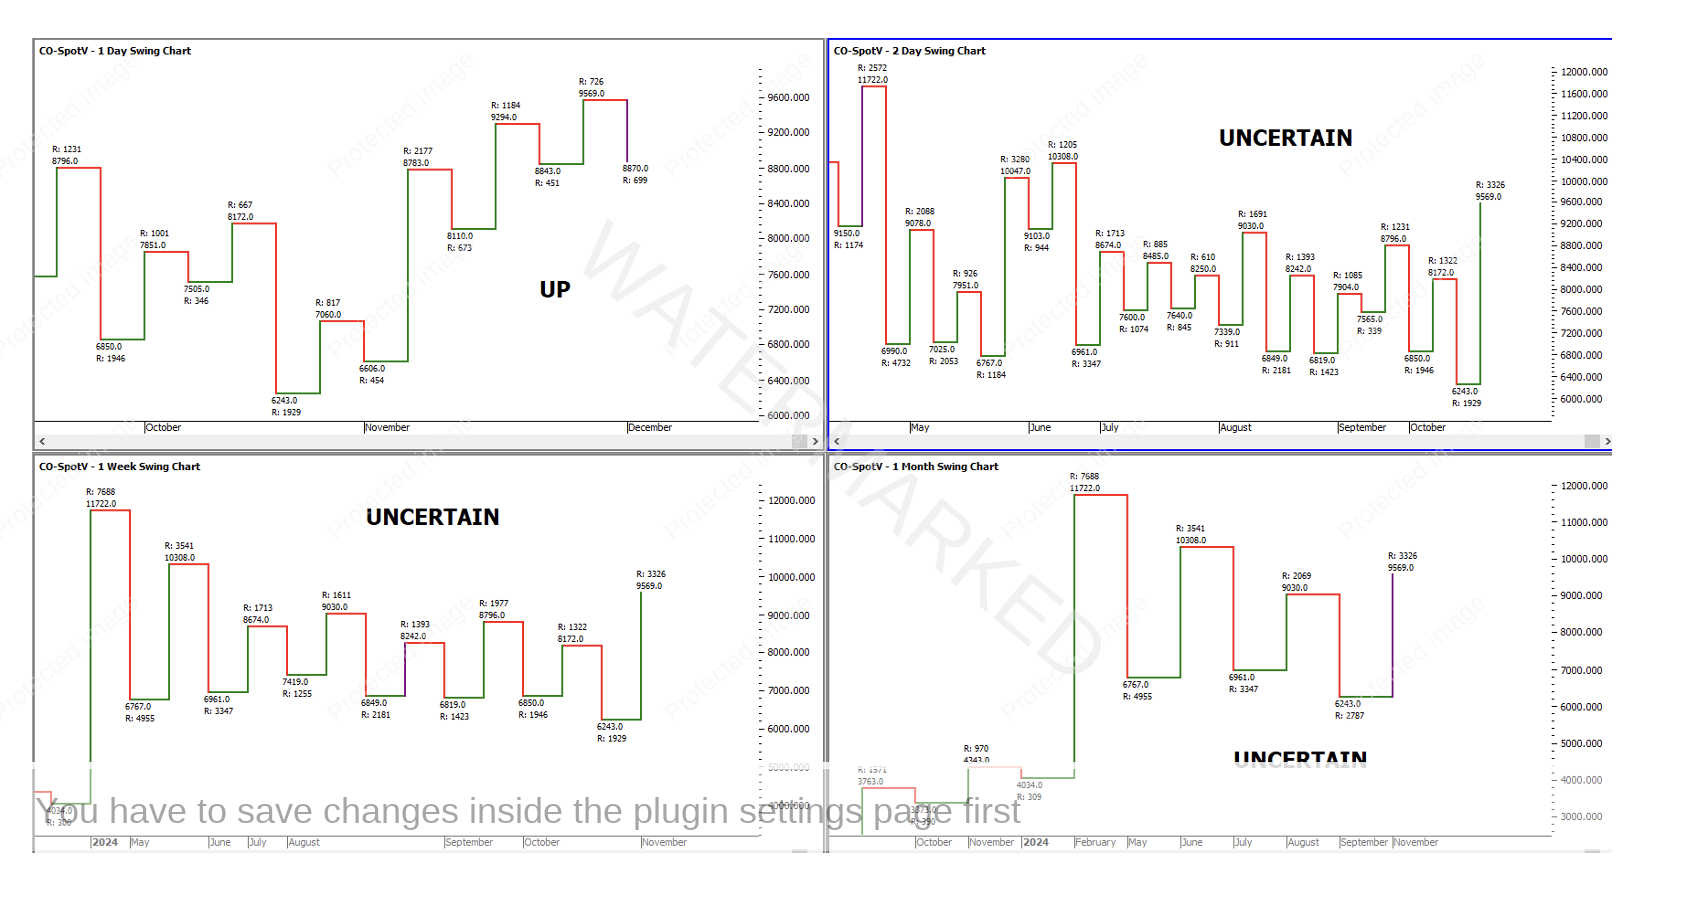
Take a look at the trends from the different time frames and you will find a fair amount of uncertainty, but the current swing on the bigger charts is up. Maybe that downturn on the one-day chart is the end of the A-B range on the bigger picture, as they head down to a Point C?
3. Paper Trade a Set Up
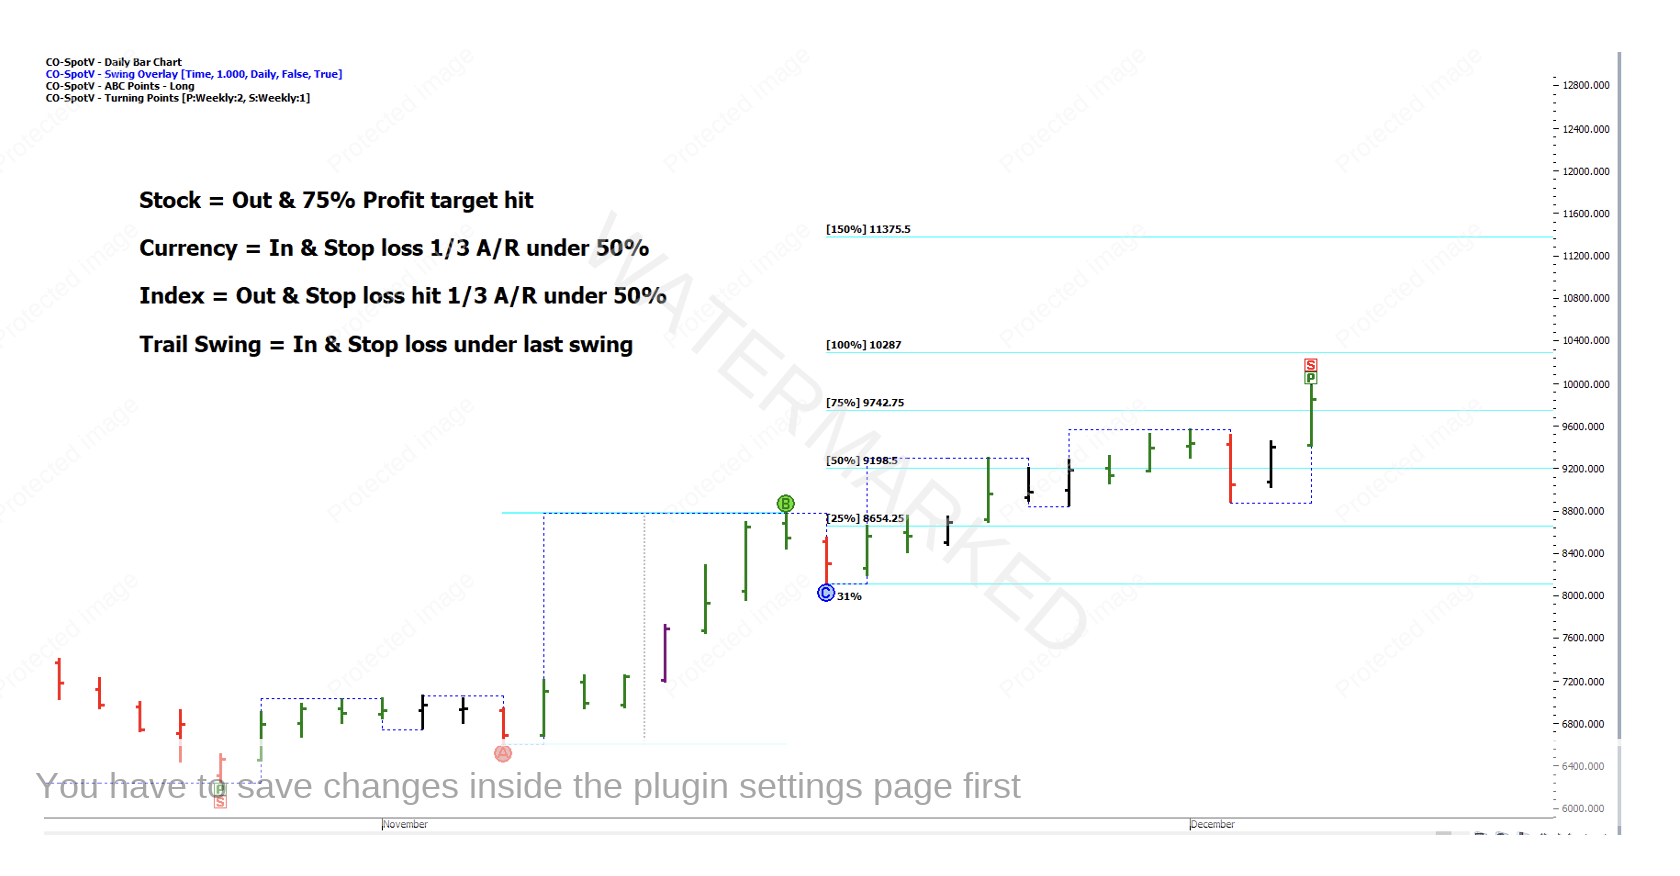
Here is a recent ABC Long trade opportunity on Cocoa which is still current…
4) Delayed Data Trade on Sugar
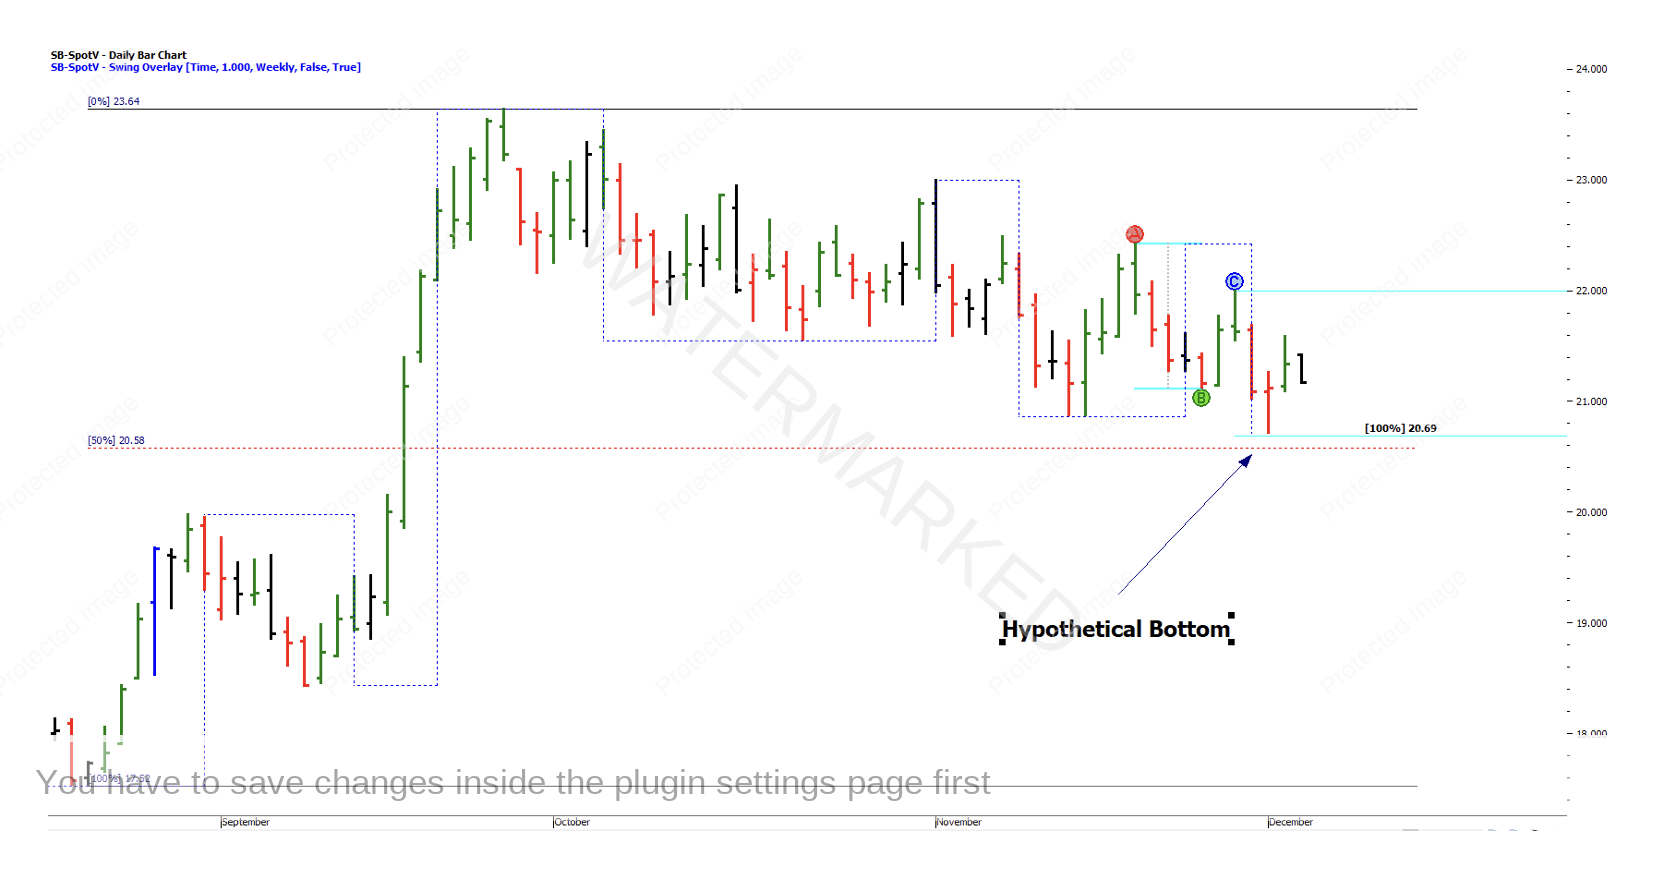
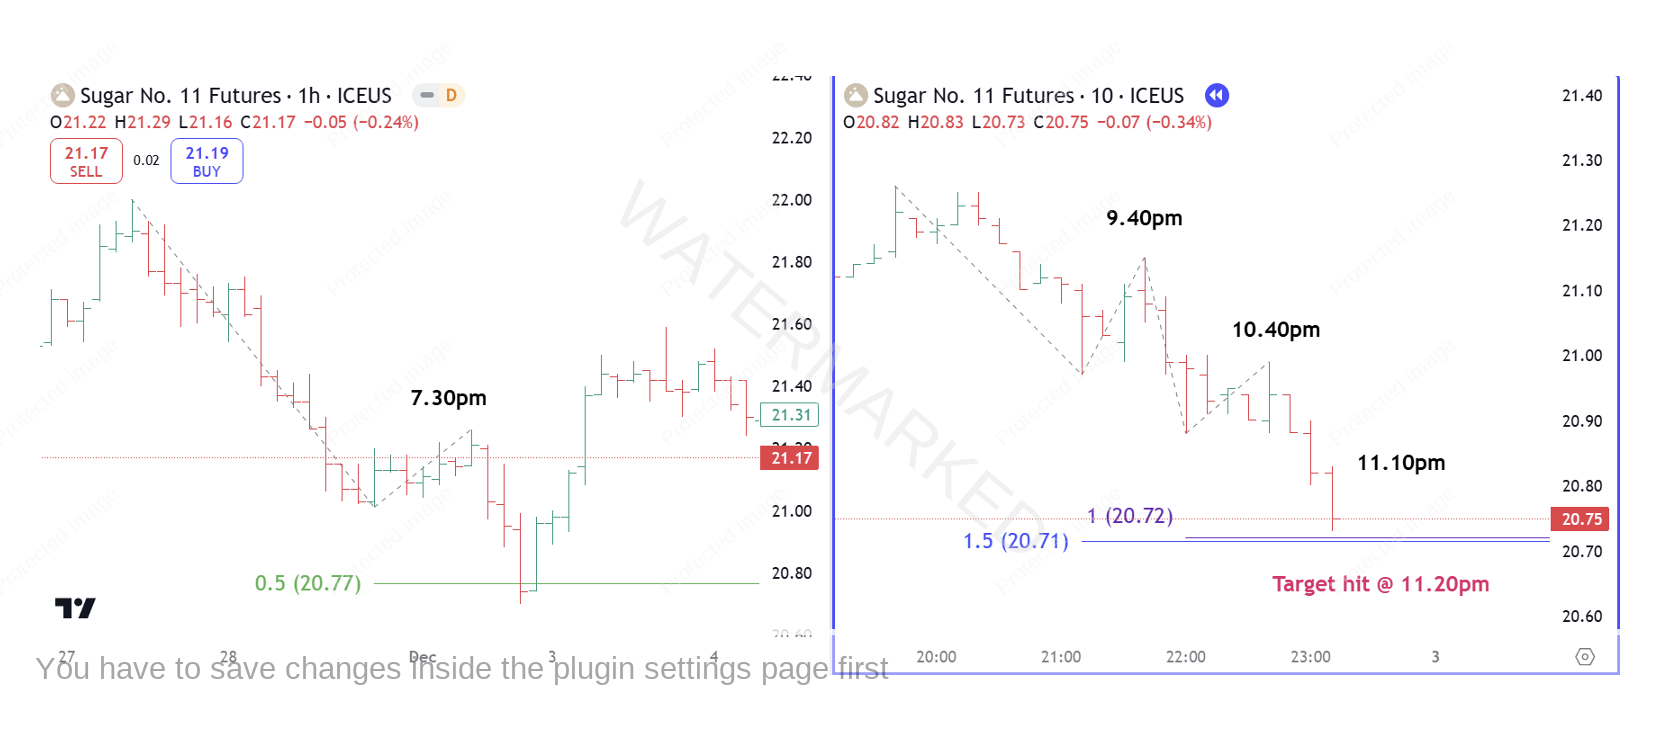
In the chart below I have picked out the most recent low on Sugar which happened on Monday 2nd December. I fully expect this low to have been taken out by the time you are reading this, but for the sake of our ‘delayed data’ experiment let’s assume it’s a low we were waiting for.
In the chart below I’ve zoomed into intra-day world with the 1-hour chart to the left and a 10-minute chart to the right. I’ve used a 10-minute chart because the data is 10 minutes behind, so the chart on the right is always one bar behind. Sugar opens at 4.30pm Perth time, so the hourly bars will always show the ½ hour. Please note that the times shown on the chart are AWST.
With the hourly chart you can see a possible ‘Point C’ forming at 7.30pm giving us a 50% danger zone around our daily target which was 20.69. From 9.40pm the 10-minute chart starts to build in two more clusters that sit around our price target. I would have to say that by 11pm with the three intra-day culmination points backing up the daily target, I would be happy to place my entry & stop loss orders.
I have paused the 10-minute chart ten minutes before the cluster was hit, as that’s the bar you would be looking at, while your trade opened and flashed up in a separate part of your trading platform. Then I guess you nervously watch your positions/exposure table to see if your stop loss gets taken out… and ten minutes later you get to see what exactly happened.
So, some points from looking at this particular setup:
You could have just used the daily chart, although it didn’t quite reach its target.
The 1-hour chart gave some further confirmation fairly early on.
The 10-minute chart sealed the deal, but you have to be observing closer to the time of the turn.
The time zone that you are trading from will affect how you could manage these clusters.
Conclusion: I think I have always assumed that I need ‘live data’, but I would have to say that being 10 minutes behind really didn’t make a difference at any stage until the end, and then only if you are wanting to watch and manage your trade upon activation. I guess if your stop loss was taken out, you may want to give yourself a second chance to enter the market, and being 10 minutes behind could make that quite difficult. Saying that, if 11.20pm is really 2.20am in your time zone then you will have set your trade orders already and gone to bed anyway.
Homework:
I’m not going to set specific homework this time as the holiday period is coming, when I will be spending a lot of time evaluating 2024 and setting myself some trading goals for 2025. I will track these markets leading into the end of the year with my main goal being to get to know them all a little bit better, so I’m ready for the new year. I certainly have enjoyed delving into this new area (for me) and I’m excited about the trading ahead.
For now, I’m going to pull up stumps!
Have a great Christmas, making sure you give yourself a well-deserved rest and I look forward to our journey continuing in January.
Many thanks,
Darren
