Dollar Dilemma?
Now is no different as I plan a potential jaunt to the northern hemisphere in search of snow. The Australian Dollar is one currency that in many ways is a football that is kicked around based on the prevailing commodities trend and what the players at the big table are focused on at the time. For those that have followed along with the discussion on Gold this year, you will see that the function of commodities and currencies especially the US Dollar are all linked.
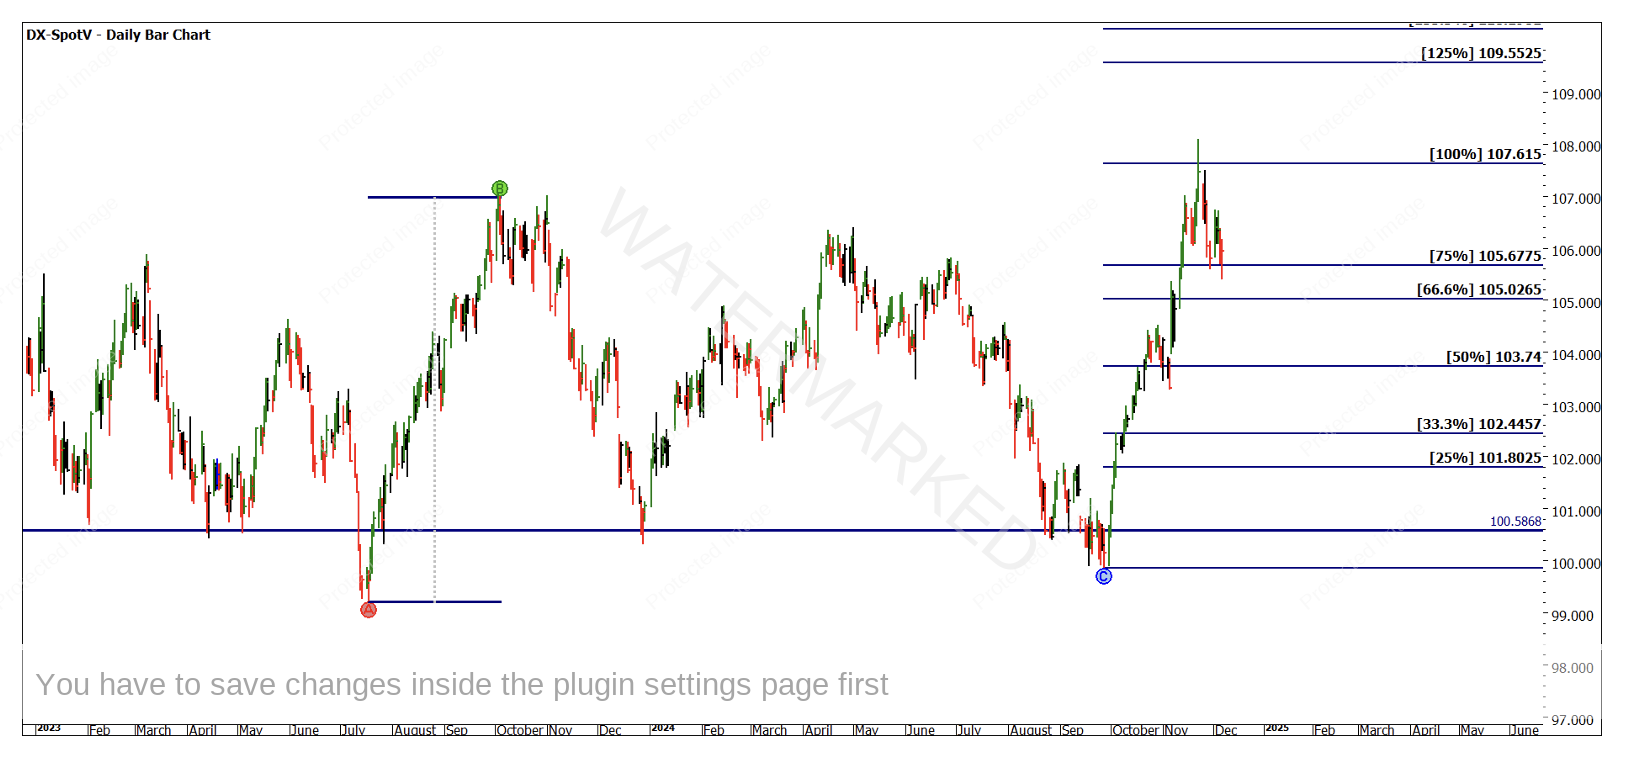
The change in administration in the US has potentially been a catalyst for movement but as we see in Chart 1, the pattern of a double bottom (loose) and support around previous lows has seen the Dollar Index moving higher post the September seasonal date.
Chart 1 – DX-Spotv Daily Bar Chart
The Australian Dollar has a typical inverse relationship to the US Dollar as one rises the other falls.
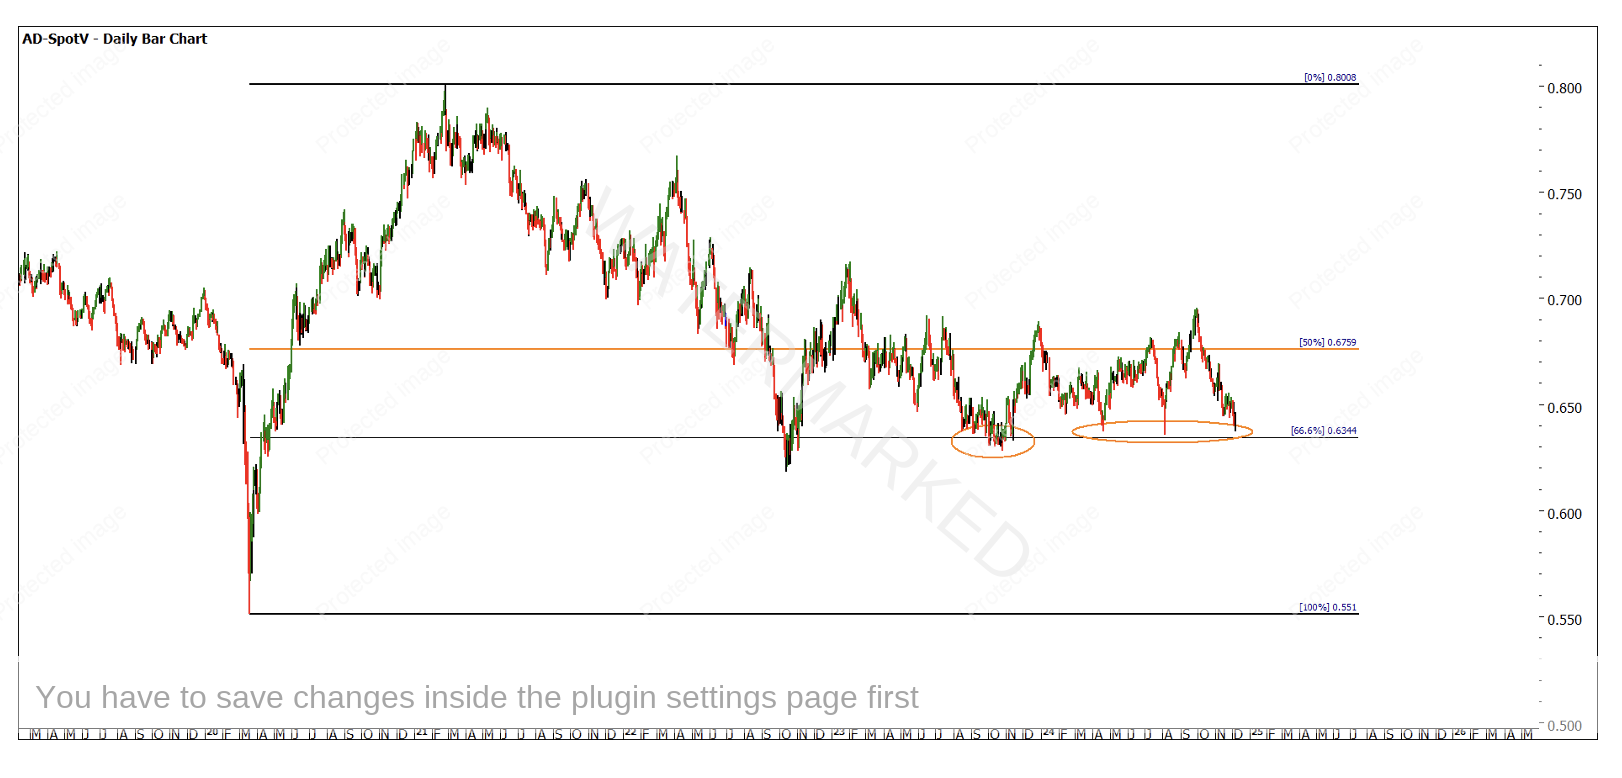
Chart 2 shows us the current picture on the Aussie Dollar and how its current position gives us reasons to be watching for a decision point in terms of the broader trend. The price action has been somewhat constrained between the 63 and 68 cent mark, and this aligns with overall support and resistance as well as a Ranges Resistance Card using the Covid range as the guide.
Chart 2 – AD-Spotv Daily Bar Chart
Of note as well is the number of times that the price action has hovered around these lows. Gann’s texts refer to the notion of markets often moving through a level on the 4th attempt, but this is to be used in conjunction with other analysis as opposed to a rule.
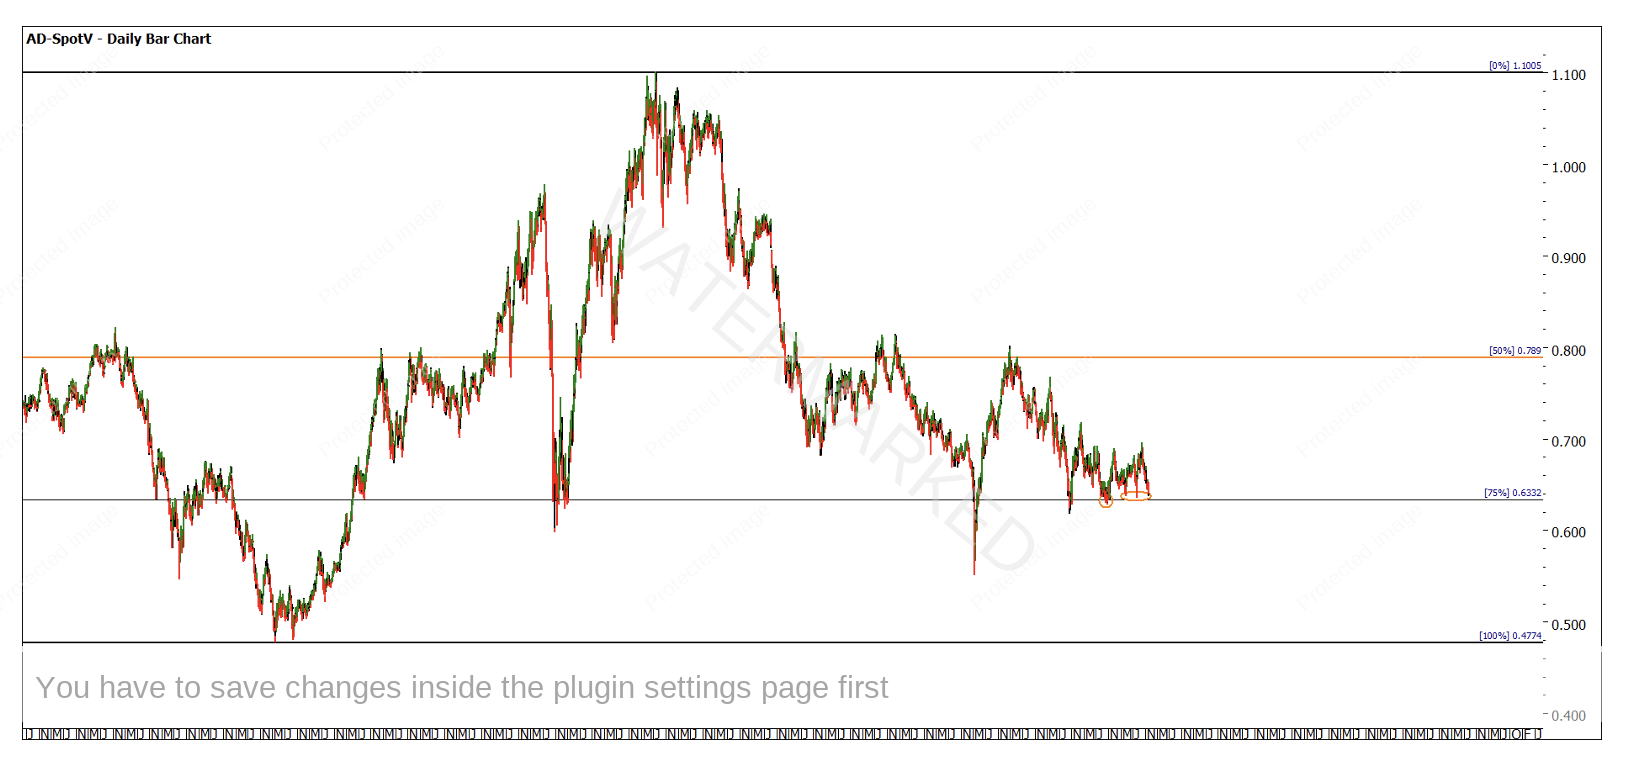
Chart 3 steps back even further to look at the All-Time Low and High to again provide a range for use to build a resistance card from.
Chart 3 – AD-Spotv Daily Bar Chart
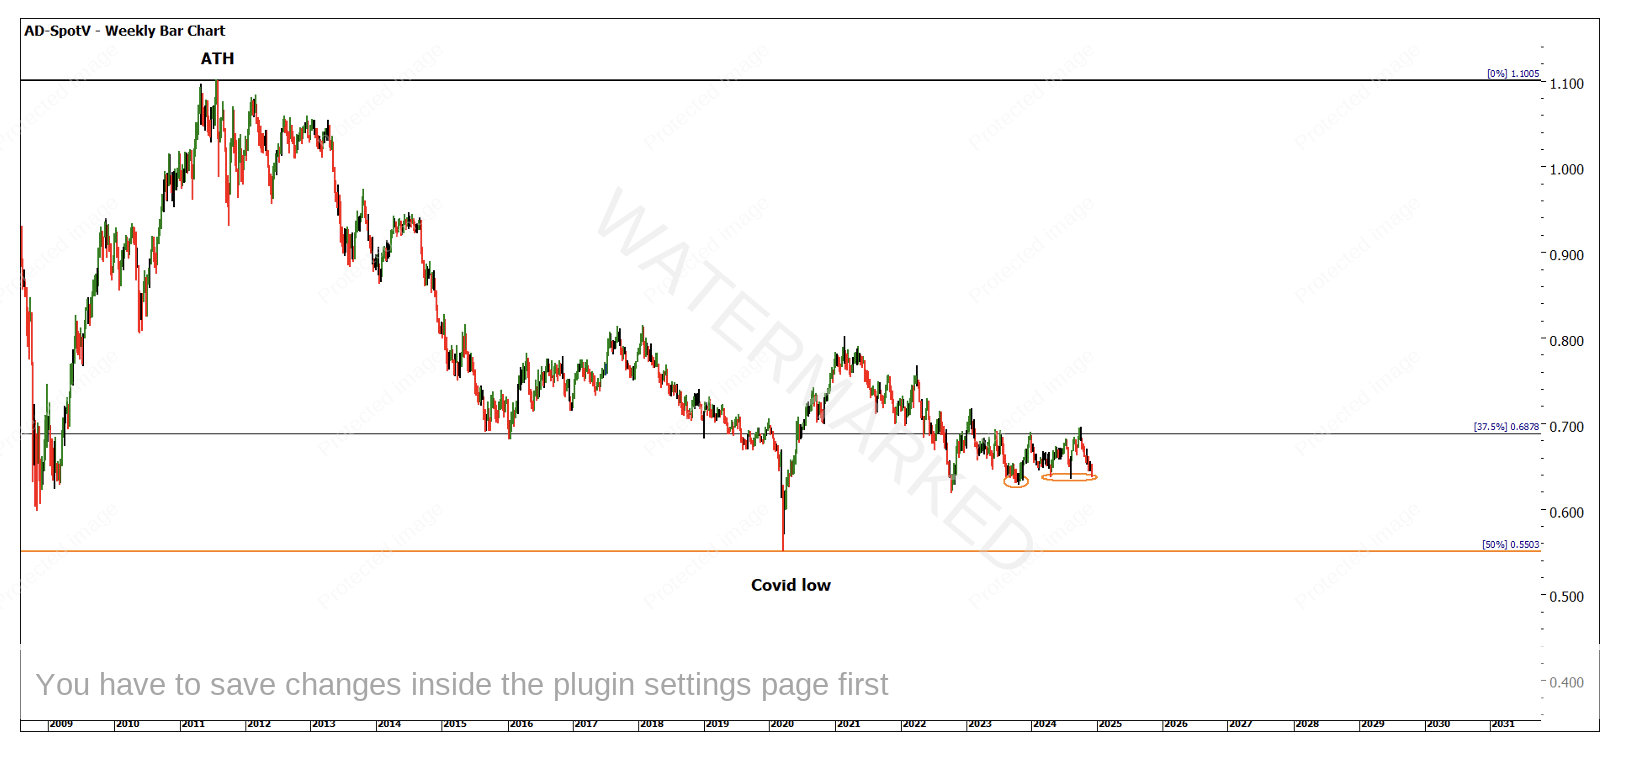
The value of Highs and Lows Resistance Cards can be telling, but we need to always be tracking and rating the market against them. Chart 4 is the All-Time Highs Resistance Card and we see in 2020 that 50% of this level provided the exact low within a couple of ticks. Often people lament, why doesn’t it work like this all the time? The challenge is to be aware and ready when it does.
Chart 4 – AD-Spotv Daily Bar Chart
The 37.5% level has also been useful in banding this market for upside resistance, if you are a trader who can profit in sideways scenarios then you could employ a strategy that bands the market between the two areas of support and resistance approximately 63 cents and 69 cents if you will.
Otherwise as directional traders we are required to get in tight and swing trade the ranges or potentially step back and create some price clusters and wait for a breakout one way or the other. The next best thing is to be able to create some time pressure areas where we can wait, watch and see if aprice and time meet. This is not essential to be able to trade a market like this, to me it allows for a lower stress environment, where losing trades, be it due to impatience or wrong timing, don’t eat away at your account balance and confidence.
The 30 September high and the current low on 6 December 2024 both have 2nd and 3rd dimension harmony about them. I am excited to share that and more in next year’s coaching program for the Ultimate Gann Course. It’s approximately 15 years since we launched the update to David’s Video Series. The only downside is that my jokes haven’t changed, however, in that 15 years’ time has allowed me to refine and polish the techniques and skills so they are clear and orderly in my own process. I look forward to sharing that with you.
As this is my last article to 2024, I want to extend my best wishes for Christmas to you and your families and to a successful 2025 in the markets.
Good Trading
Aaron Lynch


