10x Plus Returns in 3 Weeks:
How Our Repeatable Strategies Deliver on Apple
What we teach works equally well across all market types – Stocks, Commodities, Indices and Currencies. Here’s a glimpse of the kind of profits you can unlock by applying some of the strategies taught in our Active Trader Program.
Let’s take a look at the stock Apple (NASDAQ:AAPL) and a recent example from December 2024/January 2025 and how our Wheels Within Wheels approach we teach would apply.
It is just simply a set of processes stacked one on top of the other.
There were a number of price reasons for the top at $260.10 on the 26th December 2024.
By applying the technical analysis techniques from our Active Trader Program to past market action, we identified four key price cluster points to watch for a likely top in the market.
These began to become evident as far back as early November 2024, some 6 weeks before the actual top came in.
Let’s take a look at this period using ProfitSource Software.
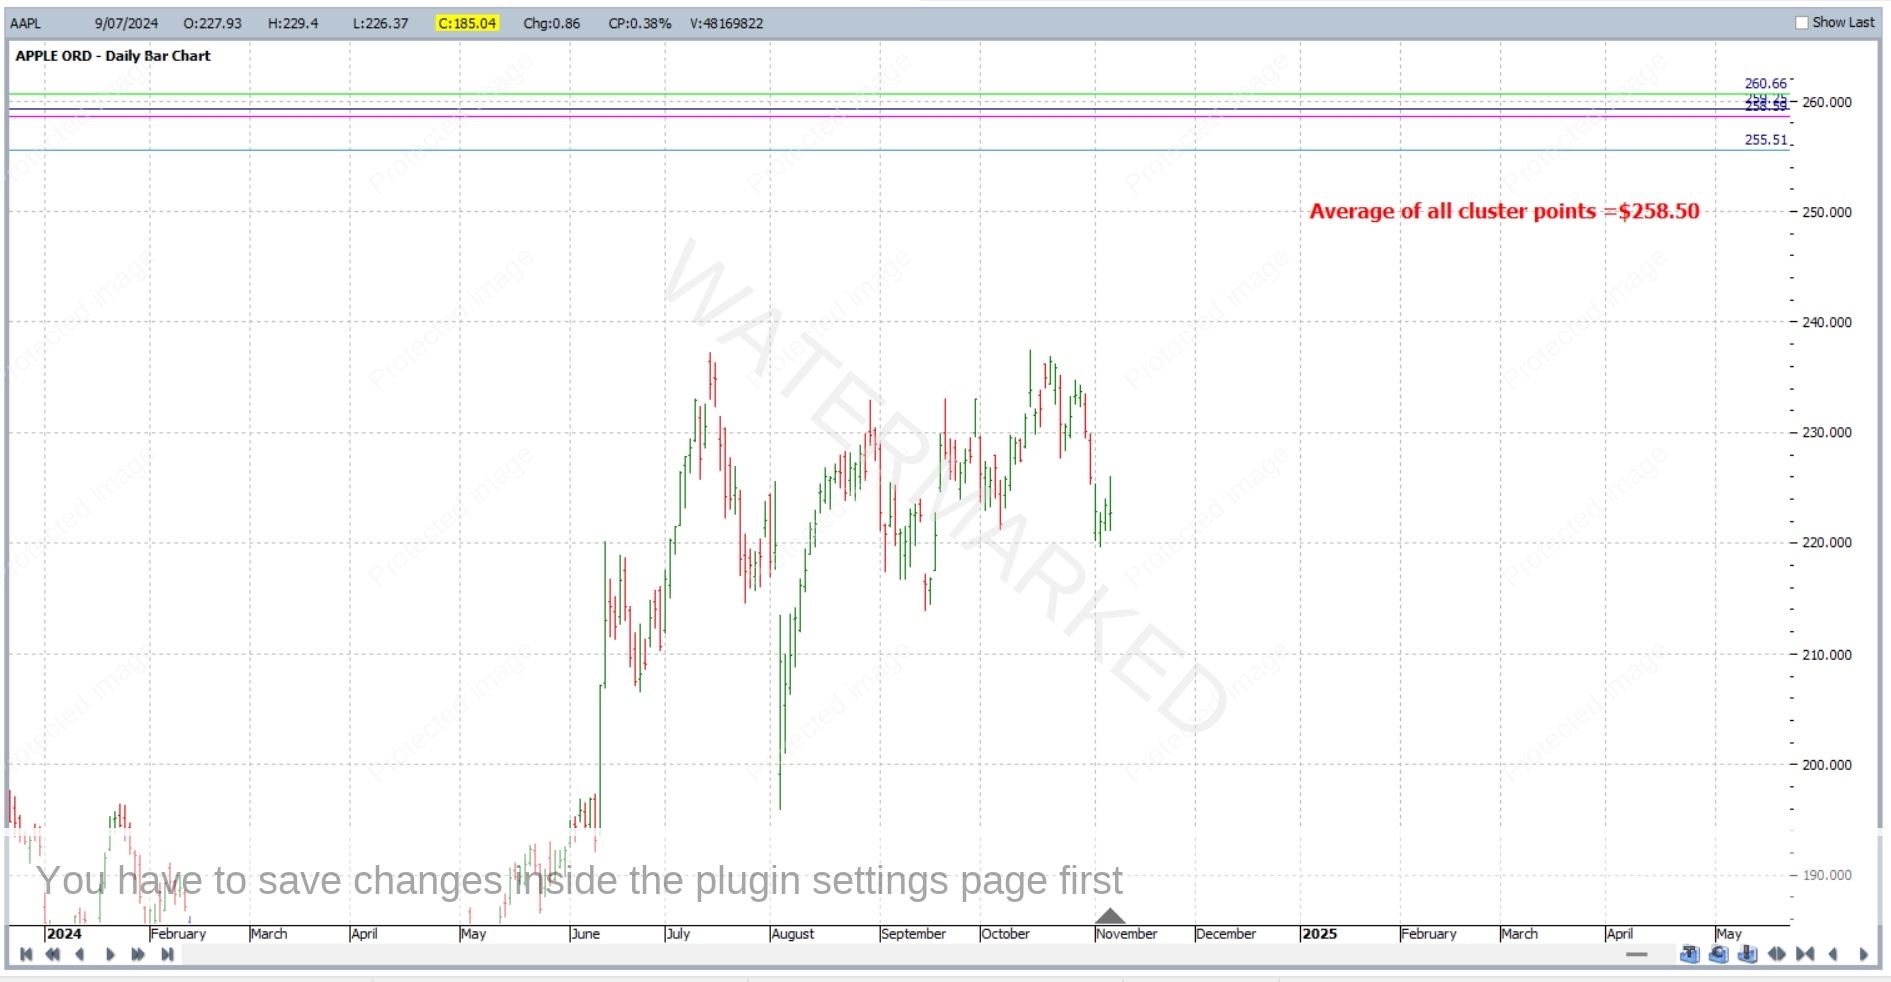
While the world began to turn its attention to Christmas and the holiday season, Apple stayed steady and continued its momentum, giving us further cluster points to watch.
These cluster points were:
- $255.51
- $258.59
- $259.25
- $260.66
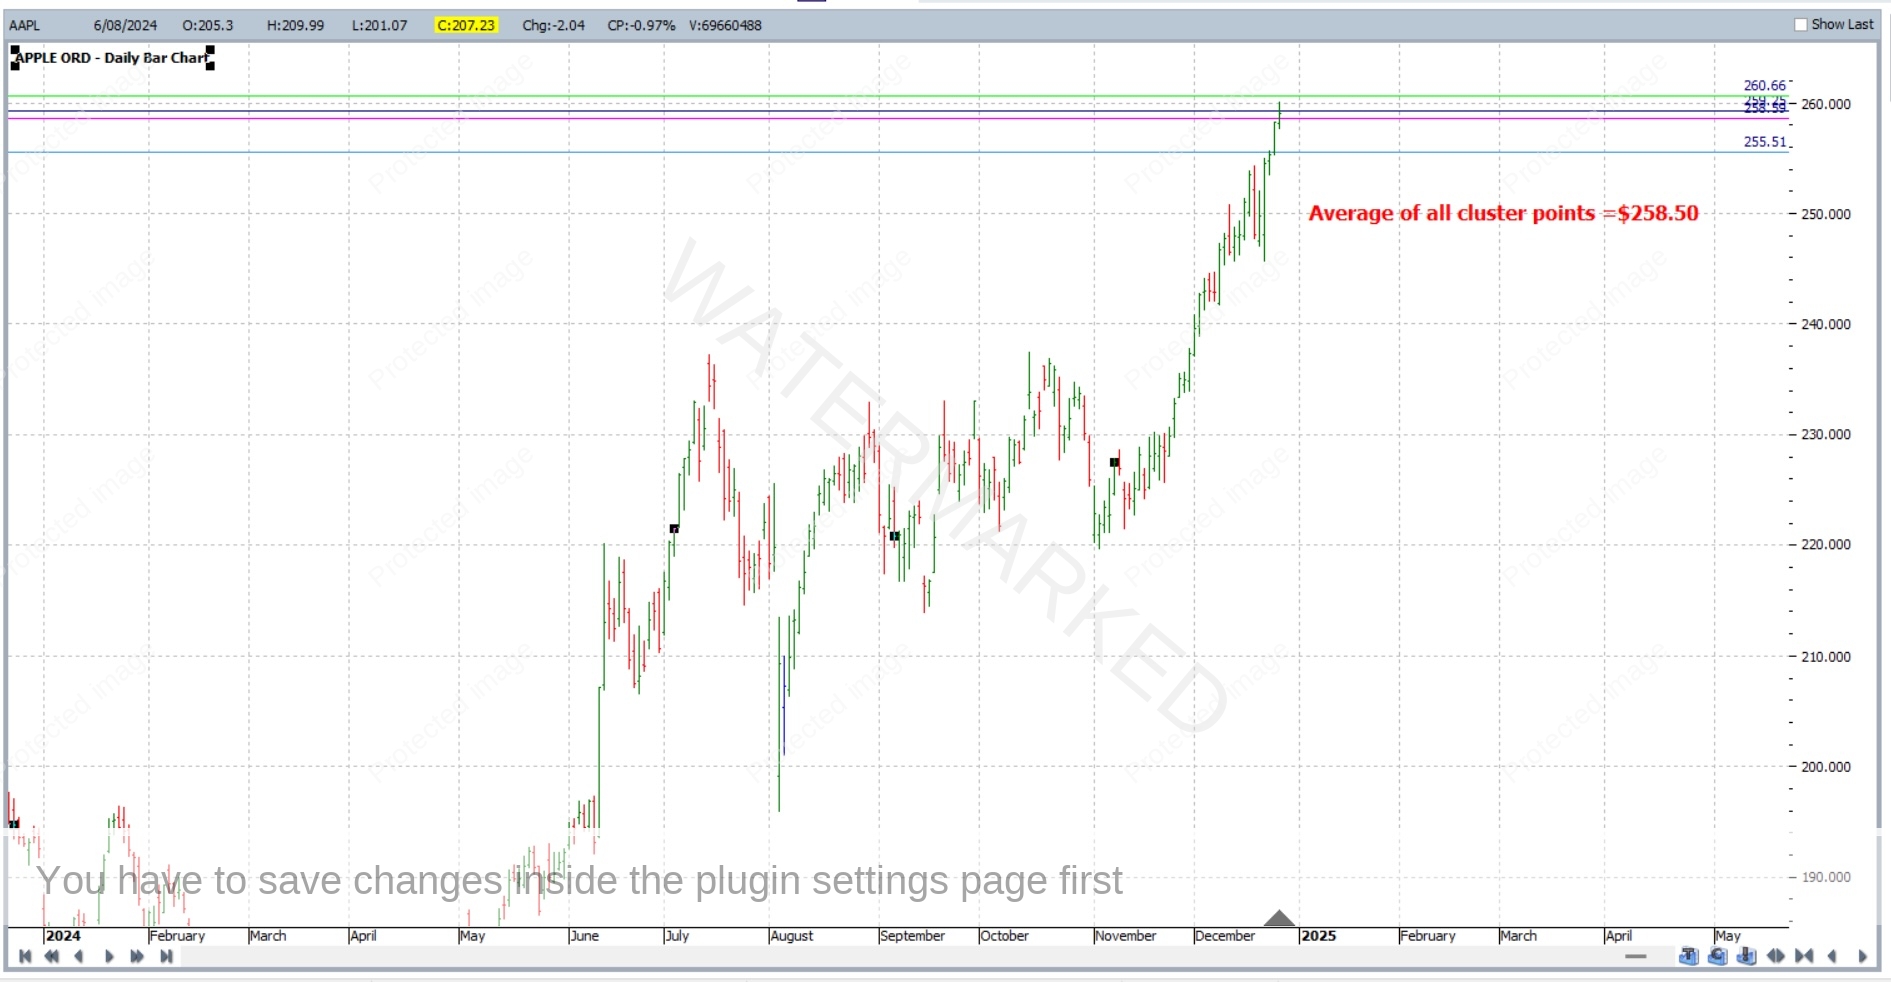
The average price of all 4 being $258.50.
While others were still recovering from the Christmas Day hangover, Apple quietly made its move, hitting the anticipated top right in the expected price cluster range on Boxing Day – 26th December 2024 at a price of $260.10 (allow slight variation depending on your data provider).
Taking an intraday look at the market, it’s interesting to note, Apple traded sideways within the range of the cluster points for some hours before making a final secondary top on the hourly chart and beginning its downward momentum.
Here’s what it looked like using intraday charts from TradingView.

When starting out, we teach our students to conduct their technical analysis on an end of day basis.
As their skills progress, many feel confident using intraday charts for their analysis and ultimately entering a trade – many of our Active Trader Program students incorporate charts such as a 4 hourly, 1 hourly, or for some, even down to a 15 minute (or smaller) chart when entering a trade. This provides a much lower risk, better entries and exponentially increasing their returns.
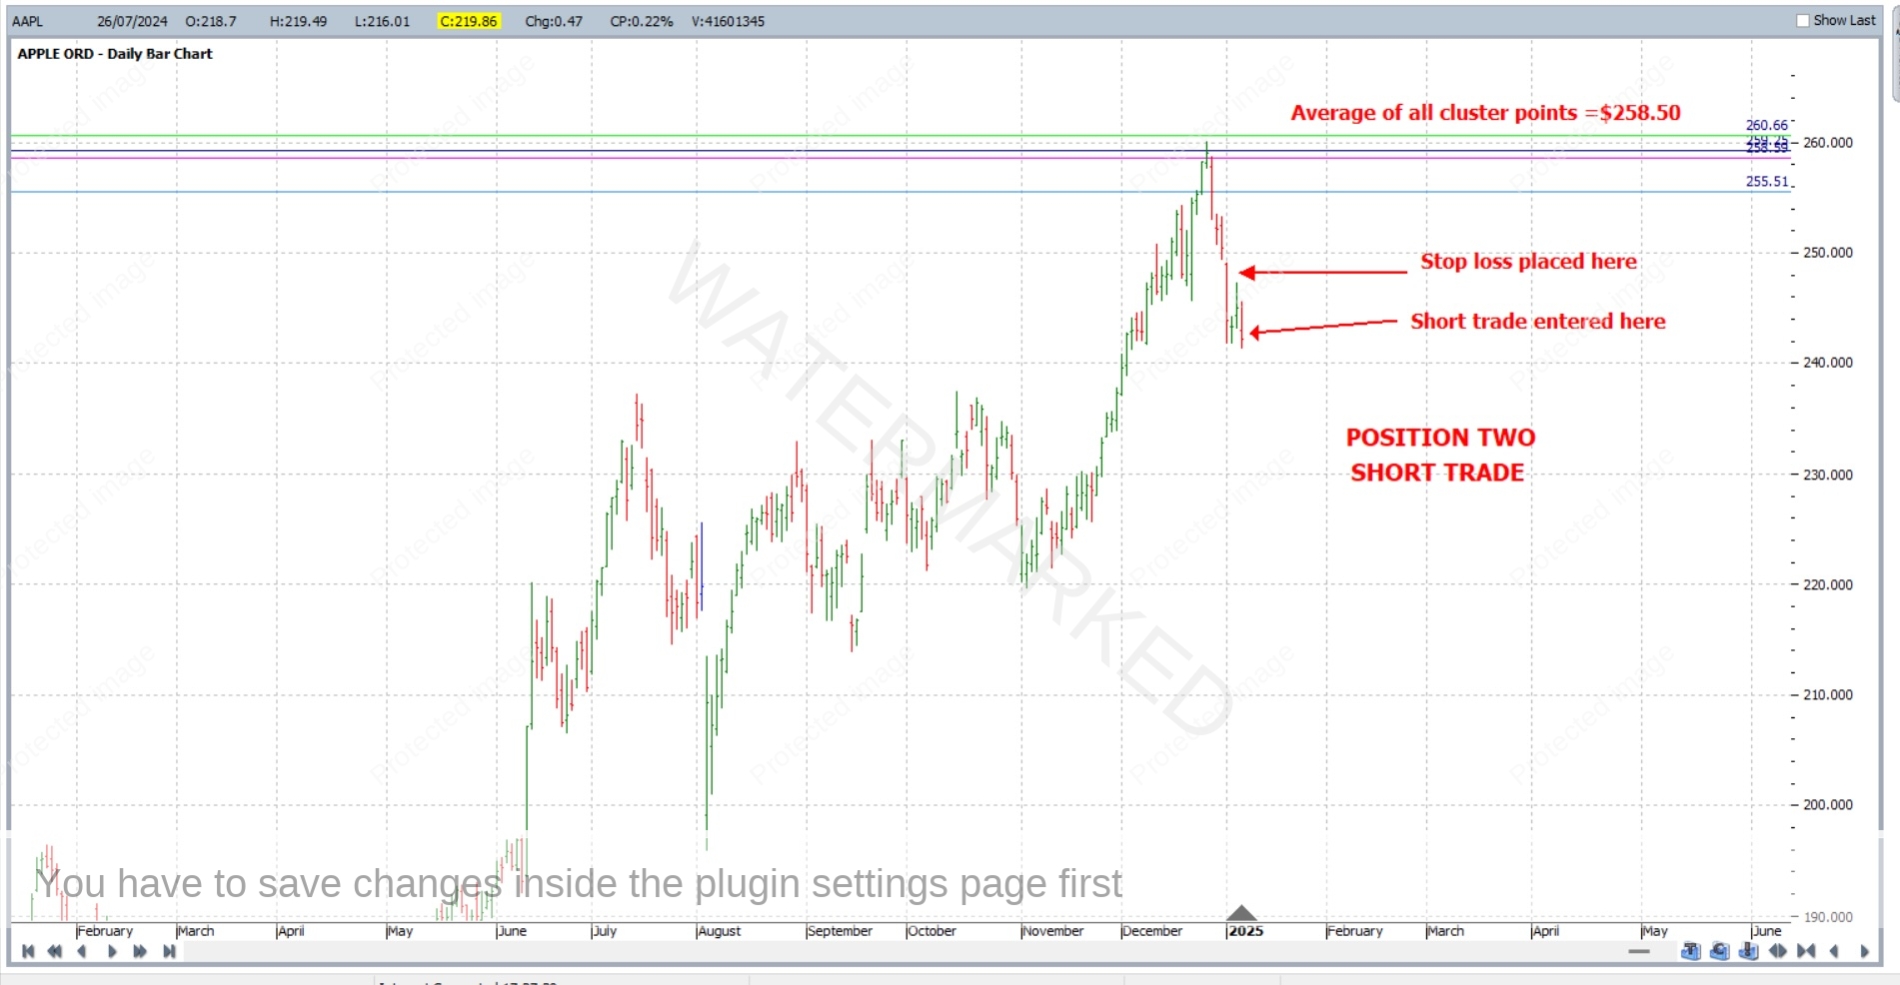
Position One
You’d be excused for missing this top on Boxing Day, however if you were watching the market during the festive season, trading off the daily chart and applying the Wheels Within Wheels method we teach, you would have entered a short trade (yes, you can make money as the market goes down too. Learn more about short trading here) on the 27th December 2024 at $257.62, with your stop loss placed behind the high at $260.11 – giving you a risk of $2.49 per share.

Position Two
By applying the technical analysis tools and further methods taken from our Active Trader Program, you could have utilised our ABC Trading Method, and would have clearly identified the market’s shift and found another opportunity to enter a short trade, further strengthening your original position.
This opportunity came in on a daily chart on the 7th January 2025 when the parameters to enter a short trade with safety (hence our name Safety in the Market!) were met and a clear signal was given to take action.
A short trade entry was made at $243.19 with your initial stop loss placed at $245.56 – giving you a risk of $2.41 per share.
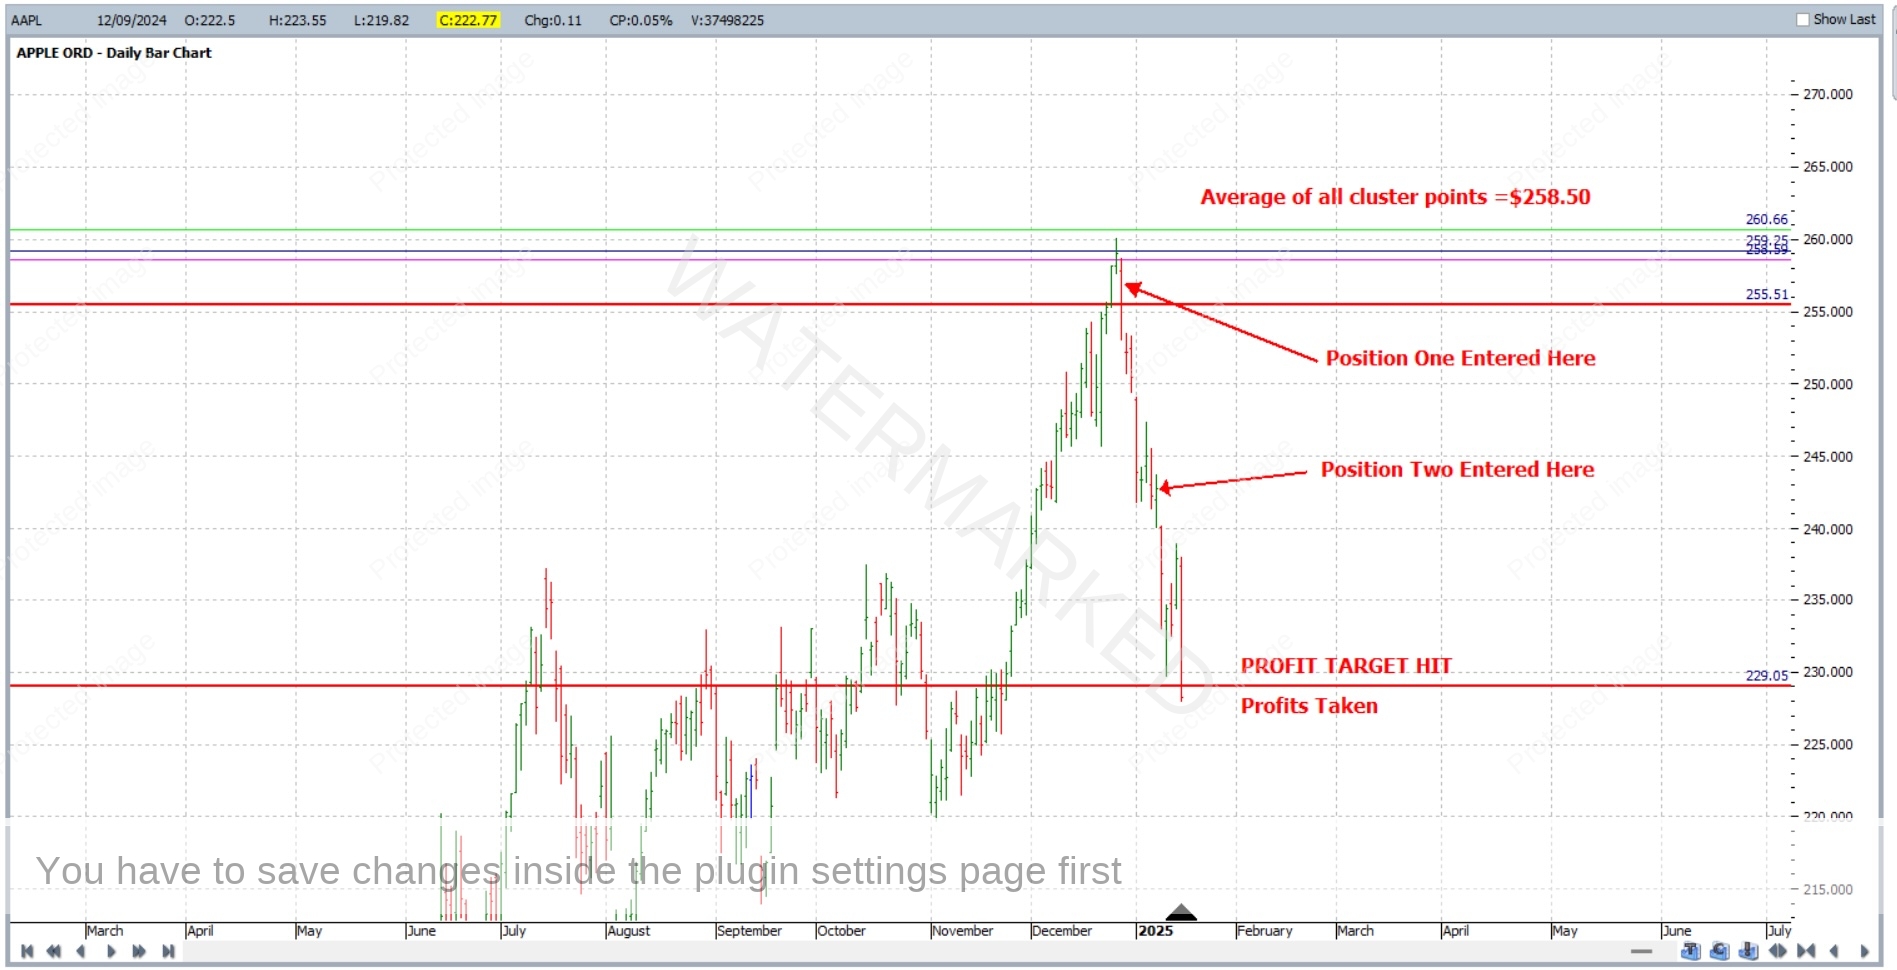
Time to lock in profits and exit
In our Active Trader Program, we teach our students many varying ways to set profit targets in advance – some more aggressive than others.
The approach used is personal to each trader and depends on their own personal trading goals and attitude to risk.
Using a relatively conservative approach would have seen profits taken at $229.05 for both positions on the 16th January 2025.
While this approach can sometimes leave further future profits on the table, there is a certain peace of mind that comes with putting your money in the bank, growing your trading account and looking for your next trading opportunity. The old adage ‘A bird in the hand is worth two in the bush’ certainly rings true in trading…
Let’s explore the potential rewards these trades offered by leveraging the power of compounding – adding to your position as you go to maximise growth.
Position One
Price Cluster/Wheels Within Wheels Method – Short Trade
Entry: $257.62
Initial Stop-Loss Exit: $260.11
Risk: $260.11 – $257.62 = $2.49 per share.
Profit Target Exit: $229.05
Profit: Entry Price – Exit Price
= $257.62 – $229.05
= $28.57 Profit per share
Reward to Risk Ratio: $28.57 profit per share divided by $2.49 risk per share
= 11.47 to 1 Return so for every $1 at risk in the trade, you made $11.47 Return.
Position Two
ABC Trading Method – Short Trade
Entry: $243.19
Initial Stop-Loss Exit: $245.56
Risk: $245.56 – $243.19 = $2.37 per share
Profit Target Exit: $229.05
Profit: Entry Price – Exit Price
= $243.19 – $229.05
=$14.14 Profit per share
Reward to Risk Ratio: $14.14 Profit divided by $2.41 risk
= 5.96 to 1 Return so for every $1 at risk in the trade, you would have made $5.96 Return.
We suggest when you are starting out in trading, you should risk no more than 2.5% of your account on any one trade, so in dollars terms:
If 2.5% of the account size was risked for both entries, the growth in account size from these trades alone would be as follows:
Trade One: 11.47 x 2.5% =+28%
Trade Two: 5.96 x 2.5% = +14%
Let’s calculate the real-dollar gains from these trades starting out with a $10,000 account as an example:
Position One
With 2.5% of a $10,000 account risked at entry, the rewards in dollar terms would be:
$10,000 x 2.5% = $250 Risk
11.47 (Reward to Risk Ratio Return) x $250 = $2,867.50
Position Two
With 2.5% of a $10,000 account risked at entry, the rewards in dollar terms would be:
$10,000 x 2.5% = $250 Risk
5.96 (Reward to Risk Ratio Return) x $250 = $1,490
Therefore total profit across both positions is $4,357.50
This trade was a conservative example, with entry into the trade being on an ‘end of day basis’ – but within 3 weeks your trading account grew by 42% total after banking profits from both positions.
What would you do with that sort of additional cash in 3 weeks?
An intraday entry using our ‘Wheels Within Wheels’ technique on an hourly chart, rather than an end of day chart, could have provided a much more aggressive entry with just 56 cents risk on trade one, and $1.66 risk on trade two, providing a much higher reward-to-risk ratio return on the trade of over 50 to 1! All within the space of 3 weeks.
However, such aggressive entries aren’t for every trader and this approach is best considered once you’ve gained a significant amount of experience.
A market top set up like this doesn’t occur on every market every day. The key lies not just in recognising the setup, but in having the patience and discipline to monitor market movements while waiting for it to materialise, often taking weeks.
The true art of trading lies in knowing how to respond when the moment arrives – calmly and without emotion. This is precisely what we teach in our Active Trader Program.
While we can’t promise profits of this scale as trading outcomes are highly individual and depend on the commitment and study each trader invests – our Active Trader Program is a complete course that equips you with the skills and tools needed to pursue, and achieve, returns of 10 to 1 – or even greater – in your trading, just like many of our other Active Trader Program students have. You can read their many testimonials here.
If you’d like find out more about our Active Trader Program – here’s all the details