We’re Not There Yet
2025 is off with a bang and certainly not a whimper. Any thoughts of an orderly year have been thrown aside as each day we awake to the impact of the new US administration and how its agenda impacts the real economy and of course the markets that we invest and speculate in. The cycles of Governments of all persuasions are an overlay on the broader markets, no doubt there are cycles that we can measure, the fixed term in the US makes the timings very predictable but there is no doubt the Presidential election cycle is one we must monitor.
As I pen this article the spectre of inflation and especially US centric inflation has again become a talking point. Eggs and energy are driving US inflation marginally higher, and this will have a material impact on currencies and commodities before we start to dive into the more micro of individual markets. Then of course we have seen the sabre of tariffs being raised and we could be forgiven for thinking there are some more lessons to come on inflation.
Why inflation matters so much is that it fundamentally changes the risk profile of markets as hard goods can run away in terms of pricing, and this impacts the price of stocks (generally in a bearish way and interest rates are used as a blunt tool to get the genie back in the bottle). The lowering of rates may have seemed a foregone conclusion for 2025, but those sands are shifting.
The rising inflation has had a significant impact on commodity prices, with Crude Oil being one of the most prominent examples historically. As inflation accelerates, the cost of production, transportation, and labour increases, driving up the price of Crude Oil. This inflationary pressure is often exacerbated by factors such as geopolitical tensions, supply chain disruptions, and fluctuations in demand. The recipe is a well know one and we seem to have several factors that could all lock in together to deliver the finished product. It’s no surprise that we start this year with a deep dive on Crude.
Chart 1 looks at what we know on a larger picture and a twist on the Time/Price relationship. The run up in the Covid rally was 784 days, the true top on 14 June 2022 saw the pullback to the 50% level and we have seen a generalised sideways pattern. Note time has run 125% (973/784) and the price has not been able to close under 50%. This to me suggests the bulls are in control at this 50% level.
Of interest to me as well is the time frame that is closing on 975 days. For many years the low of 1986 at $9.75 held and I have used this price as a time frame to assist in confirming clusters.
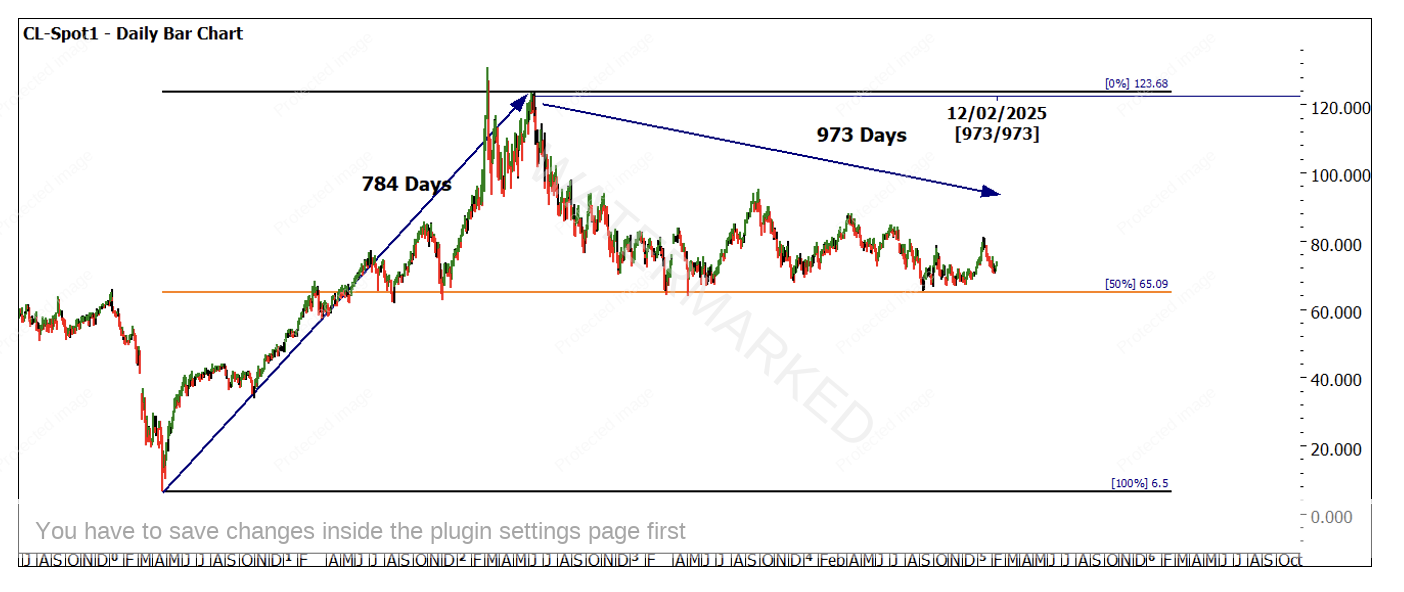
Chart 1 – Daily Bar Chart CL-Spot1
One of the important tests of any time frame and one that I encourage all traders to do is test and retest the number 975, it may not instantly jump out as important, but I encourage you to think laterally in its application. More on that in coming articles.
If you are looking for a move in a particular direction in US Dollar denominated currencies, we would like to see a signal that supports the opposite direction in the USD. Chart Two is some loose analysis on the DX and why there is some basic price and time harmony at the current January high. The cycle of 270 Degrees and 540 degrees has helped in previous turns.
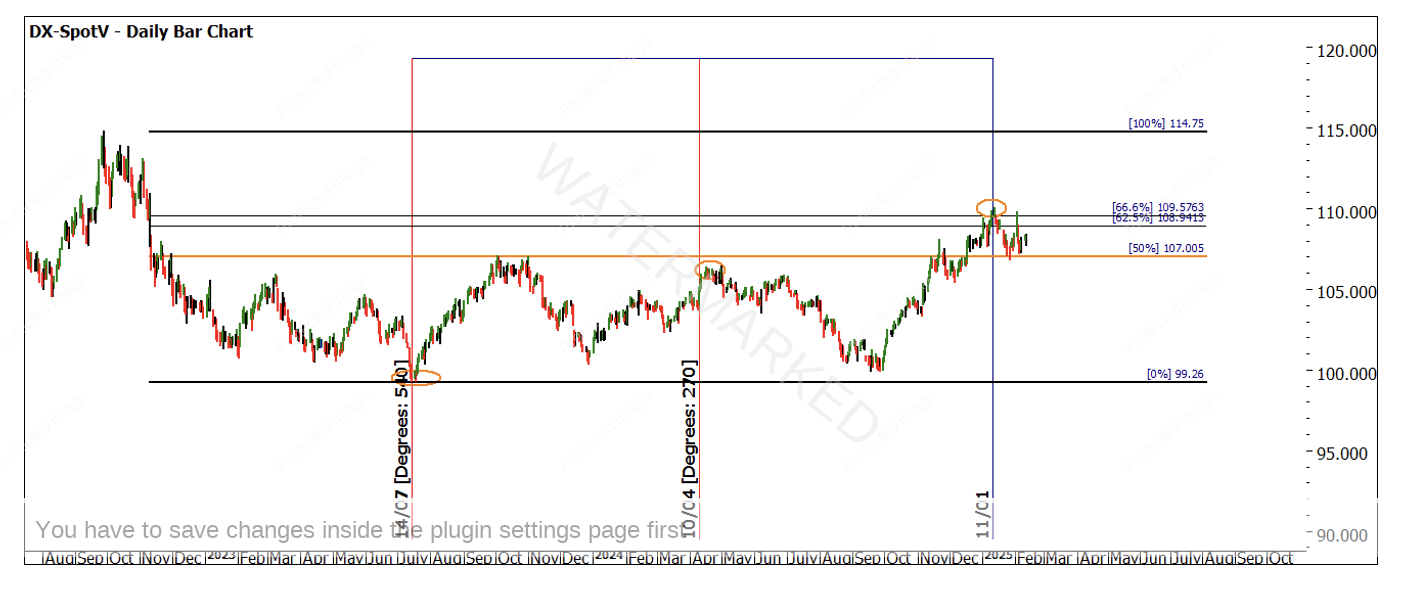
Chart 2 – Daily Bar Chart DX-SpotV
I am always watching the 360 as Gann referred to it as a Master Chart. The DX is working well if we are loosely anchoring to the current top. Both 360 weeks and 720 weeks have offered some areas to zoom in on.
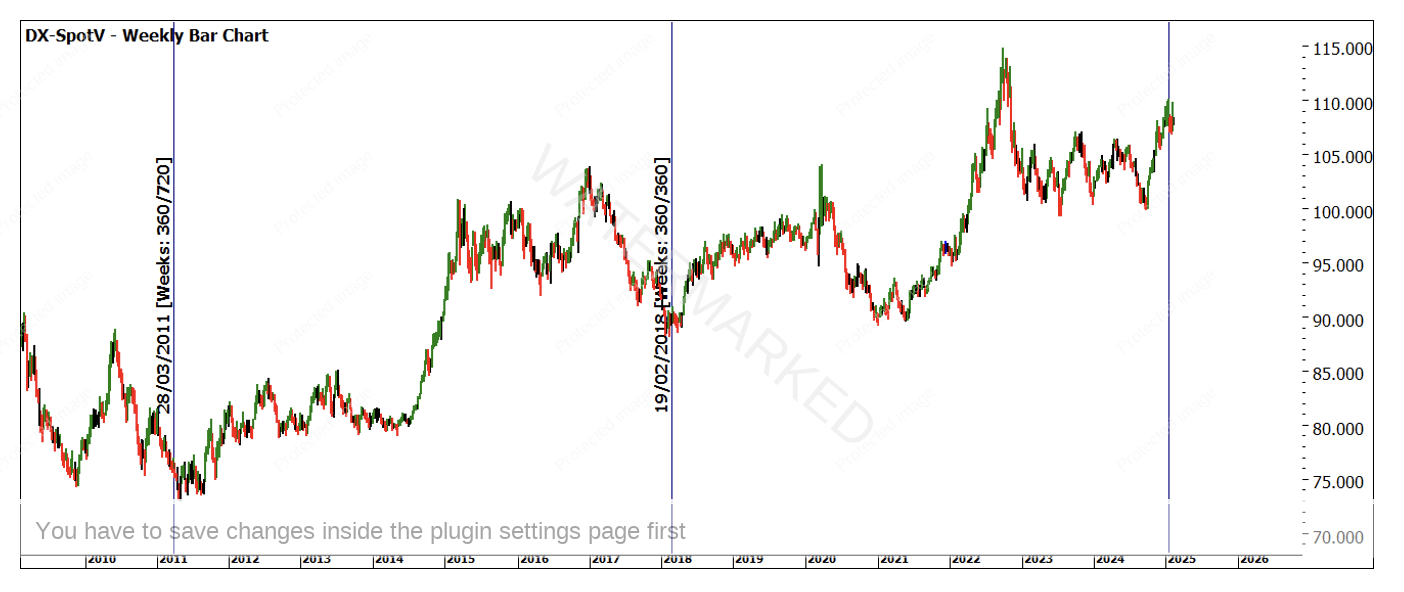
Chart 3 – Weekly Bar Chart DX-SpotV
It would be a perfect overlay if we saw the same scenarios on Crude or other commodities, but the puzzle is not always that clear cut. Chart 4 shows the current position of the 360 chart on Crude with the 90 week and 180 week alignments more prominent.
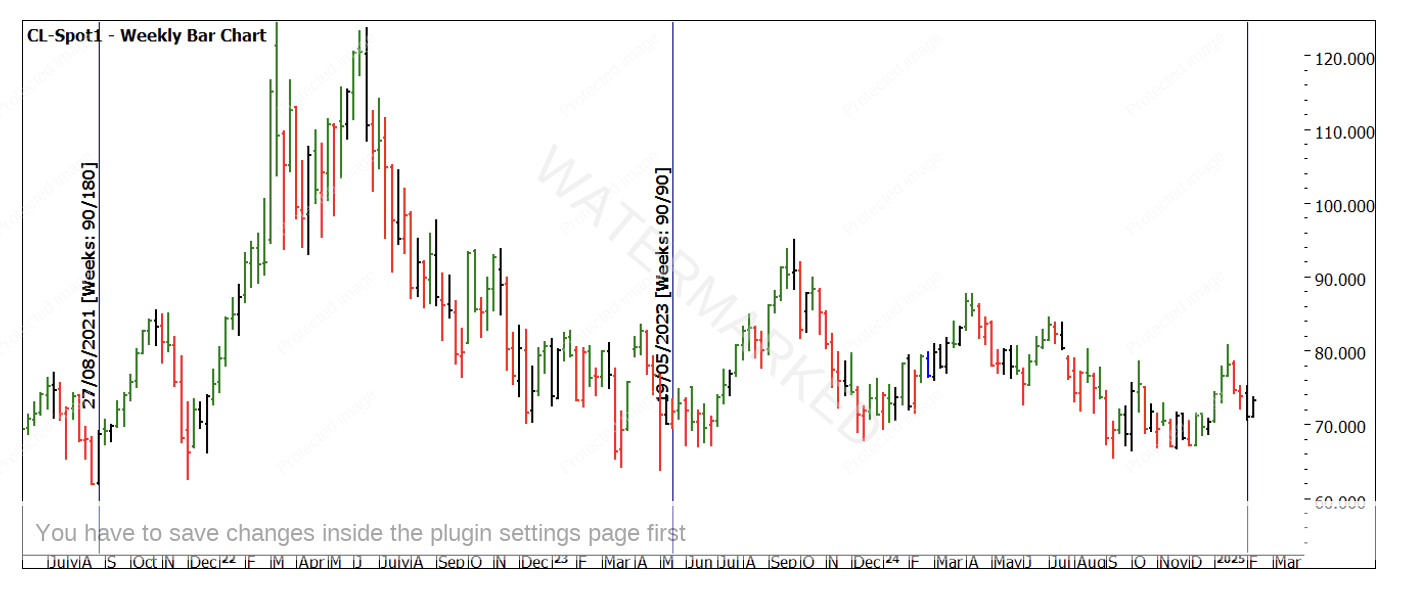
Chart 4 – Weekly Bar Chart CL-Spot1
It’s important to note that this does not replace the small picture work and that individual markets can move to a different rhythm, I would say though aligning the GI-Spotv (essentially an index of commodities all denominated in USD) can be of assistance.
We could also take the time to look at Master Time Cycles and the like to help create a road map for the year ahead. Regardless of your approach, the limited time we have seen in 2025 suggests volatility and markets being exposed to more challenging intervention. As noted, a study of inflation and how markets react (especially the second bump after the initial move in inflation) could be an interesting study.
Good Trading
Aaron Lynch