A Swag of Price Milestones
Every so often the market gives you a near perfect price cluster which is what we have just seen on the SPI200 with the 14 February top of 8581.
This is what I would call the Gold Standard of price clusters. It might not necessarily be a quarterly or yearly top, but it is at a minimum a weekly top and could potentially be a monthly top.
Let’s break it down piece by piece so by the end of the article you should have no problems recreating this price forecast. The great thing about price forecasting is it is stand alone. You don’t need timing technique or anything else to have called and traded this.
Using Walk Through Mode in ProfitSource I can take you through how I saw it as it came together using the ‘Wheels Within Wheels’ approach.
On 31 January the SPI made a top on a monthly 50% milestone at 8538. However, there was a real lack of any other milestones lining up here.
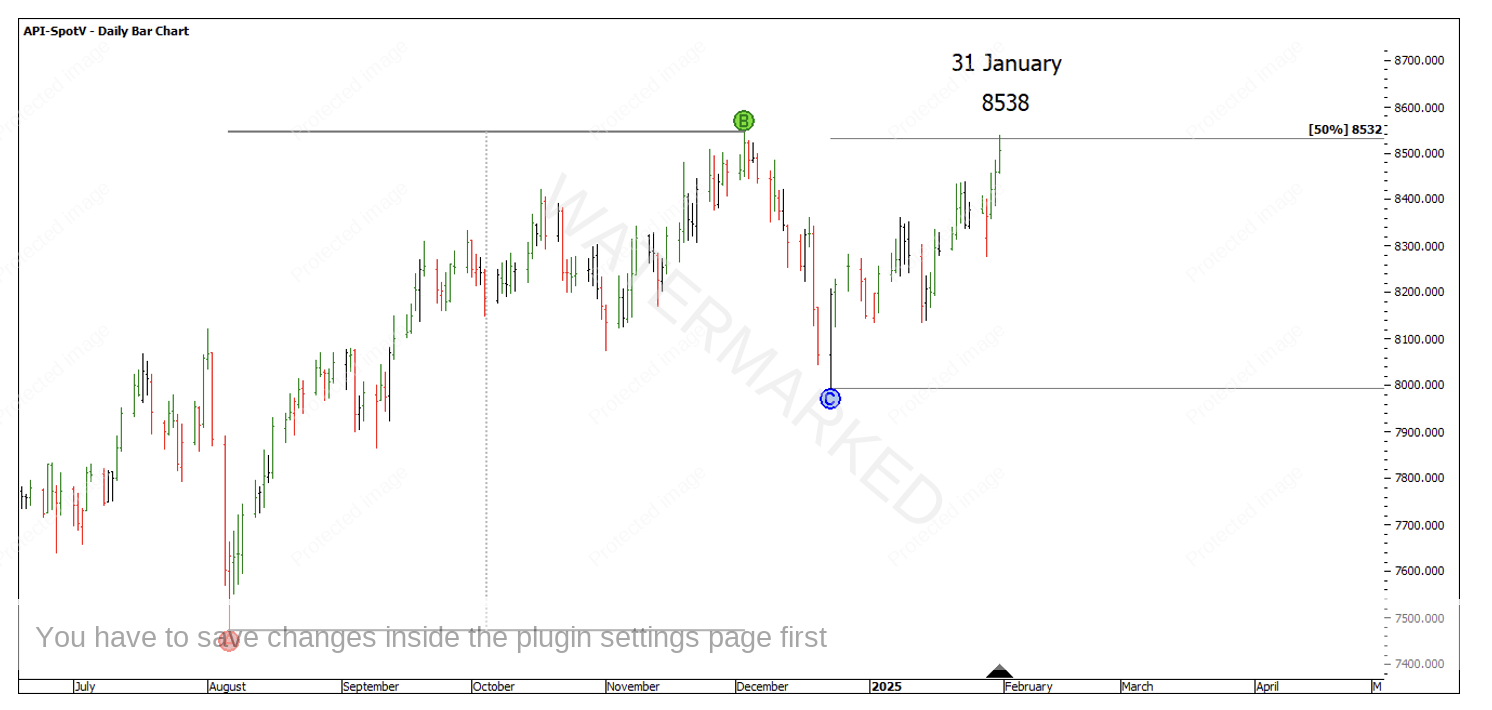
Chart 1 – Monthly 50% Milestone
The First Range Out from the 23 December low showed the 150% milestone at 8565.5.
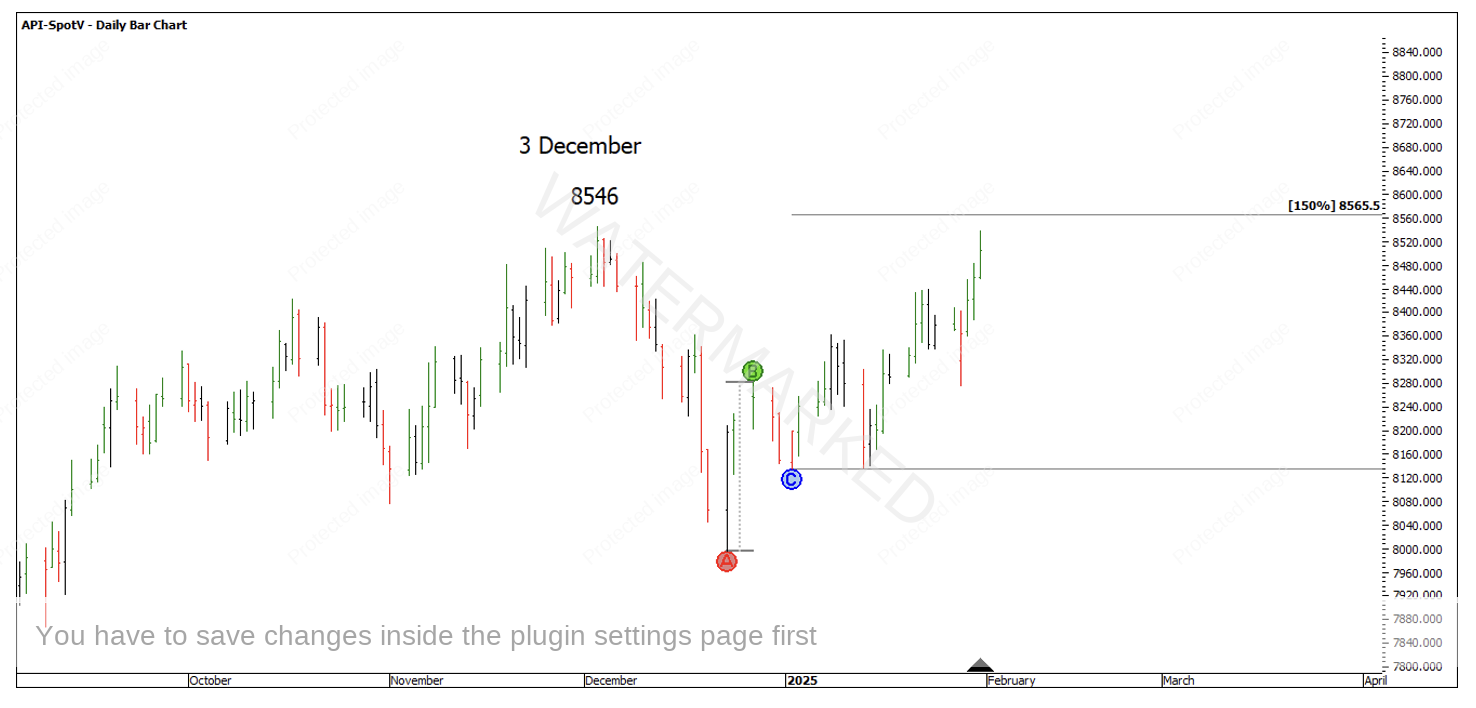
Chart 2 – Daily First Range Out
Or, two multiples of the First Range Out gave a price target of 8569, just 13 points through the 3 December top at 8546.
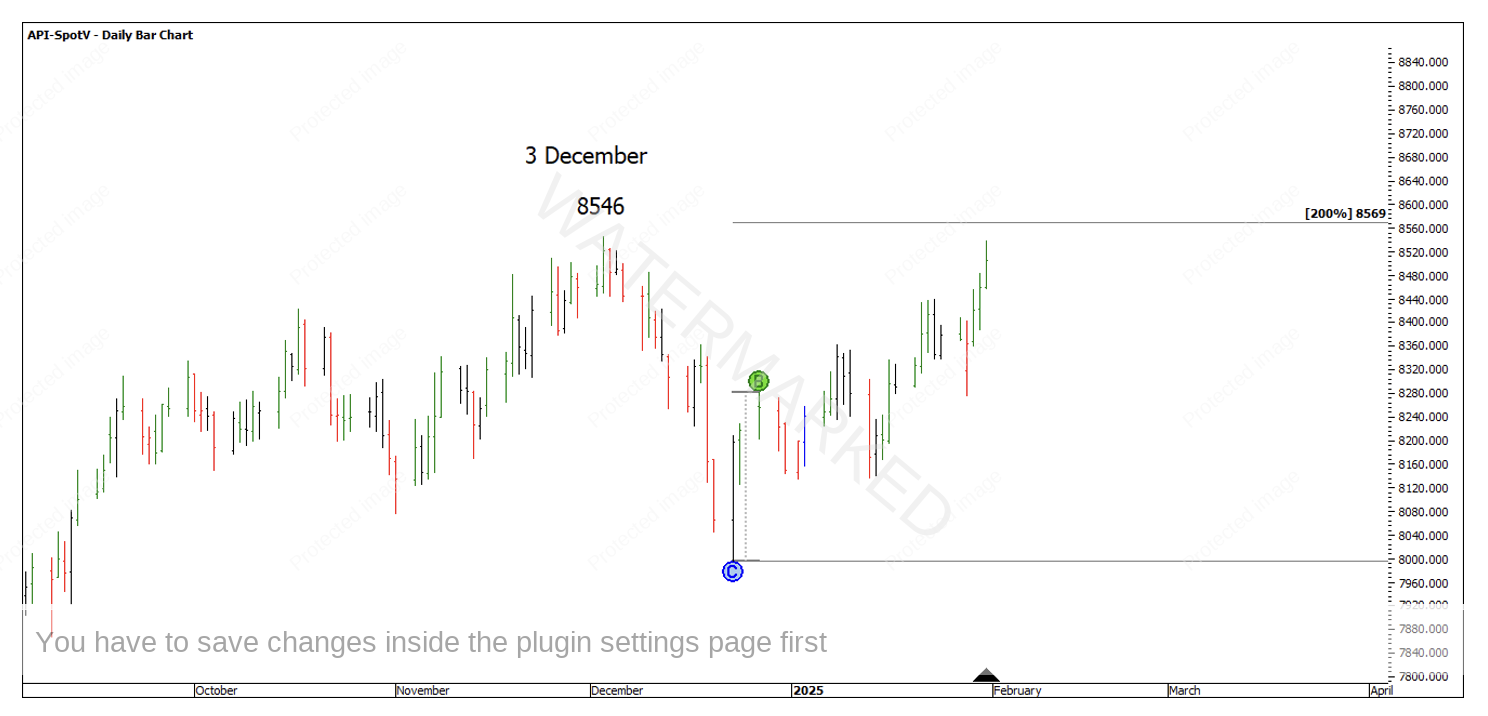
Chart 3 – Multiples of the First Range Out
If you put on the weekly swing overlay, there was a repeating weekly swing range with the 100% milestone at 8579. This would make it three weekly swings into a false break double top.
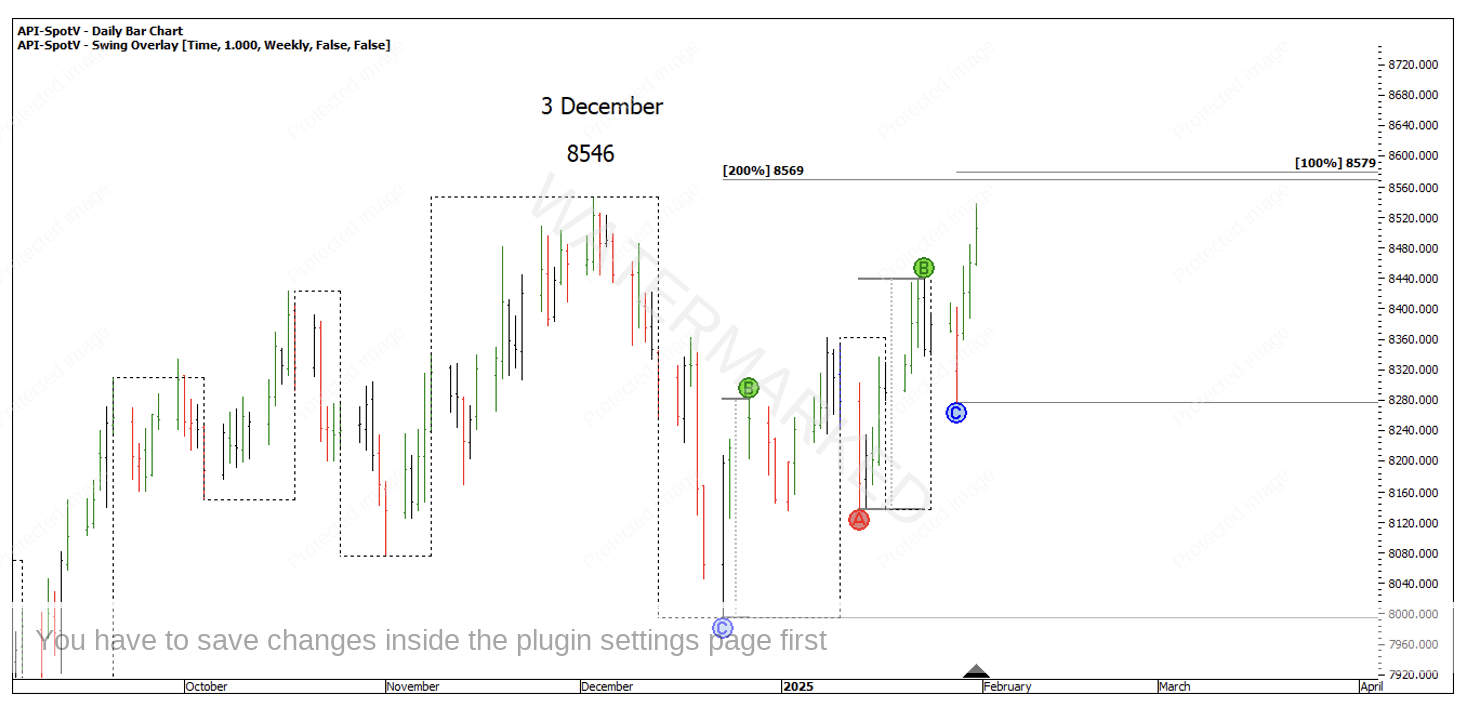
Chart 4 – Weekly Swing Repeat
We saw a daily swing pull back into the 3 February swing low with a 100% repeat at 8568.
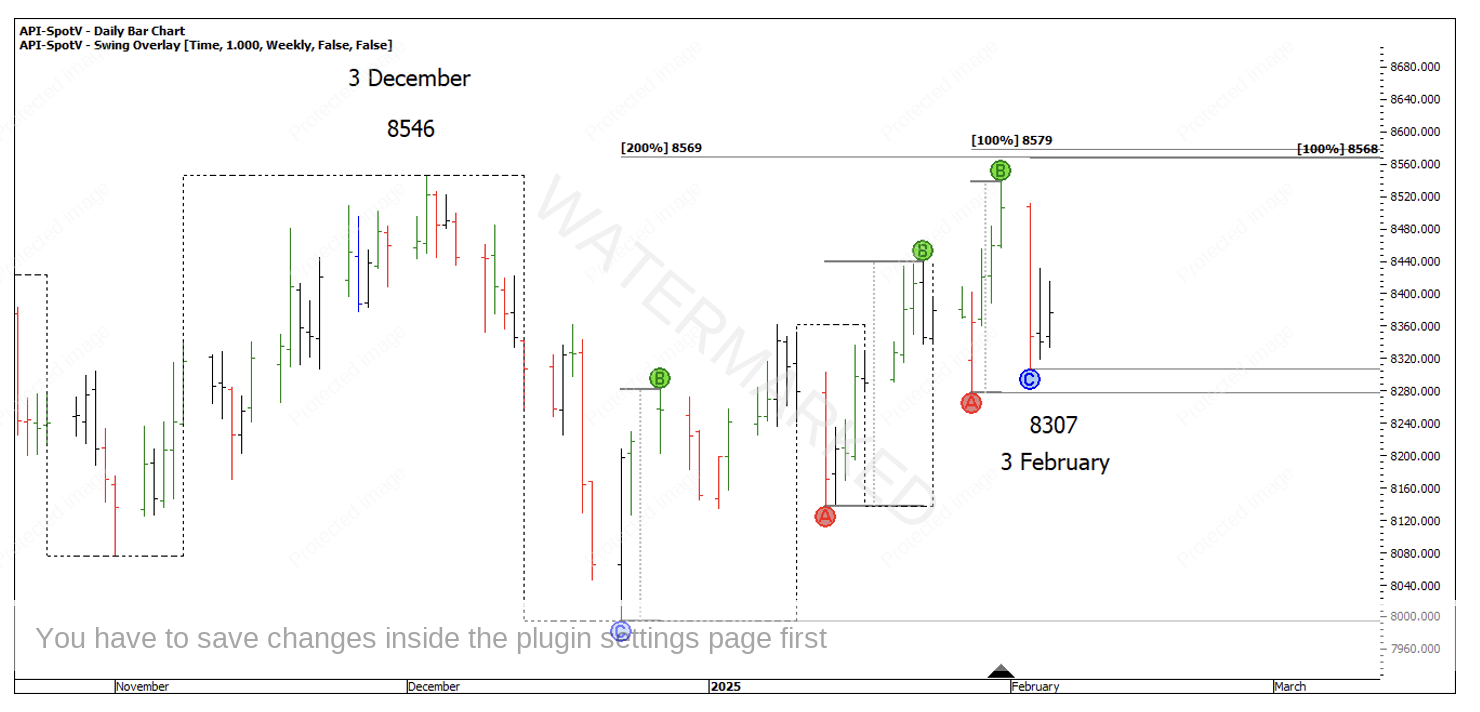
Chart 5 – Daily Swing Repeat
From the 3 February low, 200% of the 4-hour First Range Out also lined up with the cluster at 8569. This is where the possibility of a false break double top really started to feel like a potential trade.
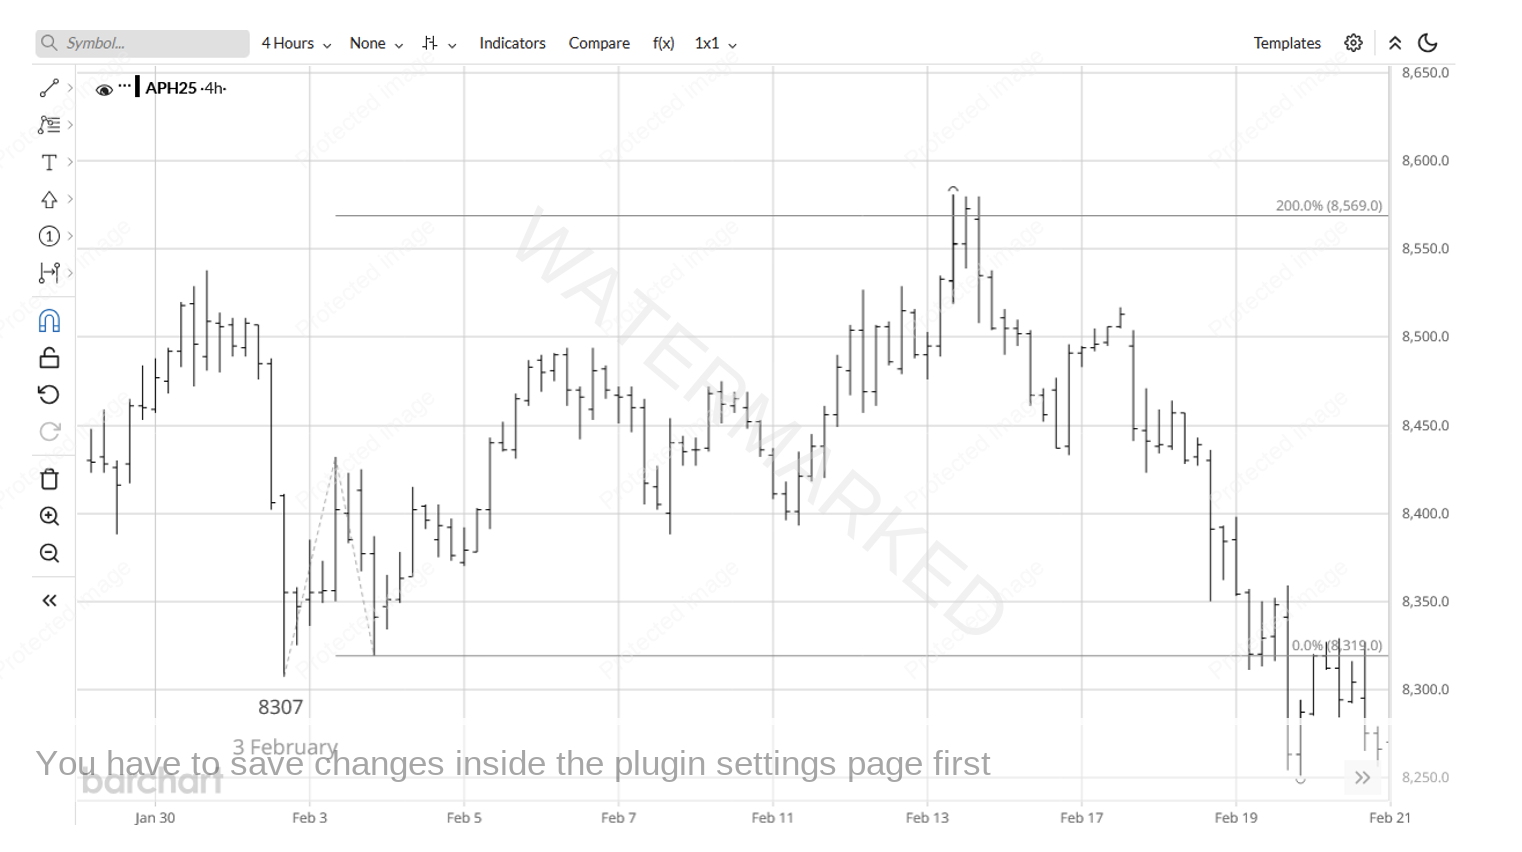
Chart 6 – 200% of the 4 Hour First Range Out
Fast forward a couple of days to 12 February and another daily swing low gave a 100% daily swing milestone at 8580.
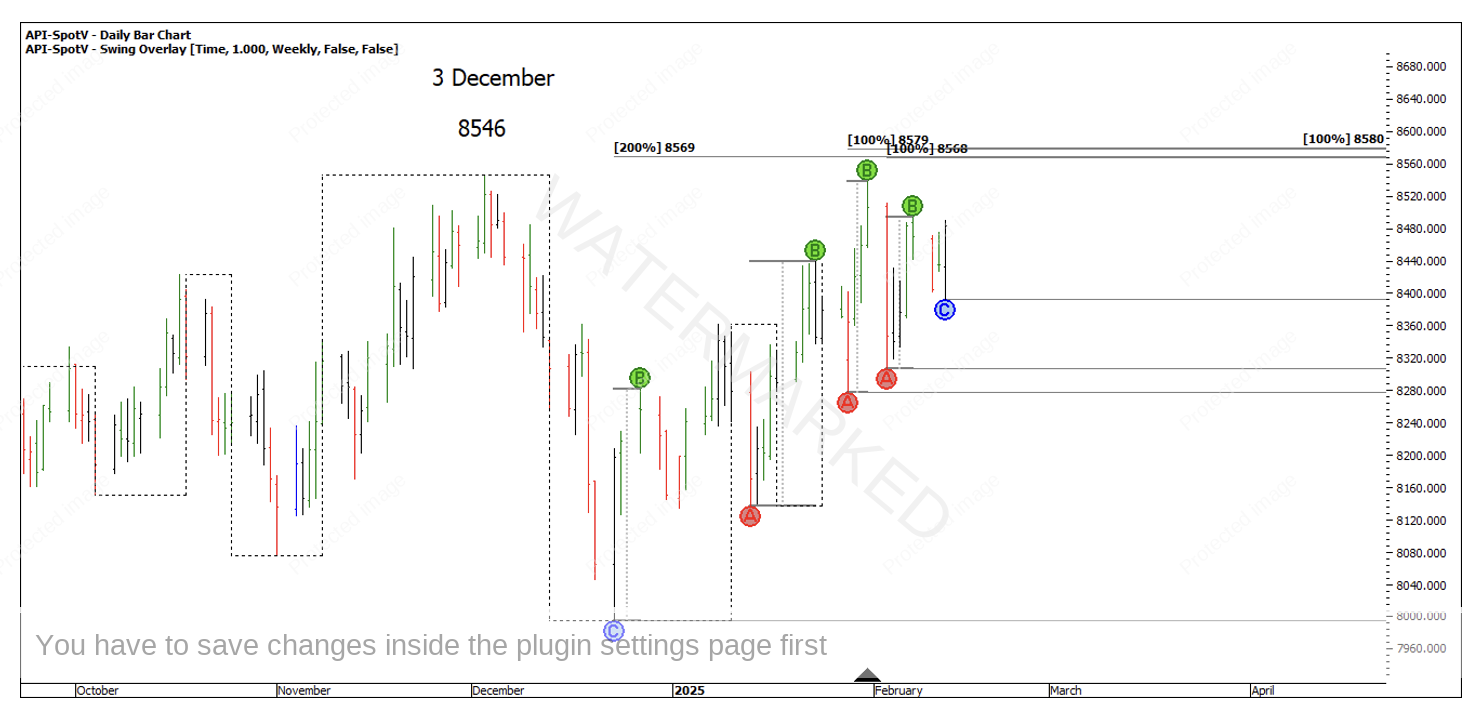
Chart 7 – Daily Swing Repeat
Although, there was a slight data issue here I believe, as this last daily swing low was actually made on 10 February at 8388 not 12 February 8393. So, the above daily swing 100% milestone should have been 8575 not 8580 as you can see in the chart below.
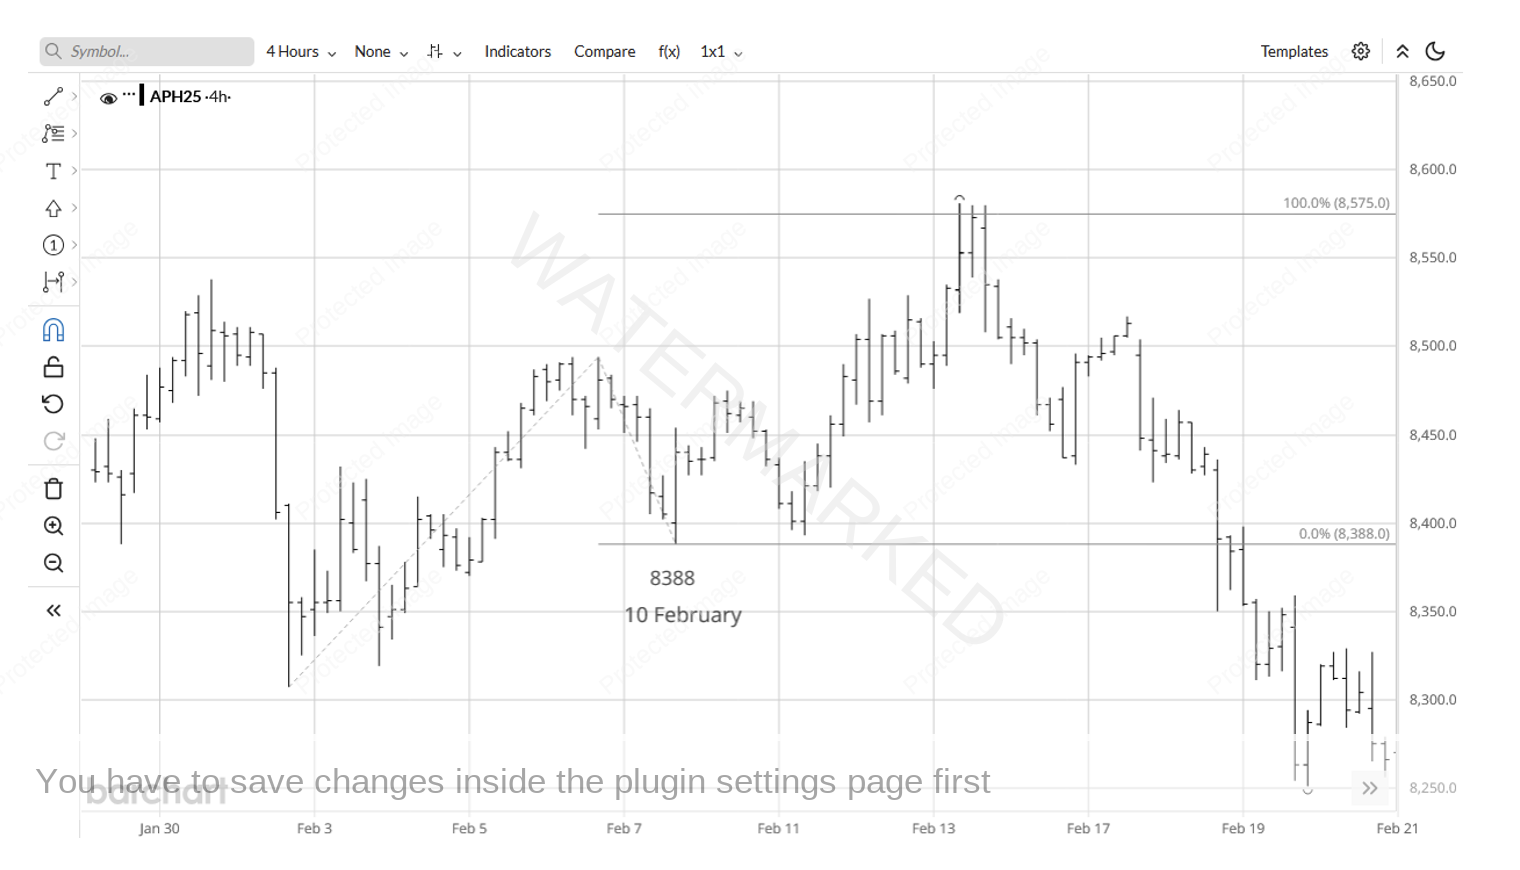
Chart 8 – Actual Daily Swing Low
Funny enough the 4-hour First Range Out of this daily swing gave the 200% milestone at 8567!
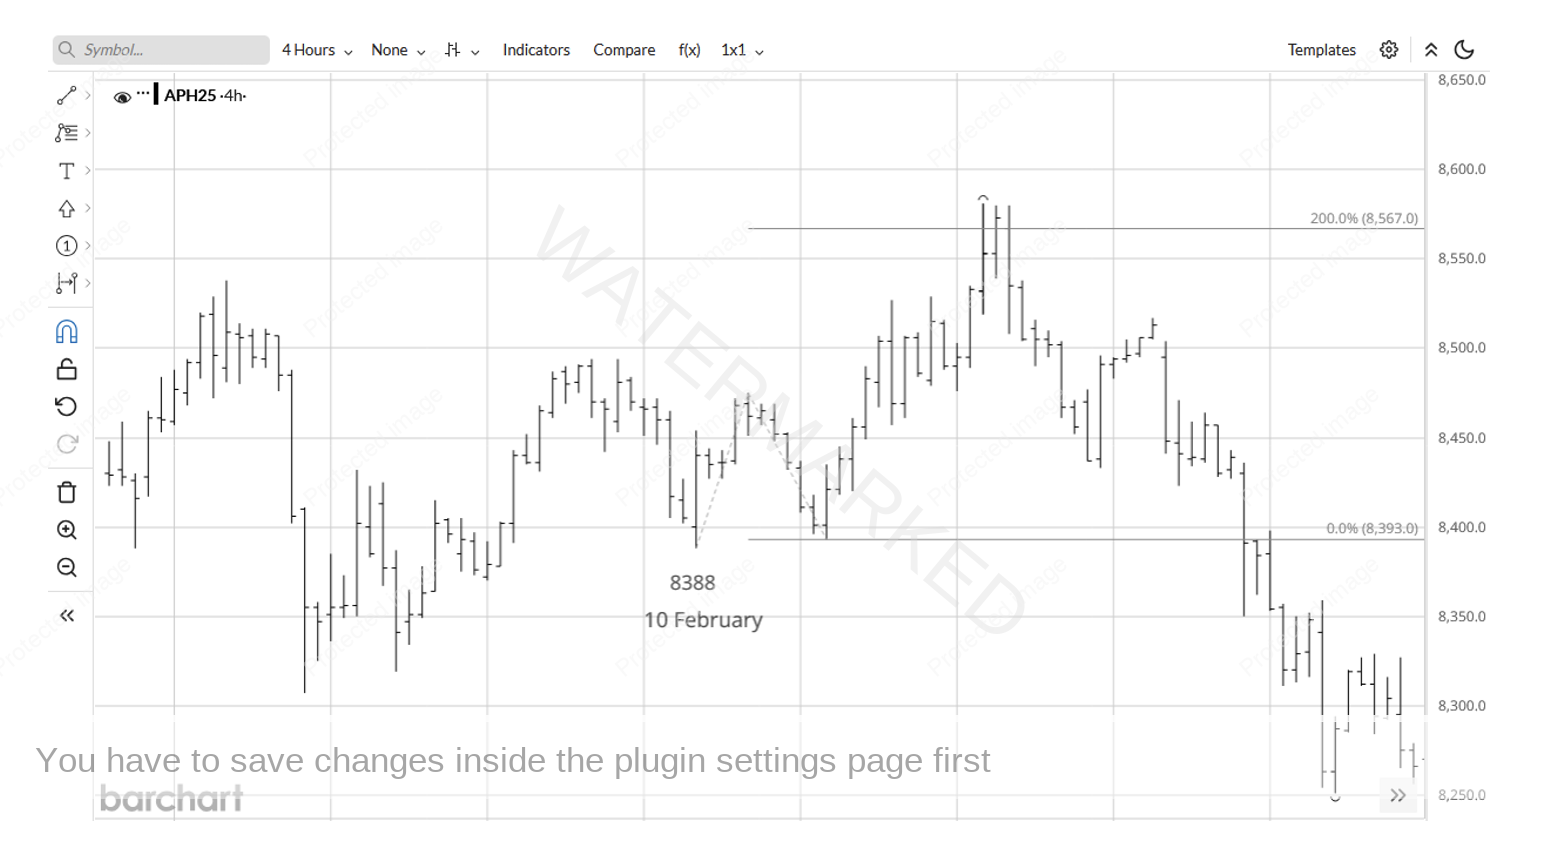
Chart 9 – 200% of the 4 Hour First Range Out
Then, 200% of the last 4-hour range up from the little double bottoms gave a price target of 8576.
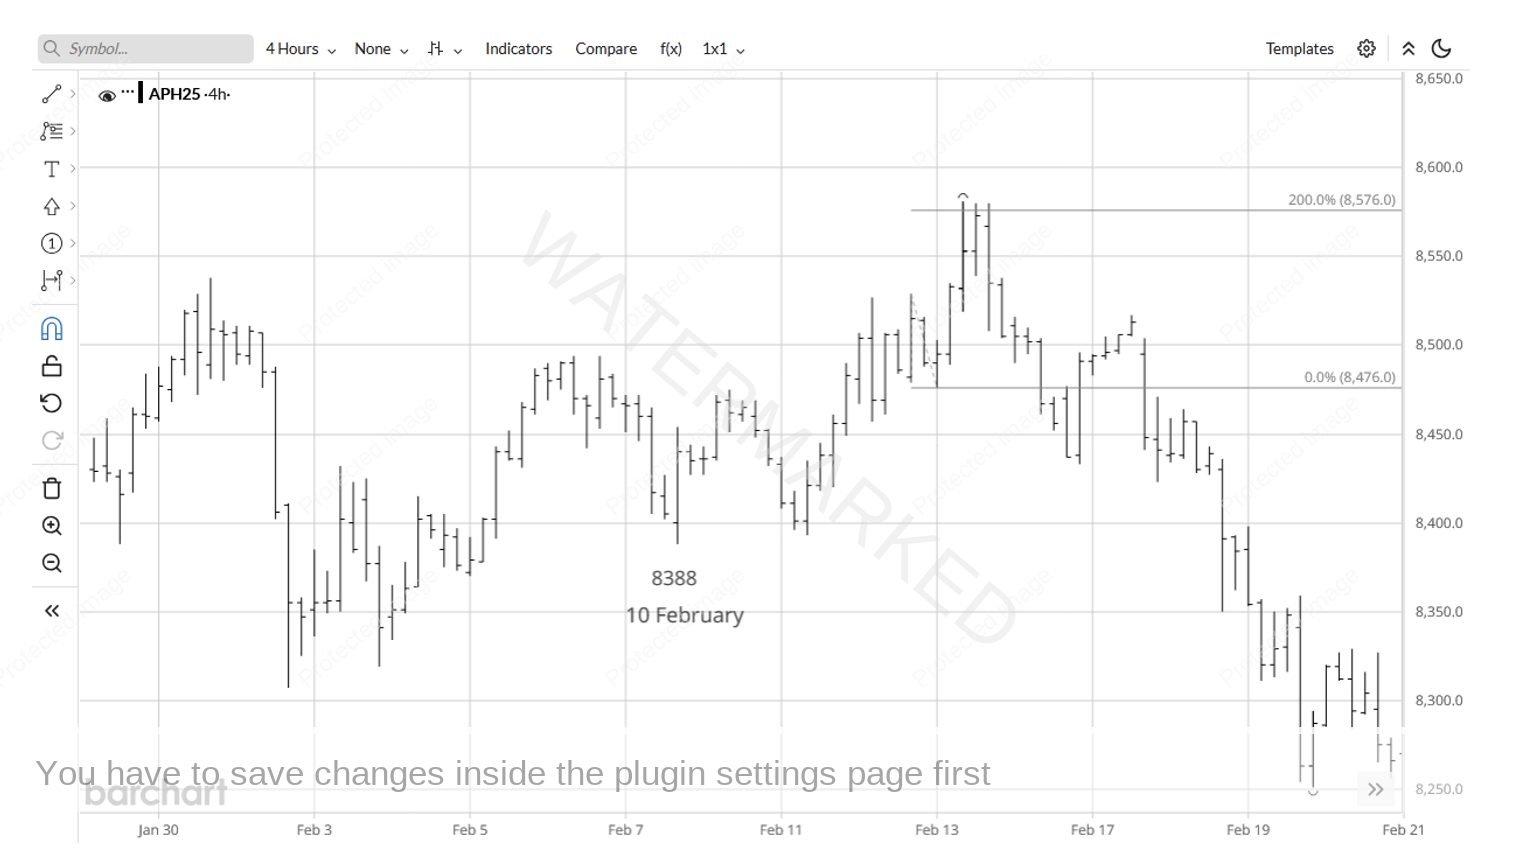
Chart 10 – 4 Hourly Double Bottom Milestones
Looking at the last 4-hour range into the top from the double bottoms, the 1-hour First Range Out gave a 200% target of 8580, within 1 point of the top!
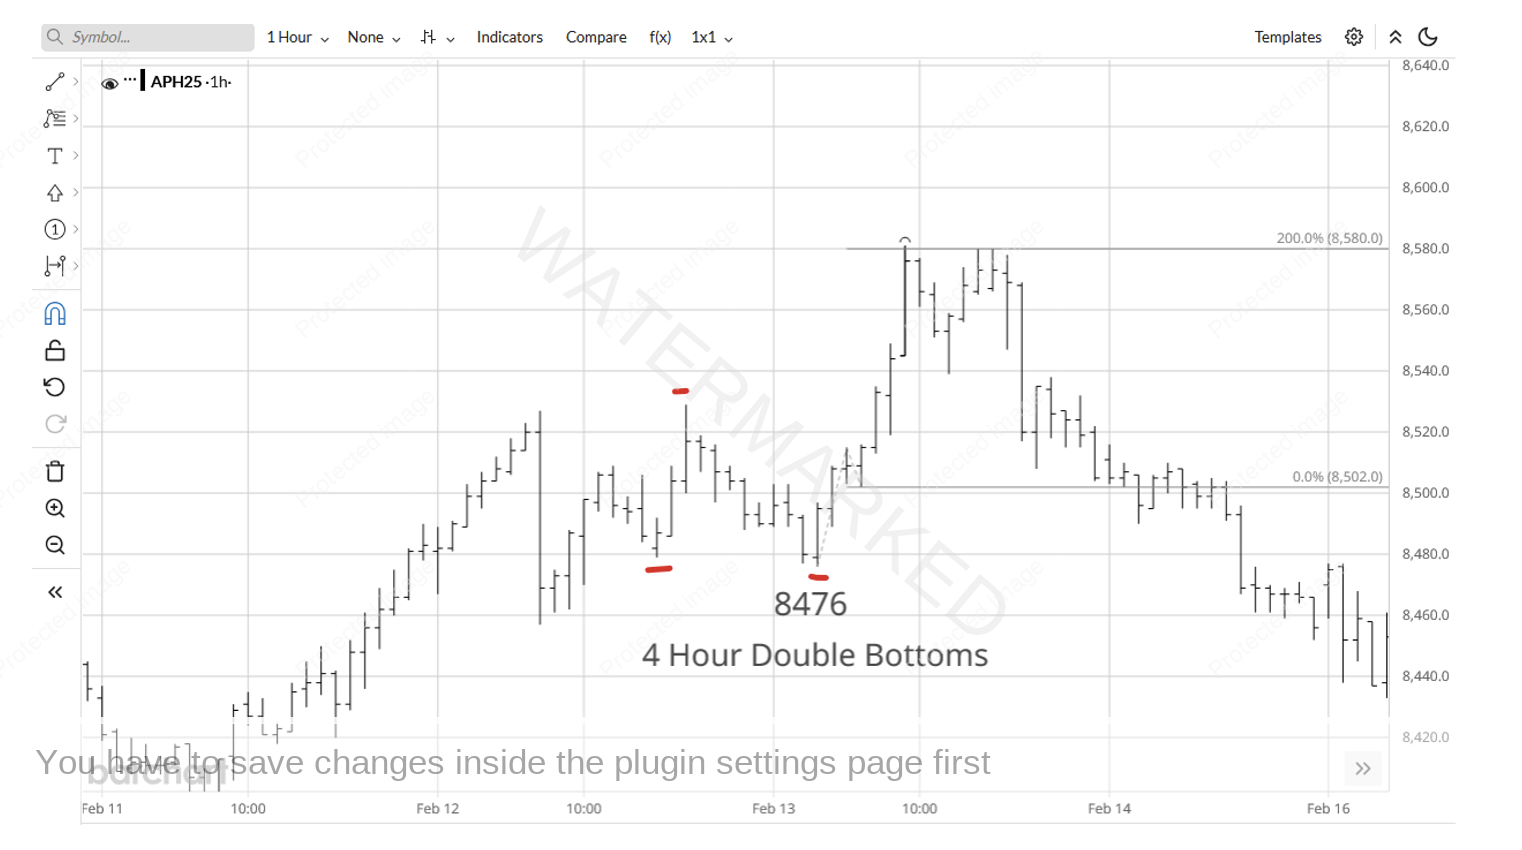
Chart 11 – 200% of the 1 Hour First Range Out
How many milestones does there need to be!
The extreme high was made during the night session however you would have woken up and seen that the 1-hour swing was at double tops on the 50% milestone of the last 1-hour swing up.
If you had entered as the 1-hour swing turned down at 8565 you could have had an entry with roughly 13 points of risk and entering just below the lowest number of this cluster.
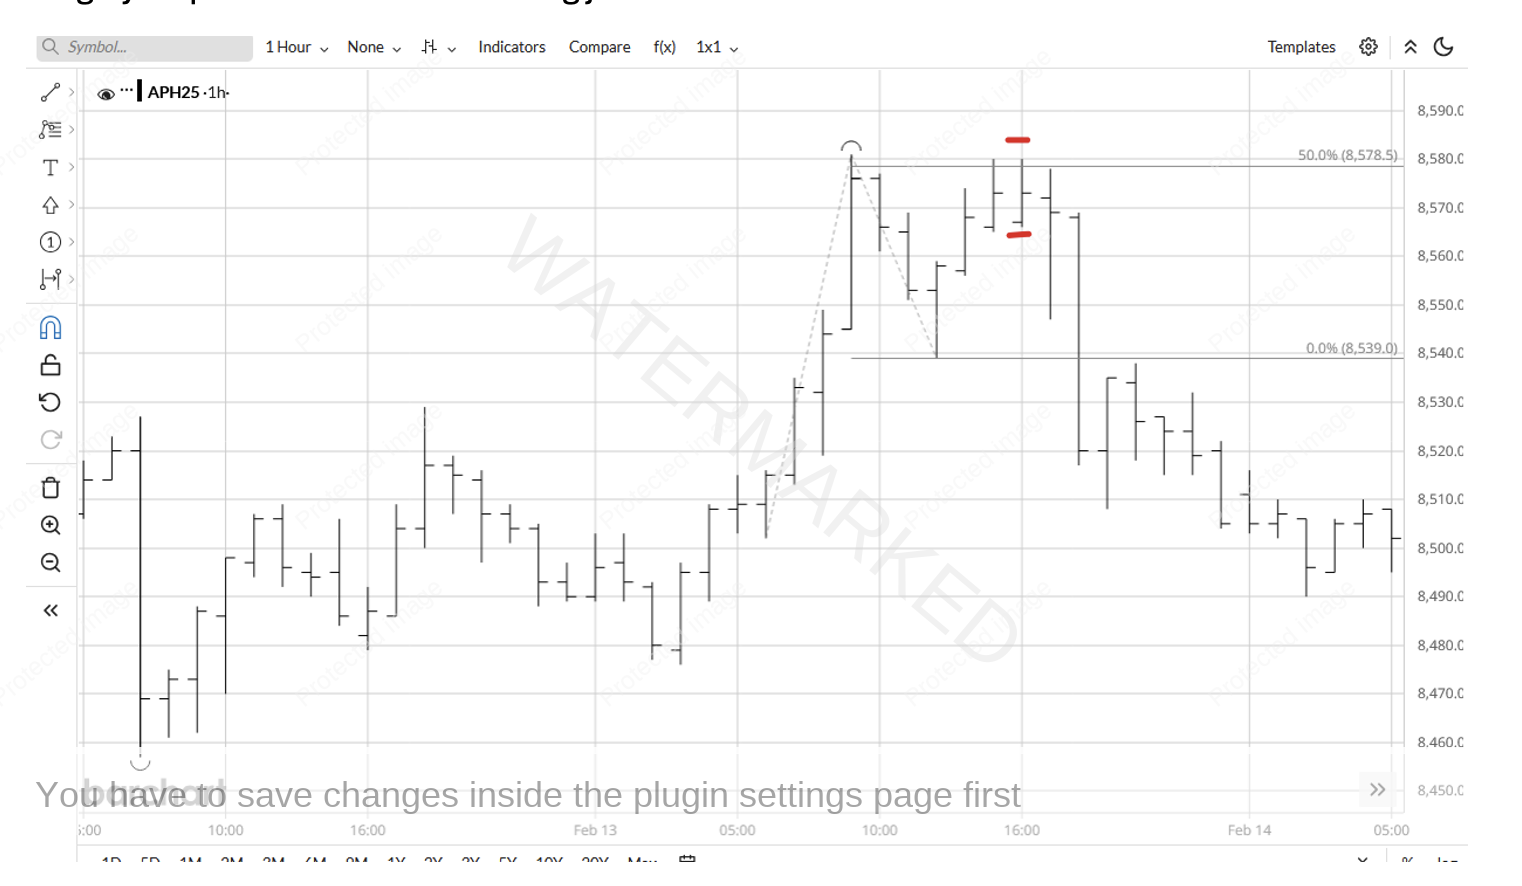
Chart 12 – Failure at 50% and Entry Bar
Even if you had taken profits at 200% of the last weekly swing down at 8257, you would have banked around 18 to 1 in just one week on the one position.
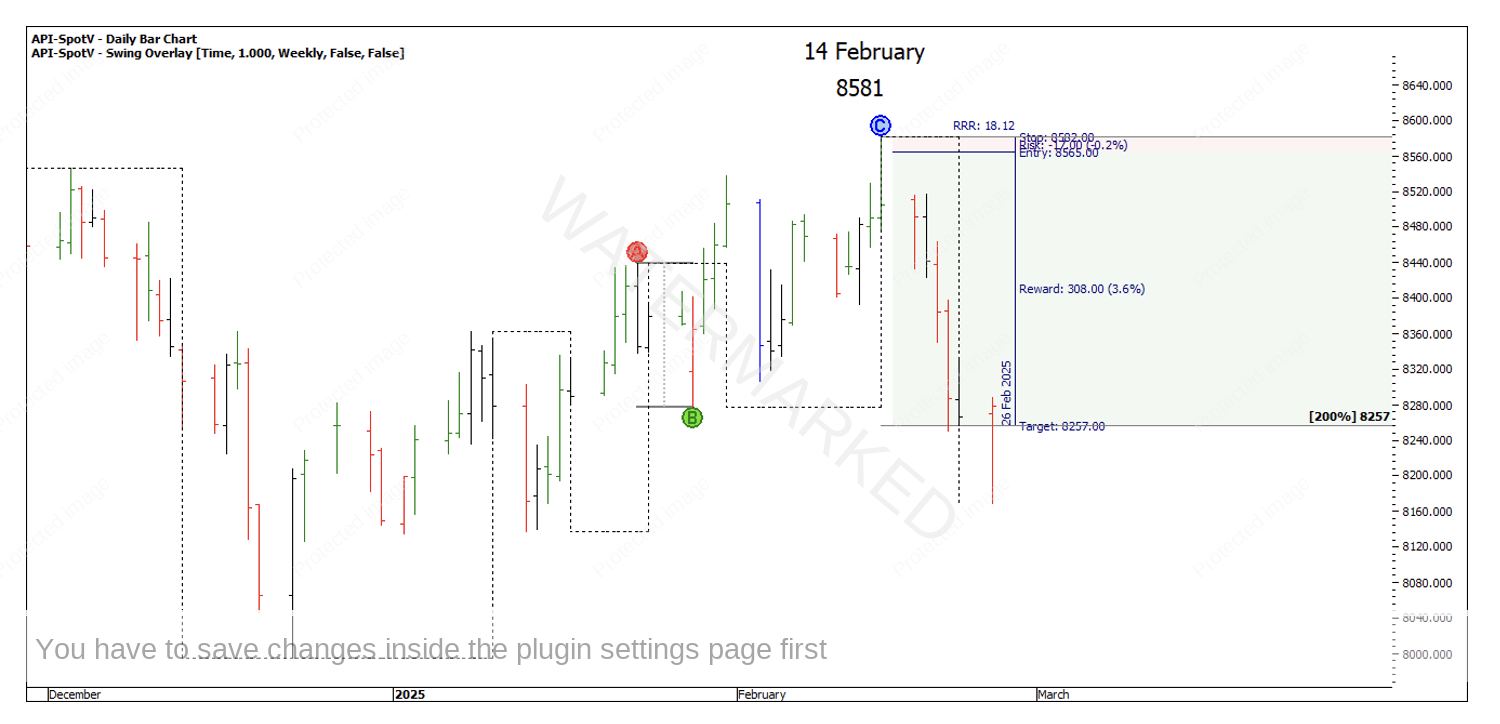
Chart 13 – Potential Risk to Reward Ratio
Take the time to recreate these charts if you haven’t done so already and how you may have traded it.
Happy Trading,
Gus