Testing Times
It’s fair to say the tone for 2025 has been set as we see a new “vibe” around politics, markets and the economy. My connections in the big end of town are suggesting they are bunkering down and shortening the reigns as the level of uncertainty increases. For some empirical insights, we can view the VIX Index that tracks implied volatility in the US options market and its absolutely elevated. This means we will be tested as traders, and this in itself is a good thing.
We prepare ourselves through research and practice for times just like this, like a high-performance athlete, we want to perform on the biggest of stages and this year will likely test many in the general investing but also trading community.
One of the markets we are following in Ultimate Gann Coaching is the stock Tesla. The first 8 weeks of 2025 have gone a long way to shape perceptions of Elon Musk and regardless of what camp you are in either for or against, his “company” will be put to the test. As a side note it’s interesting that some founders of large corporations choose a more subdued approach to their personality. Musk is Tesla and Tesla is Musk so the outcomes of the stock in many ways are now tied to the rise or fall of the person as much as the company.
Several times last year there was a case for the long side, but the bears are currently in control, but we could be seeing a potential rebalance before the bulls return.
Chart 1 provides a large enough picture to build a perspective of where we are and what we might expect.
The value of a Low’s Resistance Card is seen here as we use the 2023 low at $101.81. Multiples of this low are marked in the solid orange lines with the ultimate current top being 375% of the low.
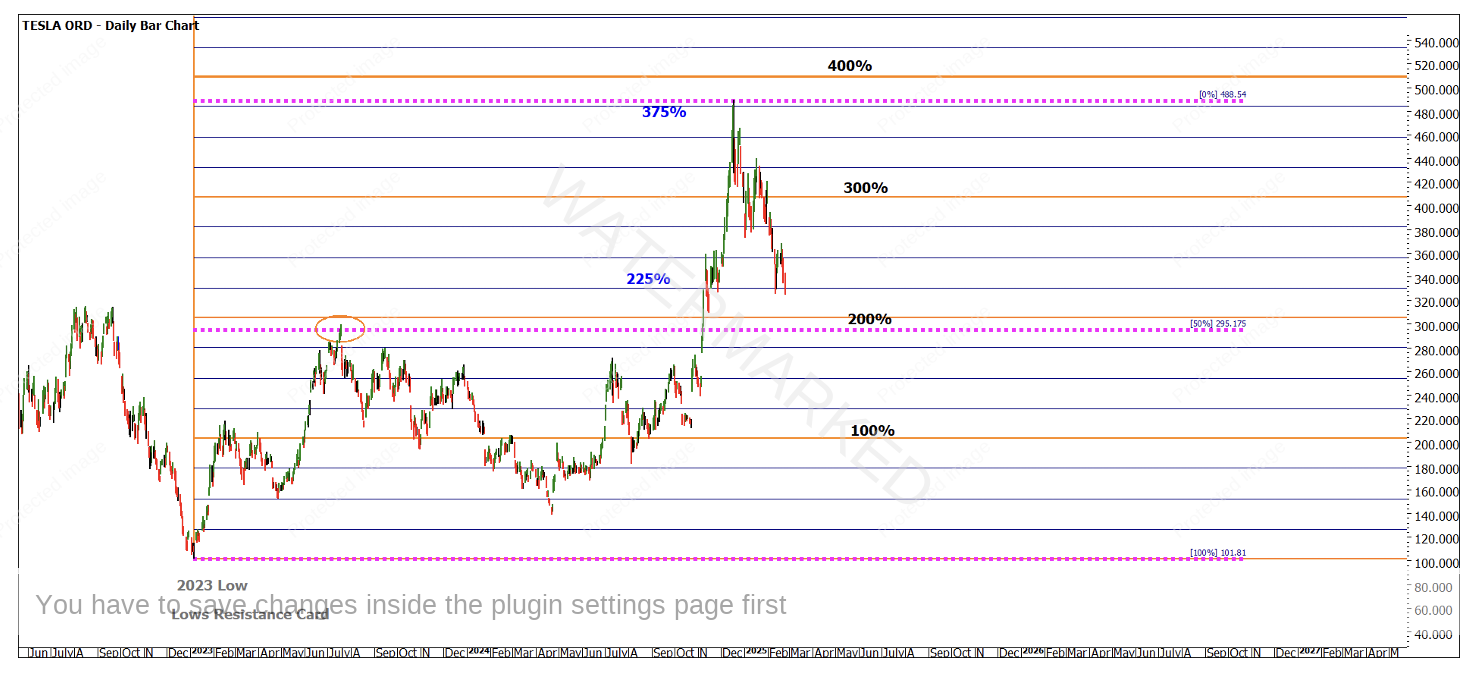
Chart 1 – TSLA Daily Bar Chart
The top in July of 2023 when using the Gann Retracement Tool on the 2023 low and the December 2024 high sits at approximately 50% of the eventual range that suggests there is harmony in all three points.
The value of the lows card on the chart allows us to see the current run down from 375% to 225% point is 150% . You need to relate that back to 150% of what? The original value of the low in 2023. Markets are just numbers, and I have always liked the precision that maths can offer.
Chart 2 continues that theme by measuring the last bearish range to the current move down, the market has produced a 100% repeat. Interesting this current move down was 4 times faster than the previous move lower when measuring time counts.
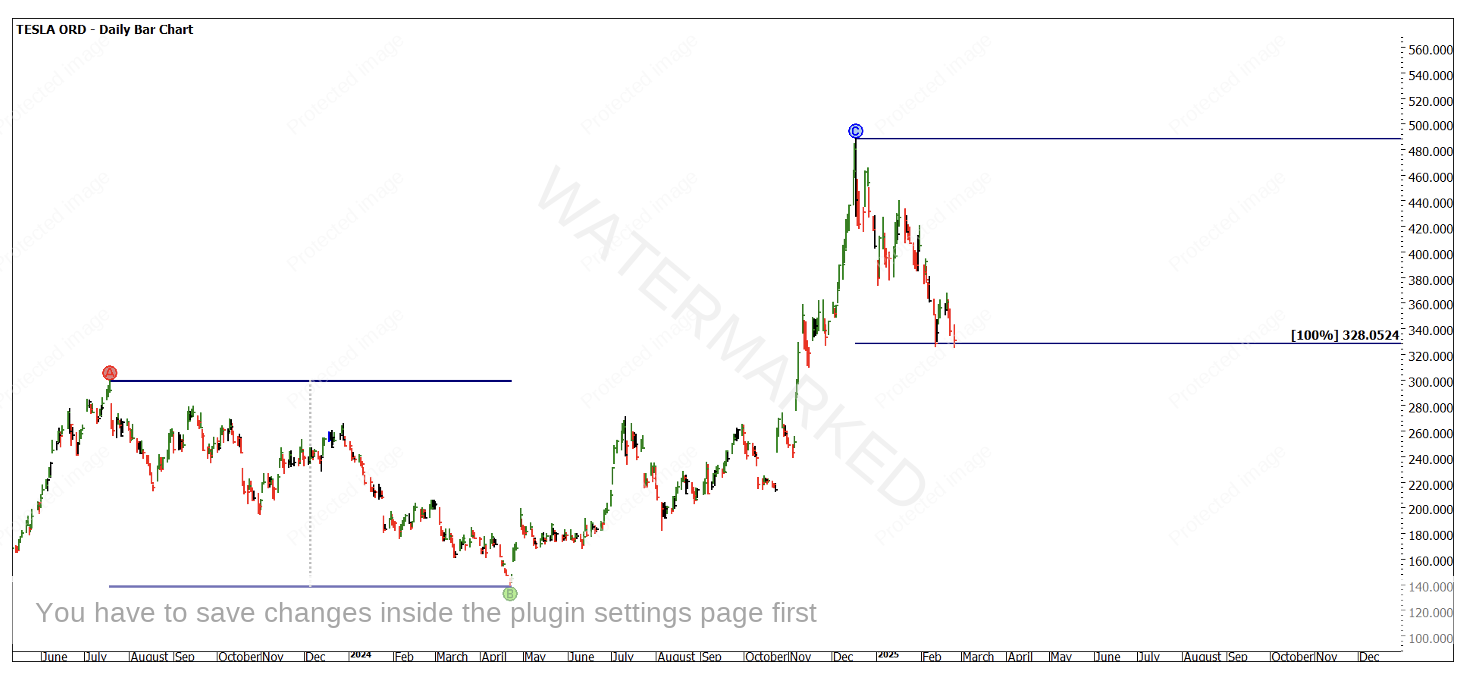
Chart 2 – TSLA Daily Bar Chart
Chart 3 uses a smaller range for comparison and to check if there are any clusters at the current levels. The 150% level and 200% level may act as a guide but currently don’t cluster at the existing lows which could have the potential to be called a double bottom on 11 February and 24 February.
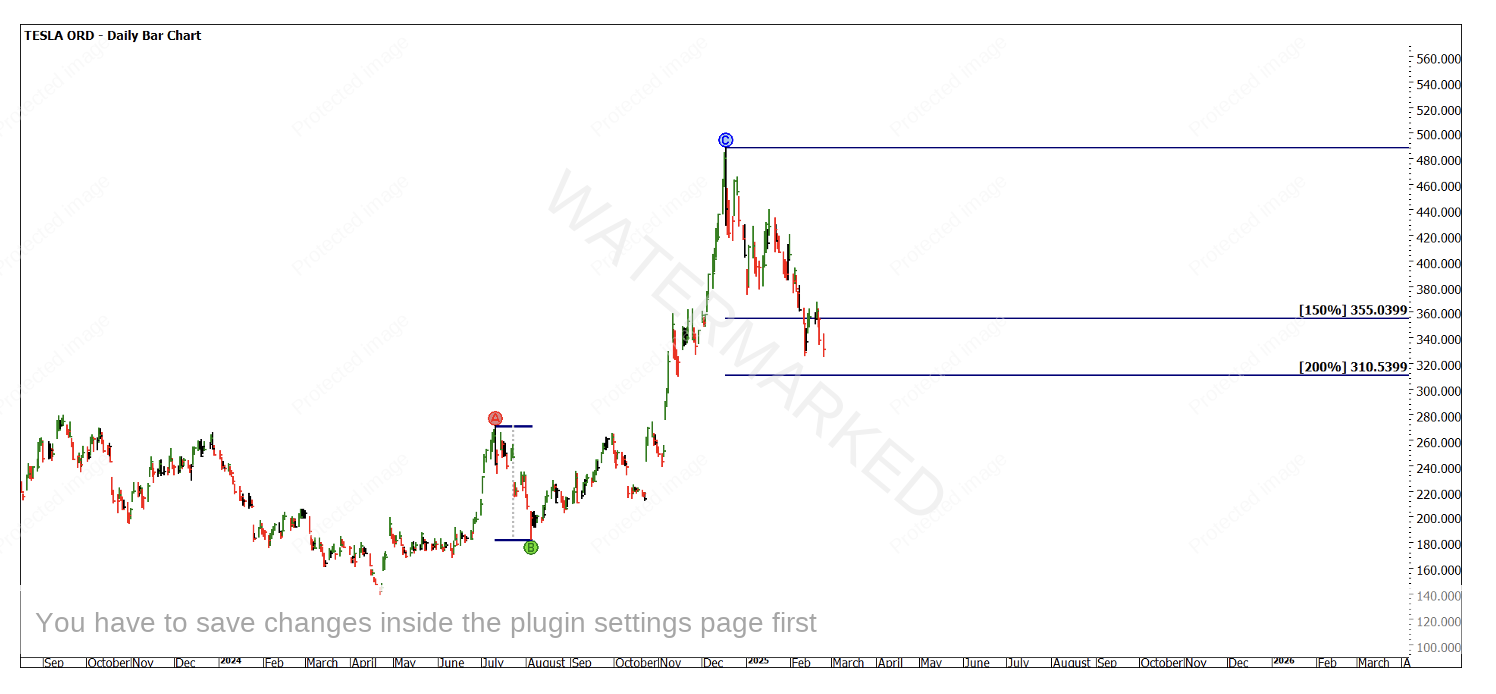
Chart 3 – TSLA Daily Bar Chart
Following the same habits and routines we can apply the same technique for the next range in line. Using the theory of history repeats we see the current support and base for a potential double bottom is 100% of the December 2024 to January 2025 range.
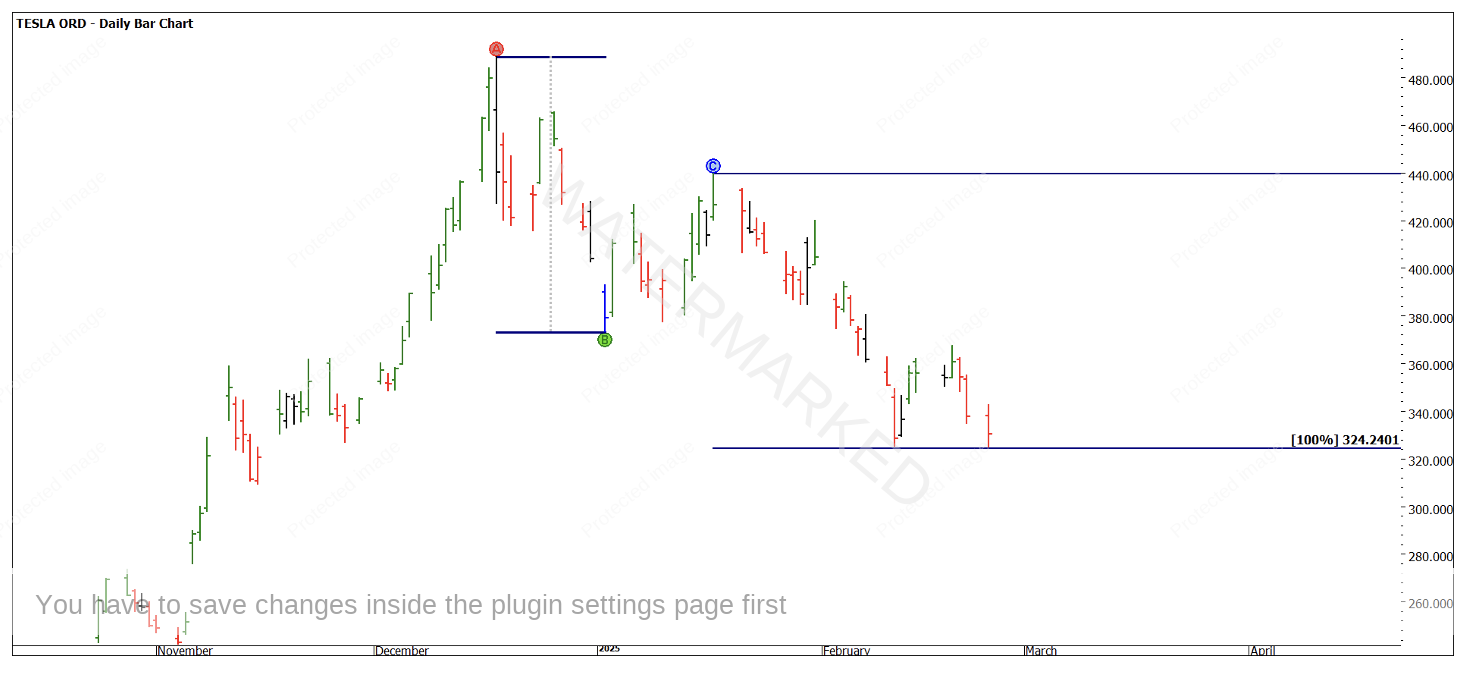
Chart 4 – TSLA Daily Bar Chart
Chart 5 looks to again define some clustering on an even bigger picture. The 33% retracement on the next chart comes in at $329.77.
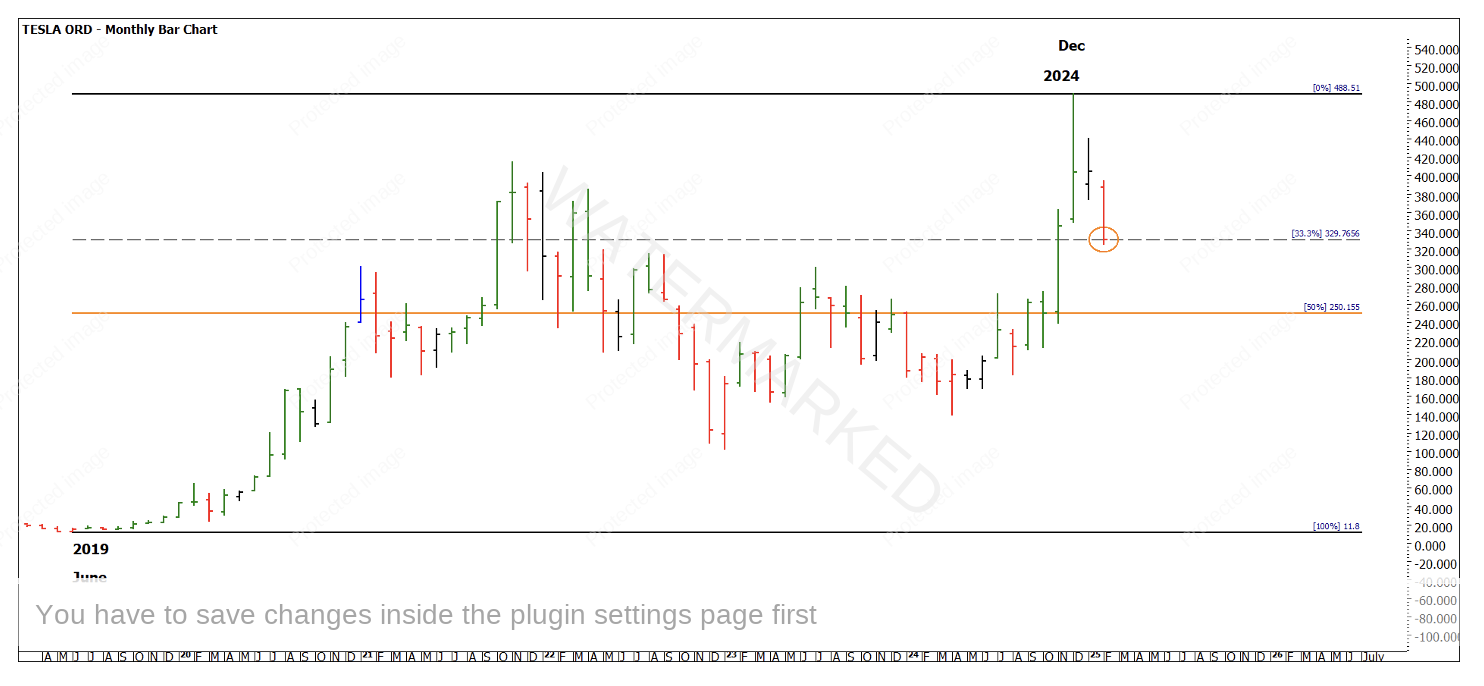
Chart 5 – TSLA Monthly Bar Chart
The daily and weekly trend are both down and the monthly is up. If we were to consider that this small potential double bottom was a potential long trade, something I always check on the pattern of the double bottom is as follows.
Is the A to B of what we are calling the first part of the double bottom pattern an Overbalance in Price? Chart 6 looks at the previous up swings, can we consider it an Overbalance in Price? Time will tell, but the current up swing of $42.24 is approximately double the last two up swings.
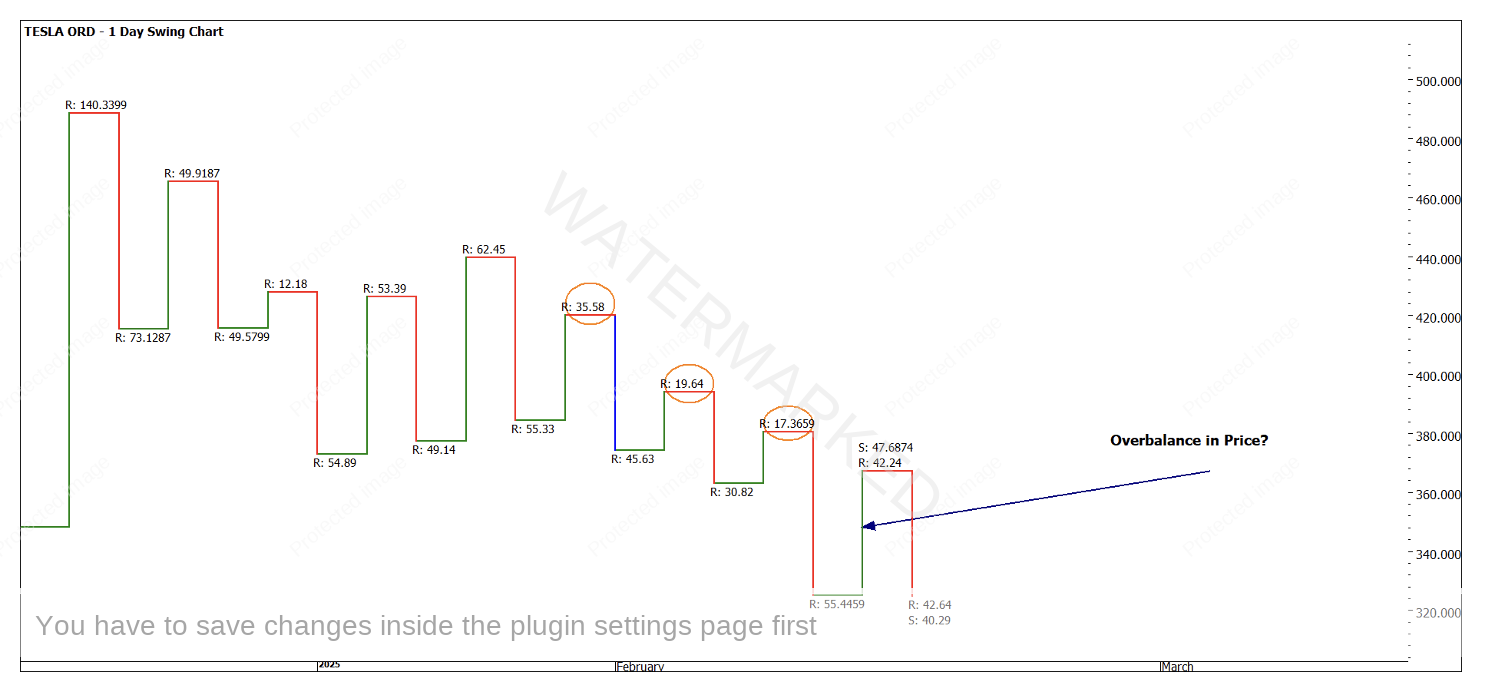
Chart 6 – TSLA Daily Bar Chart
These are the calls that we often need to make and look for confirmation in real time. This may be a good example to paper trade for the sake of the exercise.
If you believe that the analysis is sound, how would one execute the analysis? We cannot use a “standard” ABC pattern as we are outside limits. If I could put in a request, it would be for an inside day on the next trading session
We may need to use a first higher bottom entry or utilise an intraday entry. We may also plan for a gap up and using either an openers or closers rule.
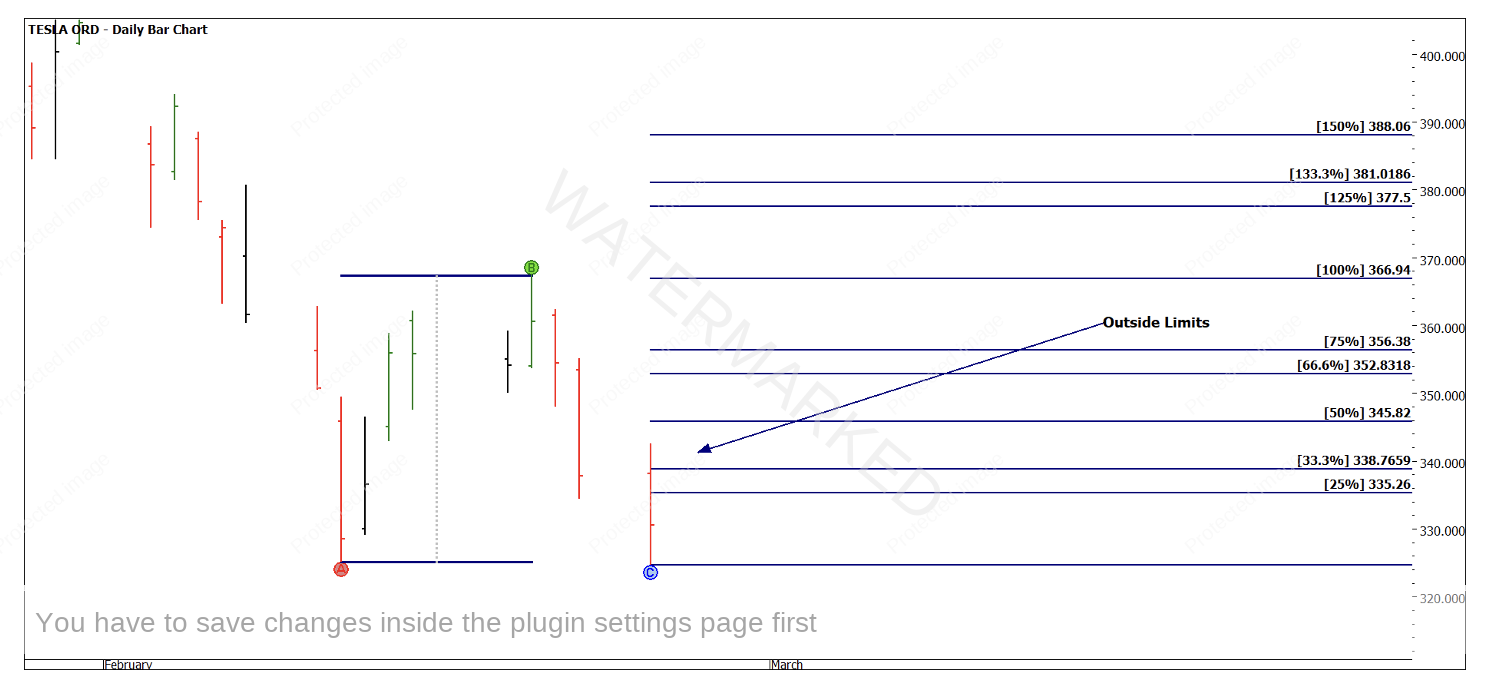
Chart 7 – TSLA Daily Bar Chart
There is some intraday harmony as I write this and may produce an entry in the first 2 hours of trade when the NASD next opens, but more on that next time (especially if it comes together)
For the purists who might be asking is this a strong turning point in price it has some positives. Time is less clear so I would not anticipate this to be a yearly turning point but if managed appropriately it can deliver an appropriate Reward to Risk Ratio worth of our attention.
Good Trading
Aaron Lynch