Combining Strategies
Combining strategies is a great way to gain added confirmation for a
Often you can combine strategies, whether that be trade management or analytical strategies, and it is always a great way to gain added confirmation for a
The market we will explore the combination on is Sugar (ProfitSource code: SB-SpotV). This had a very attractive combined set up in August 2018, where it produced a Double Bottom with all the signs of price clustering. Both of these techniques are taught in the Number One Trading Plan. As you can see from the weekly chart, we had a relatively symmetrical peak between the two lows made on 24 August 2015 and 22 August 2018. For those who have been exposed to time analysis, you’ll appreciate that it was nearly exactly three years apart between the bottoms.
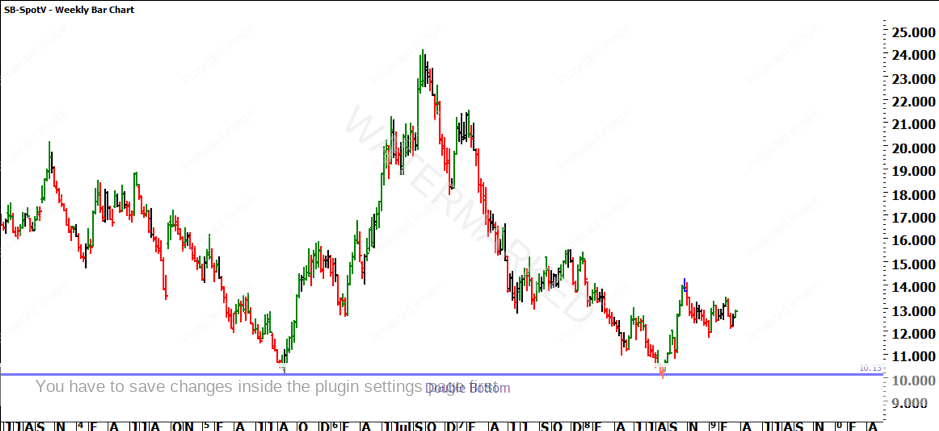
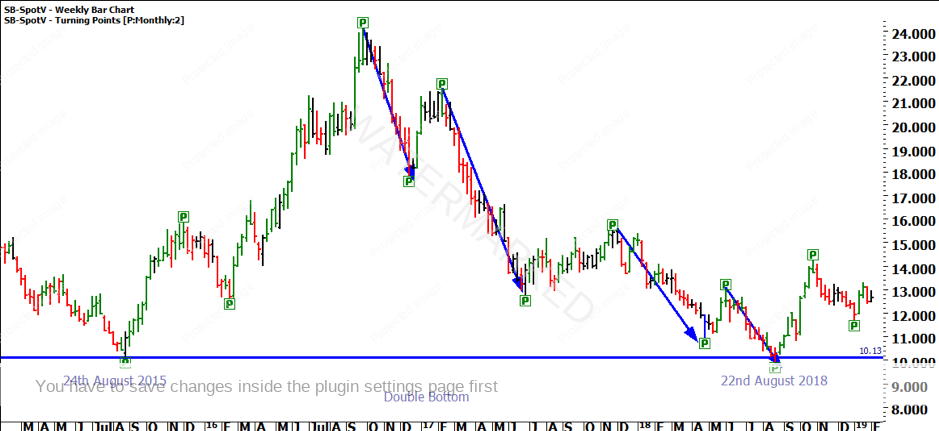
Given the current timing on Sugar, the market has reacted off the current double bottoms which screams opportunity. Let’s explore the ranges into the 22 August 2018 low to verify the significance of the setup. If we apply the turning points tool and change the primary indicator to two periods, it is relatively easy to identify that the market produced four sections that lead the price action into the double bottom.
While we haven’t yet pulled these sections apart, given you were trading sugar at the time, you would have identified that the market was showing signs of history repeating and would be worth an investigation.
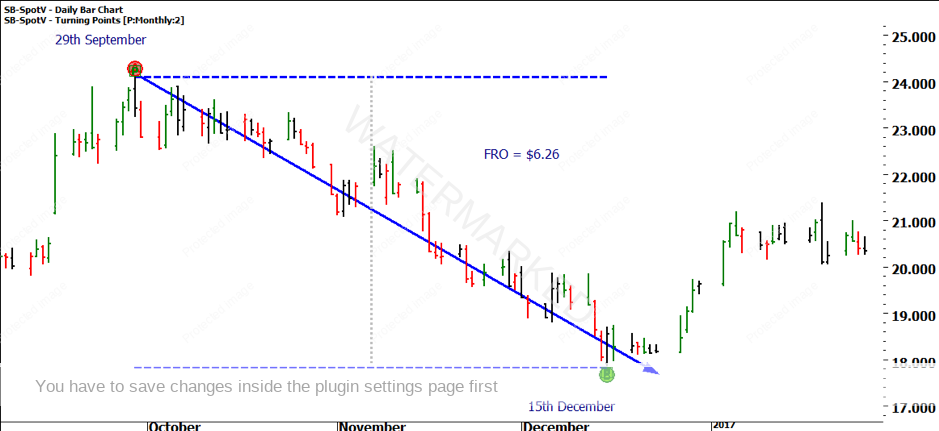
The First Range Out (FRO) from the high on 29 September 2016 into the low of 15 December 2016 produced a range of $6.26.
If you project the FRO of $6.26 from the high on 6 February, the 100% repeat comes in at $15.23. The market bottomed at $15.24 on 5 May 2017. This time it wasn’t three years but three months from high to low.
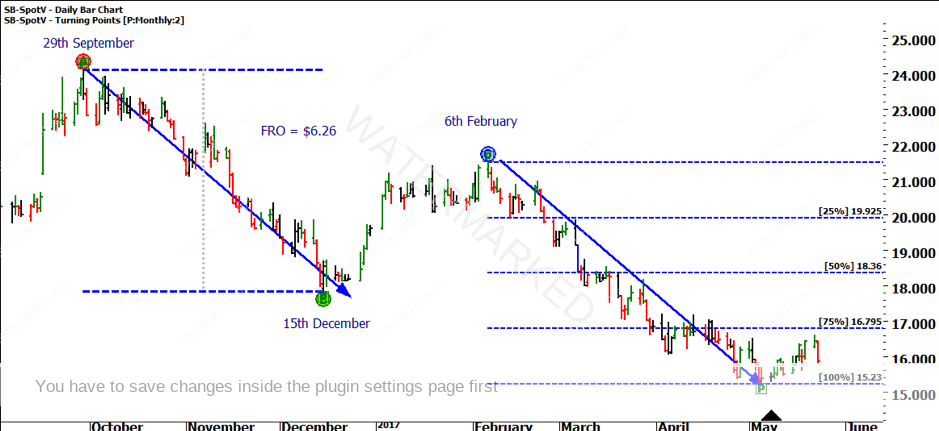
Though this was a 100% repeat, the market remained strong and took out the 5 May low and continued to the 133% milestone, producing the low on 28 June 2017 at $12.74. The market reacted from this level and made its way back to the 100% milestone at $15.23, where it produced a Triple Top prior to starting the third section.
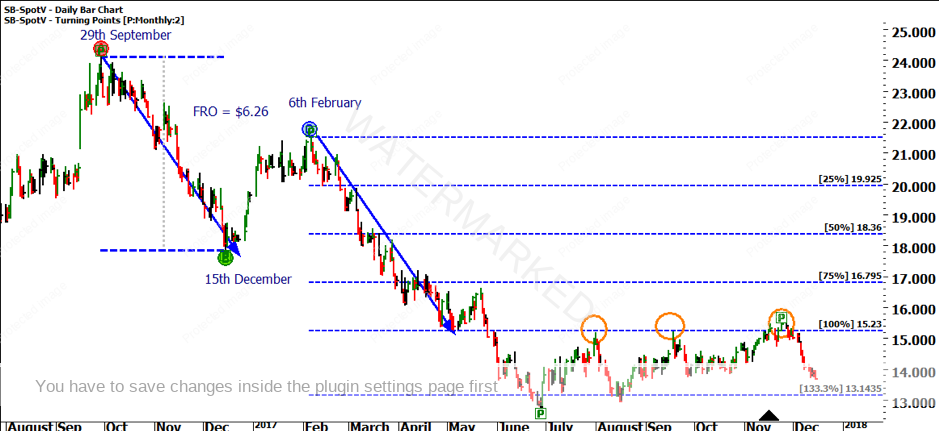
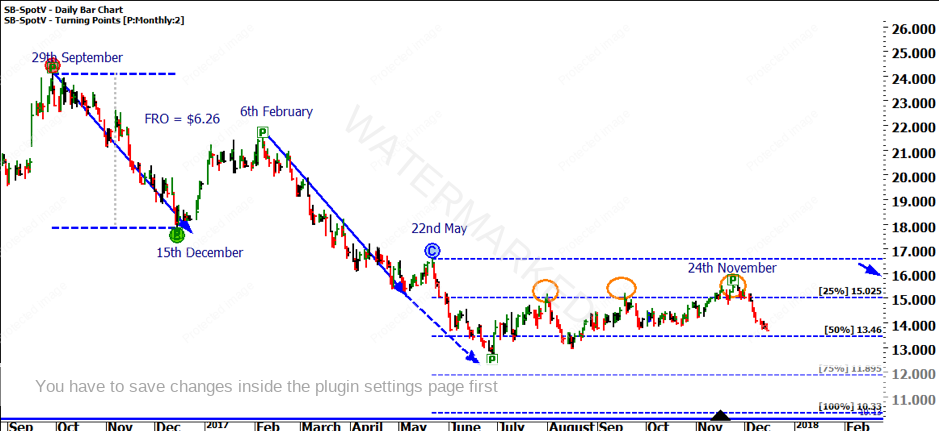
Depending on which top you projected the reference range from, you would be watching the 100% milestone from the 22 of May high – as well as watching the milestones from the high on 24 November and the triple top.
The 22 May high provided a 100% repeat at $10.33 which was very close to the double bottom that was recently created. This also clustered with the triple top level, where the 200% repeat came in at $11.01.
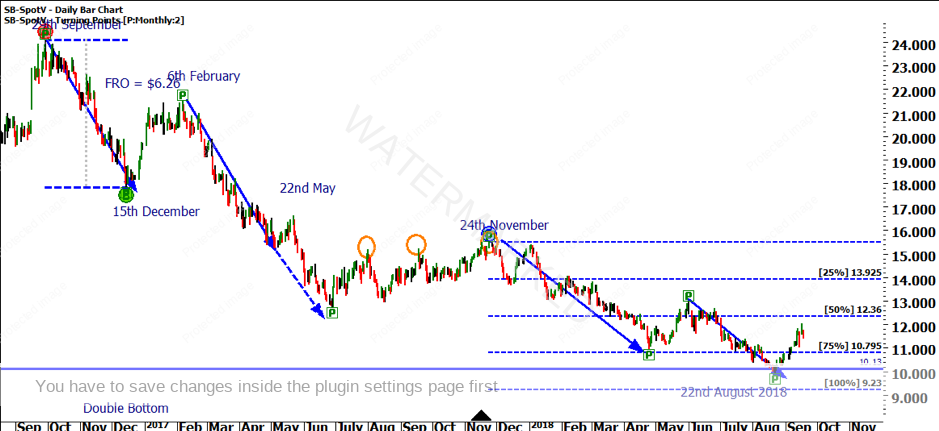
By projecting the FRO from 24 November, the market failed to hit the 100% repeat at $9.23, only making it to 75% prior to reacting, and further producing another section. The market bottomed at $9.91 on 22 August 2018 – the average of the three projections was $10.19 which is clustering with the first low within the double bottom ($9.23 + $10.33 + $11.01 = $30.57/3 = $10.19).
Given our turning points gave us a fourth section to measure, if we project the FRO from 1 June 2018 at $12.97, it was the 50% milestone at $9.84, that you would be keeping an eye on when the market came into the double bottom. Again, the market lowed at $9.91, which confirms the cluster of the fourth section and a fail at 50% of the FRO.
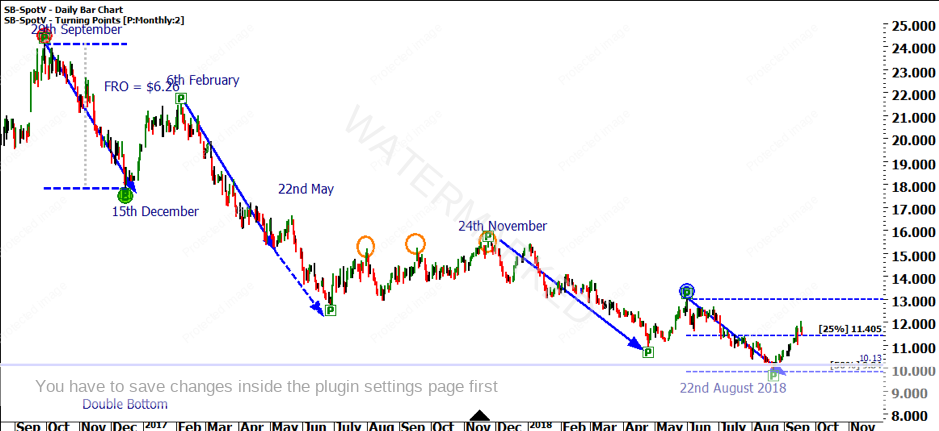
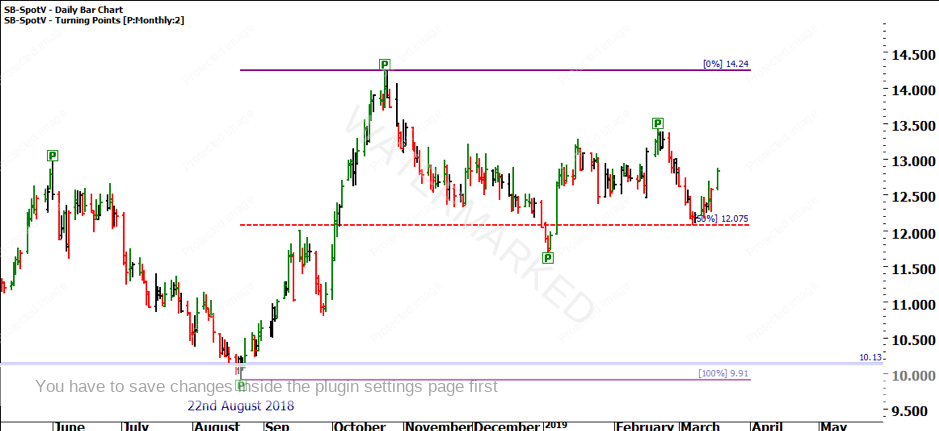
Since the double bottom was made, the market has rallied up, overbalancing price and taking out the high of 1 June 2018 at $12.97. This is an opportunistic sign to potentially see a new FRO being produced. The most current market action has fallen back to the 50% level at $12.07 where it has found some support. It has also created a number of higher bottoms on the bar chart. I will be watching the February highs to see if the market can make an attempt to break through on the fourth time.
In closing, I will leave you with some homework to see what strategies you can combine in order to take advantage of the next potential opportunity.
It’s your perception,
Robert Steer