Major Support and Resistance
When markets lay down clues of previous support and resistance, it pays to note the details and be prepared to revisit them when they return to these levels. An Australian stock market mainstay Macquarie Group has long been a market that I have maintained a love / dis-like relationship with. Mainly as it proves to be one that trends well and over the years in a direction that is opposite to the one, I had researched.
To that end I keep a loose eye on it and when it returns to previous levels of support and resistance, I revisit it to see what opportunities it can offer. Chart 1 shows us the previous medium-term history and allows us to sum up its current position in the market.
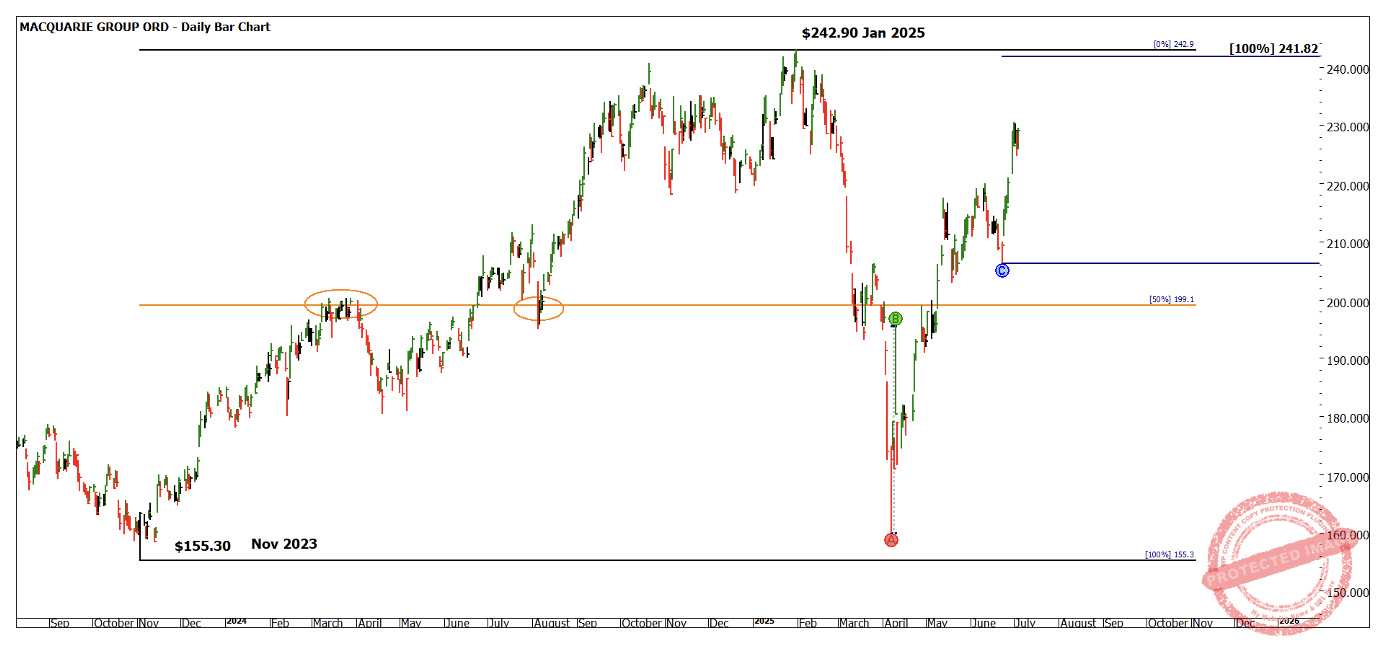
Chart 1 – Daily Bar Chart MQG
The price action underwent solid gains in 2024 , followed but an equally strong sell off from the Jan 2025 highs as tariff discussions kicked in. A key element that draws me to this stock is the percentage moves it makes can be quite large when compared to the index, and it can swing in a different rhythm to say the SPI 200. For example, we see the current price action is well below the yearly high which differs to the SPI 200 that is at a record high.
Other areas to note is that the 50% of the November 2023 and January 2025 top was important to the final high even before the top came in, this suggests to me this market has good market symmetry when it comes to our style of analysis. Final note for Chart 1 is that the First Range Out from the 7 April low, when added to the June 25 low at 100%, gives us a very close cluster to the January 2025 high @ $241.82.
You are hopefully seeing that the cluster and potential for resistance here is the area I am watching closely. If price can retest the high, if it fails a short trade could be on offer, a breakthrough of price could offer more opportunities on the long side.
The area around $240 would be the area you could start to research by using previous ranges to see which of them cluster and where around that level. Rather than just adding the completed chart I recommend our newer students do this work themselves to see how many previous ranges could be used to link in around this price. I also like the price as a prime number as we know 240 can be important in the same way $360 has been important for TSLA, a market we are tracking in my coaching program.
One of my favourite price-based tools is the Lows Resistance Card. In Chart 2 using the All-Time Low of $14.75 we can see how the recent price action in 2025 has been using multiples of that price as support and resistance areas. The blue circle above the current price action could again be used as an area to watch for clusters and confirmation of closes above or below.
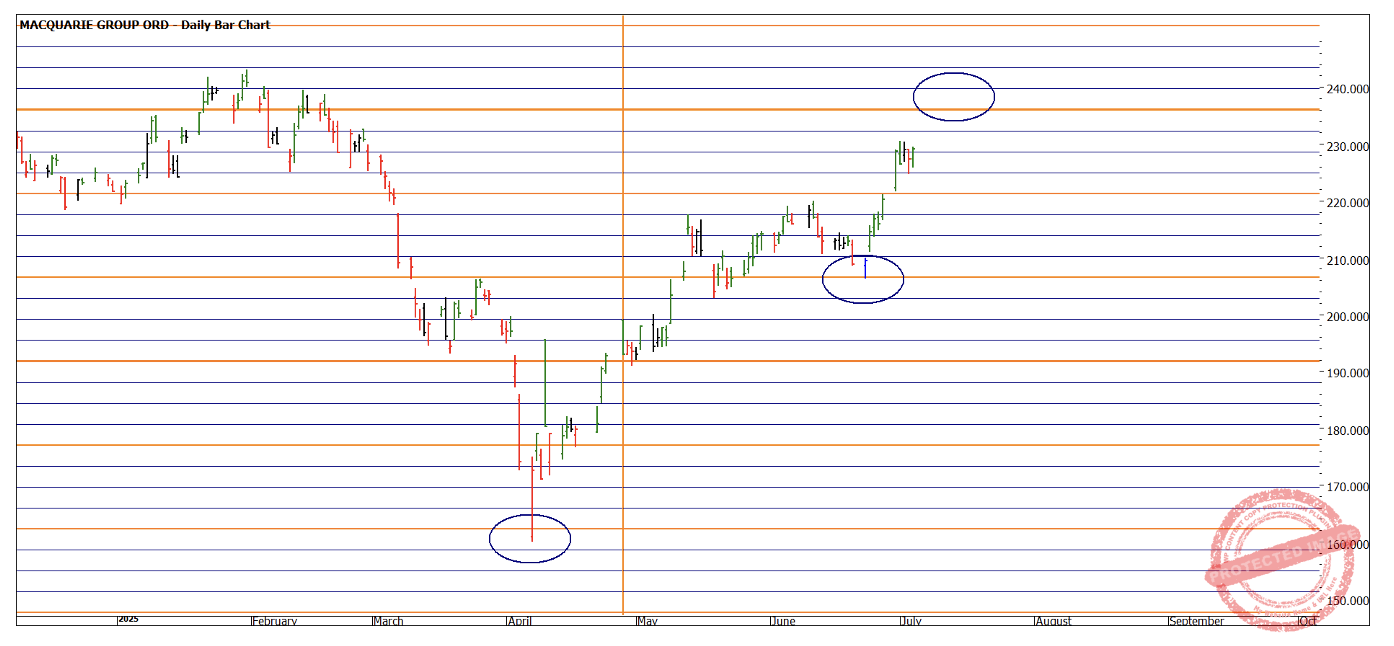
Chart 2 – Daily Bar Chart MQG
The following two charts relate to a price that this market has thrown up, being $94.07. This represents the range from the 2016 low to the 2020 high, this is very big picture work and will need some patience when you’re working with it.
Chart 3 show how the 150% milestone of that range helped us with the top in 2022. Refer to your milestones chart as to why 150% is important.
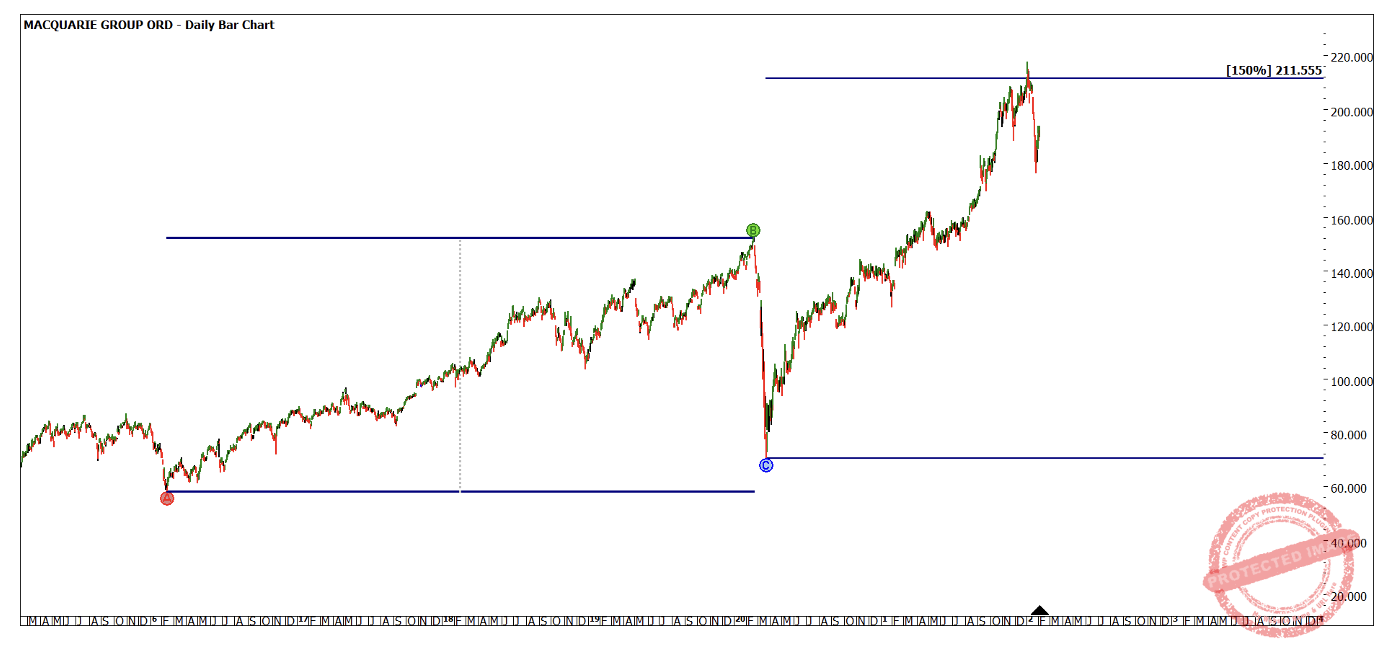
Chart 3 – Daily Bar Chart MQG
The same range, $94.07, added to the low in 2022 nailed the 2025 top as seen in Chart 4 (be sure to recreate these charts yourself).
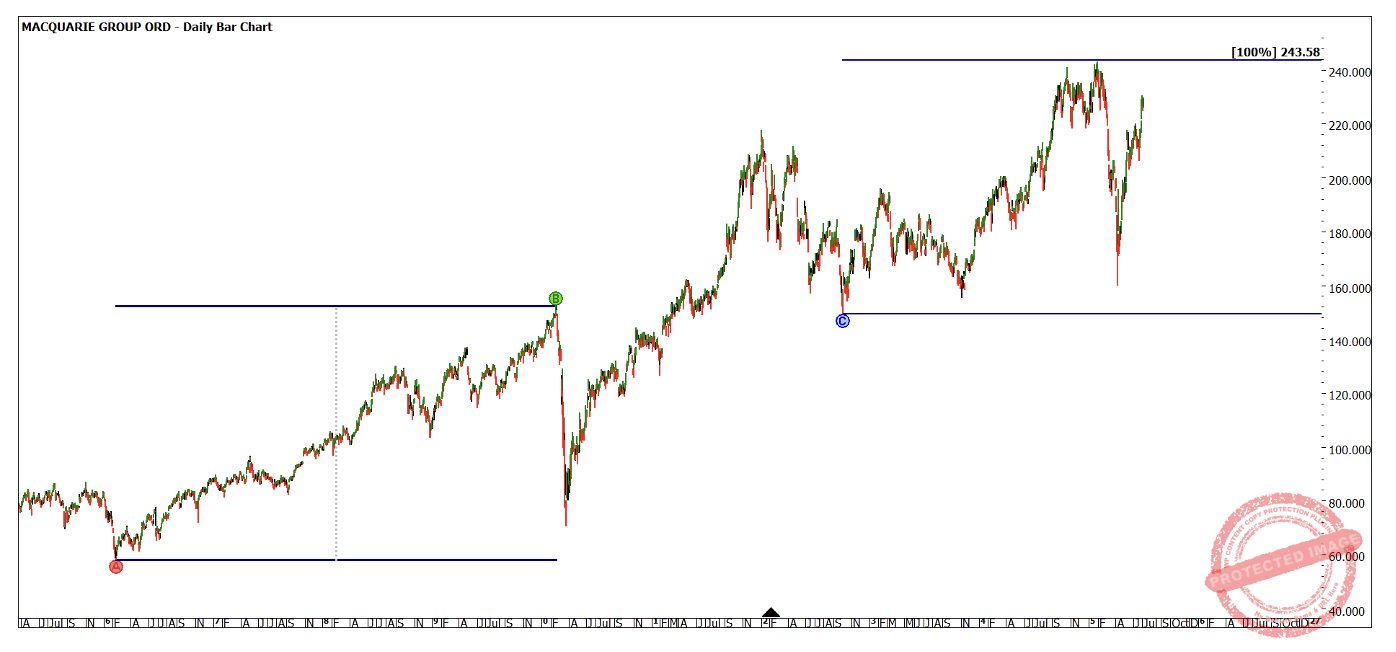
Chart 4 – Daily Bar Chart MQG
We could expect any next major high to have a reference to the that range, it will be one I am watching .
Good Trading
Aaron Lynch