Stalk the Opportunity
Personally, I never get sick of seeing the basics work on a market. That being, repeating ranges, 50% retracements and signal bars. There is always an opportunity not far away.
Corn has been a market I’ve been watching since late last year, where I identified a price cluster being a 100% monthly swing milestone clustering with a quarterly 50% retracement.
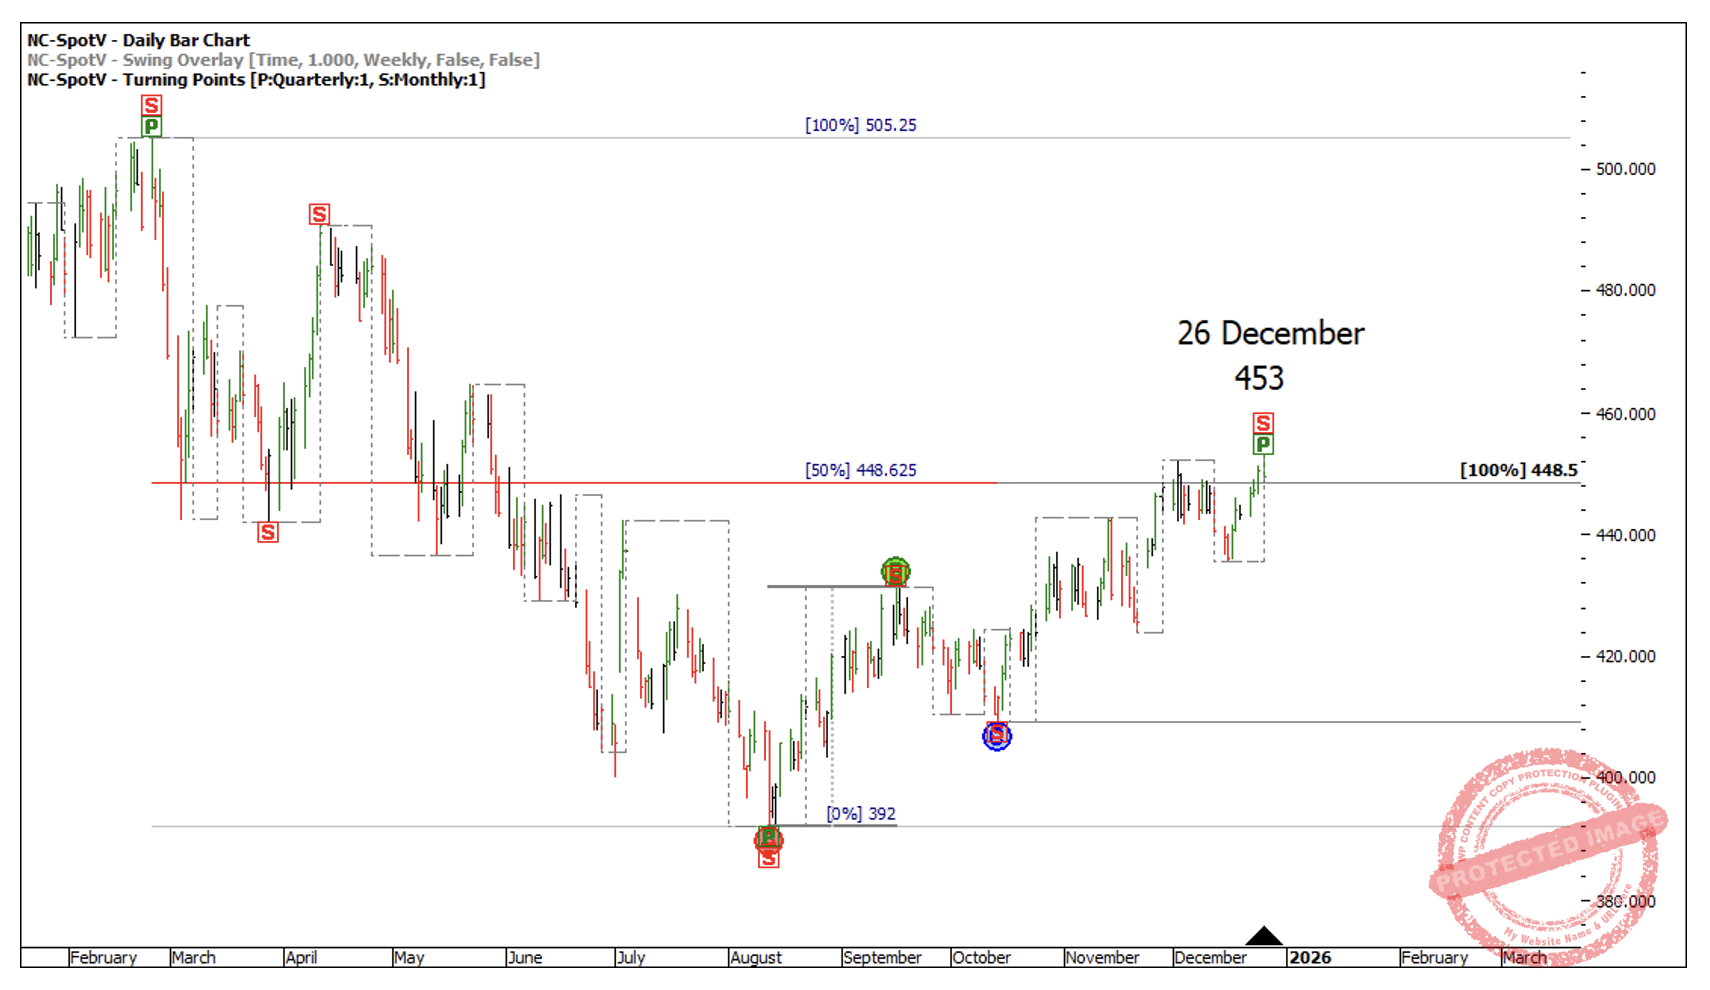
Chart 1
If you know W.D. Gann’s lesson on Sections of the Market, you might also pick up on the weekly count within the last monthly swing that gave signs of completion.
On 12 January Corn put in a failed daily swing up lower top, with a price of 448.75, just 0.25 points through the original cluster.
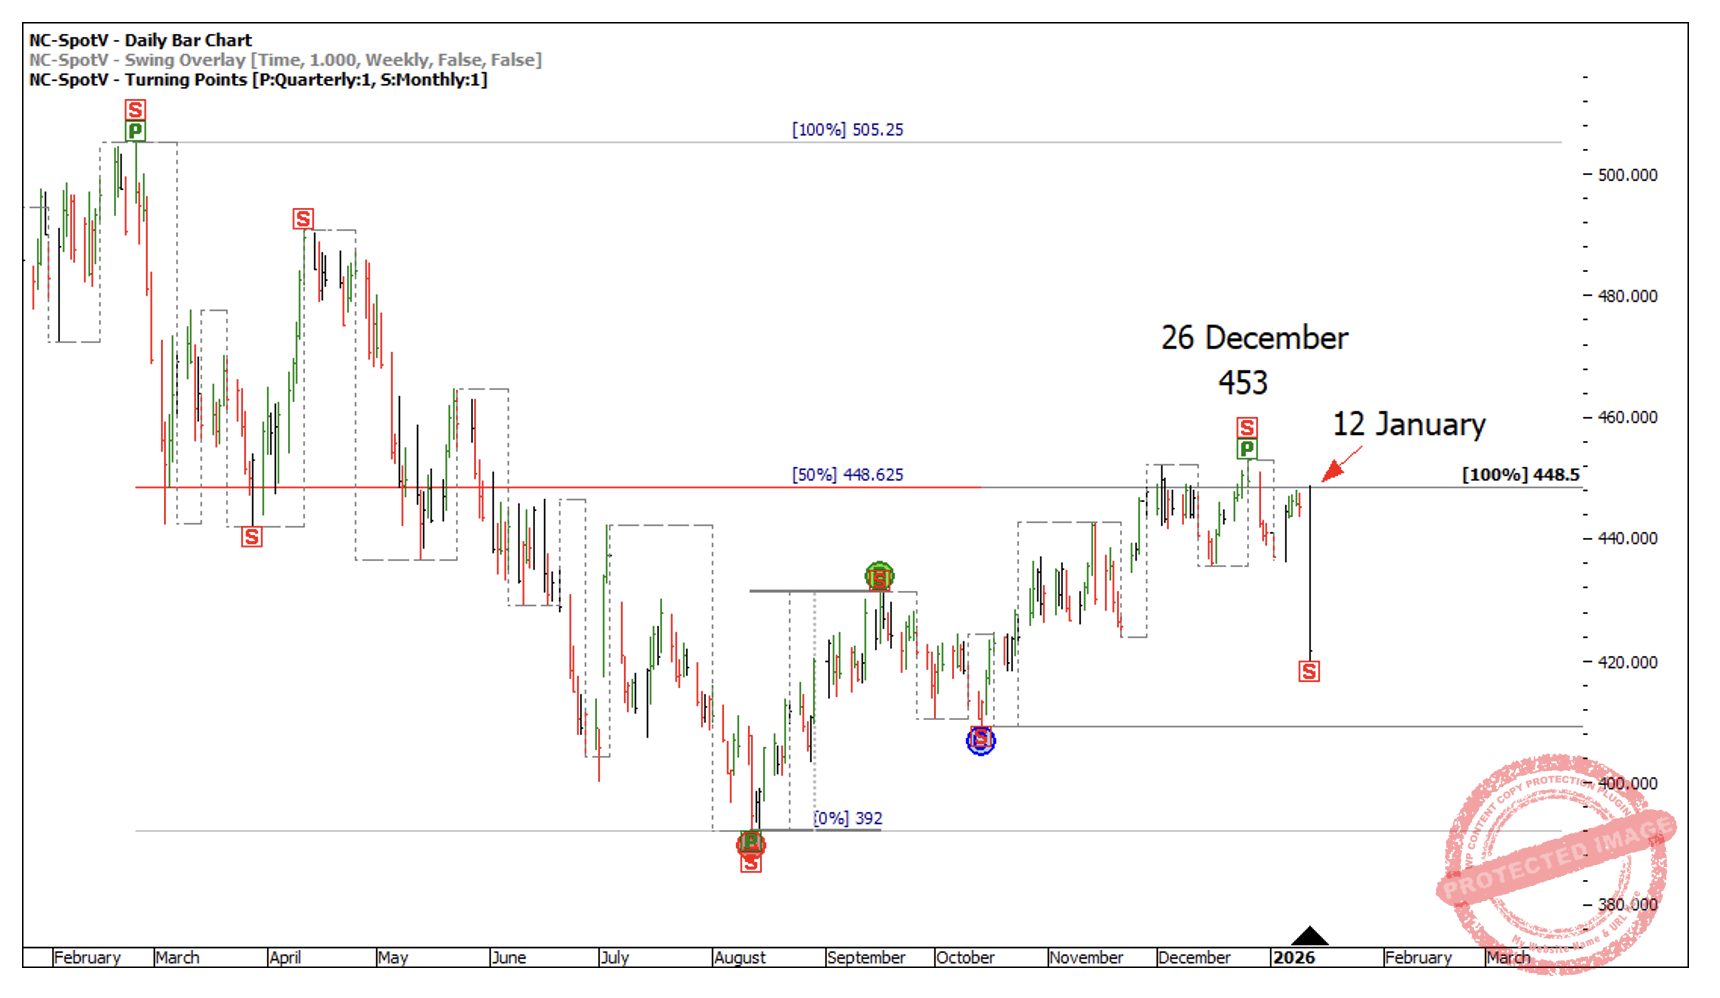
Chart 2
W.D. Gann says the safest place to sell is the first lower swing top or first higher swing bottom. In this case a lower swing top proceeded a false break of the cluster after the sections of the market count.
This move was very short, and the market has been edging higher since. However, now we have a new 50% level which clusters with a daily swing milestone of 200%.
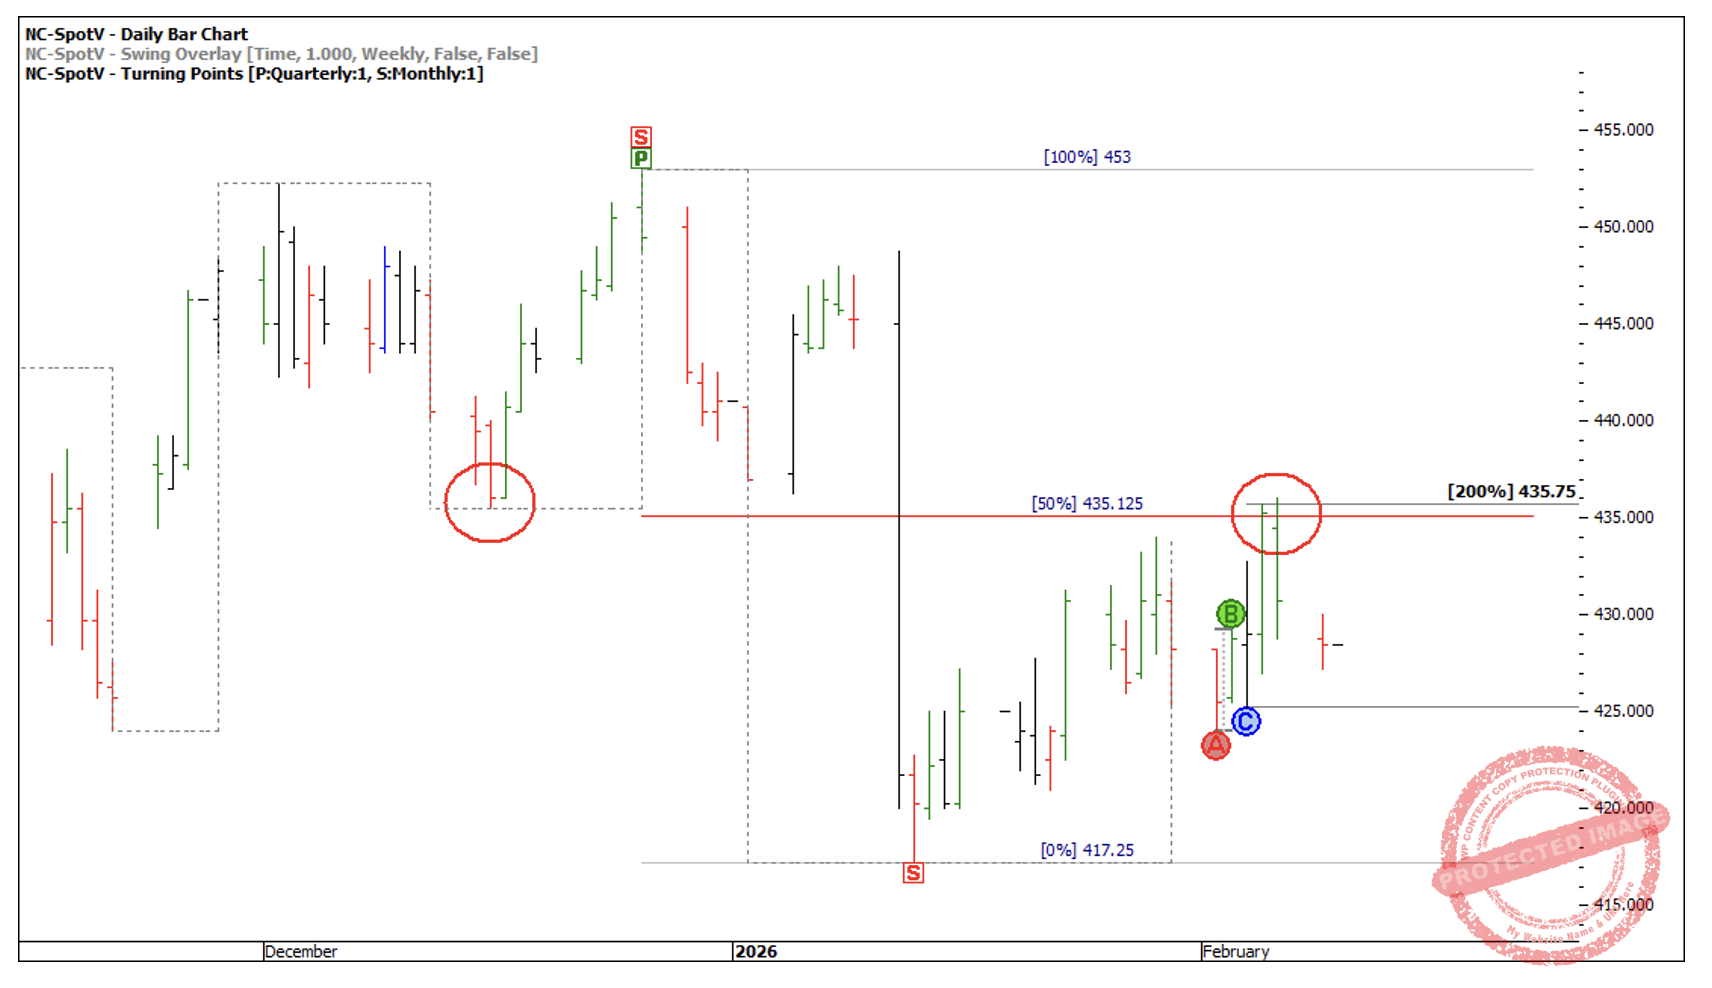
Chart 3
Although Sections of the Market is a discussion in the Ultimate Gann Course, which we are fast approaching in Ultimate Gann Course Coaching for this year, you may be able to see the count in the run up from January and old bottoms becoming new tops is also present here.
If you have a look at your trading software or barchart.com at the contract month, you could look at the last daily swing on a 4-hour bar chart (Wheels within Wheels) and look at scenarios of how you may have entered.
So often there is more than one entry point. As W.D. Gann says, “The safest place to sell is the First Lower Swing Top” so we could now wait for a daily first lower swing top for another entry point.
Now that we’ve seen an overbalance in price on the daily swing chart, we can look for a possible Point C culmination point. To call the end of a daily swing, we can drop down a time frame and look for the same signs of completion on the 4-hour bar chart.
One place that makes sense to me is the 50% retracement! At present I can see a price cluster starting to form.
- 200% of the 4-hour First Range Out = 431.6
- 50% retracement = 431.5
- 100% of the 4-hour swing range = 431.2
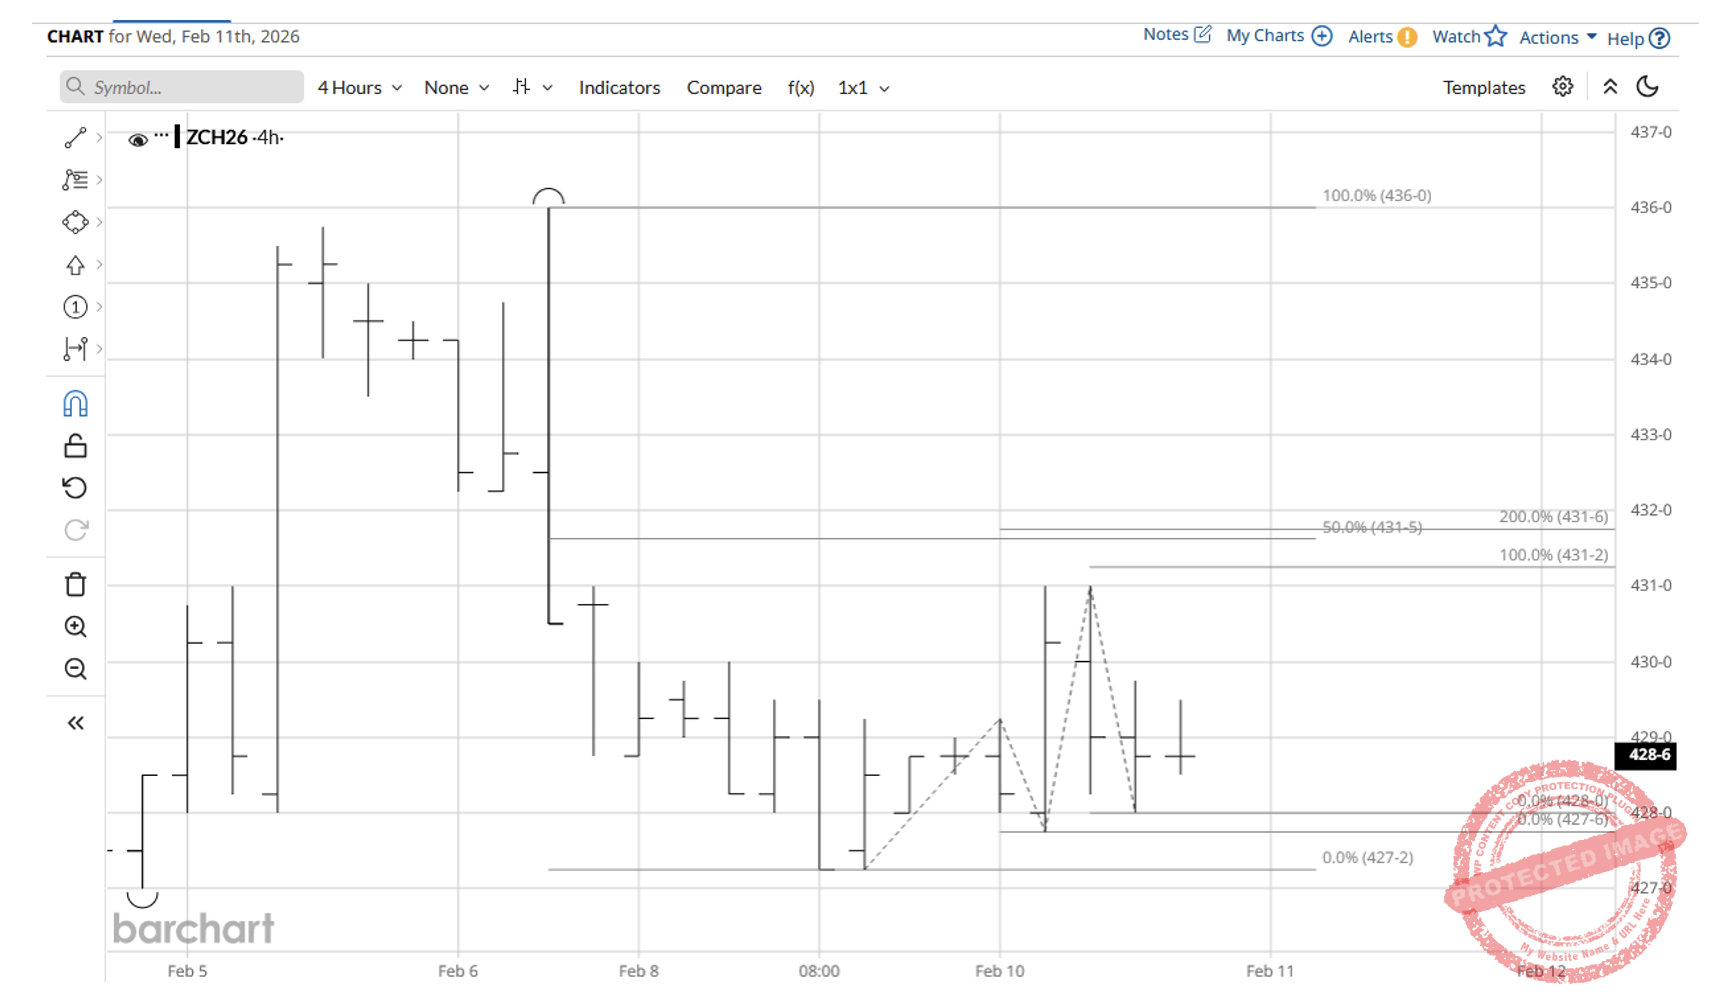
Chart 4
Now I can’t guarantee the market will get there, or even if it does, stop there! But I will stalk it and have an alert on my software so if Corn trades at these levels and I see a signal bar, key reversal or open close reversal then I may look to take a trade. And if it doesn’t look right at the time then I’ll leave it for someone else!
Happy Trading
Gus