Remove the Noise
It’s been an interesting couple of weeks, to say the least. At the time of writing, local diesel prices are around $2.70 per litre, and I’ve heard reports from rural regions of prices reaching $4.00 – $5.00 per litre. Crazy to think.
Not only has Oil spiked higher, but the SPI200 has spiked lower. Let’s take a look through the price forecasting lens to see whether there were reasons to call a top on the SPI200 – regardless of the news.
First of all, there was an old top at 9138 points, giving us a double top with the 2 March high at 9187.
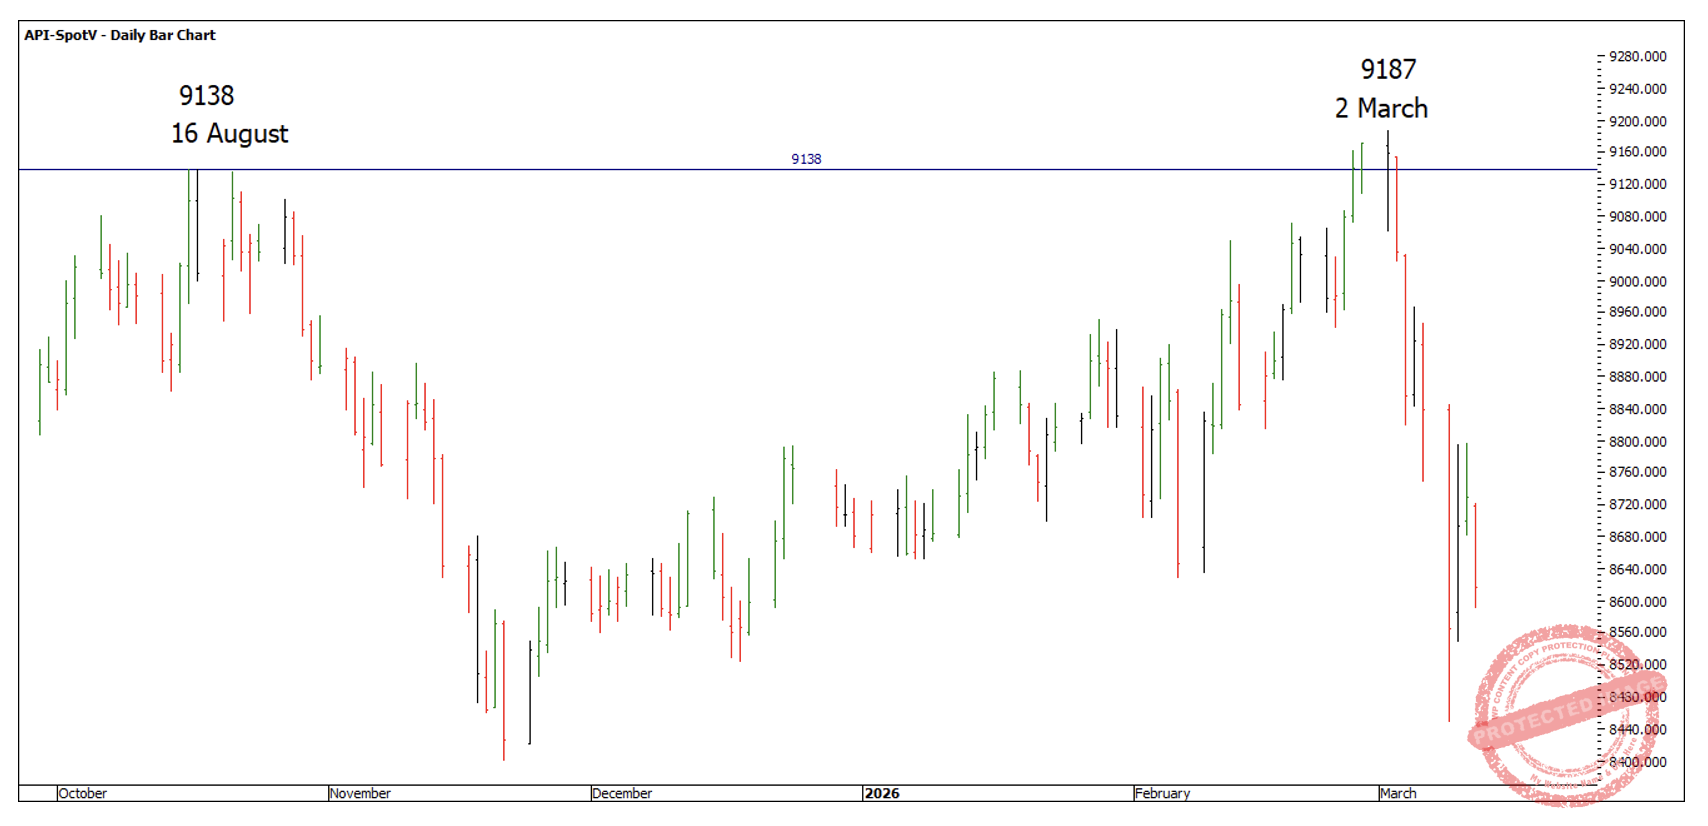
Chart 1
Then, if you look at the monthly swing chart, there was a near-exact 100% repeating weekly swing range at 9179.
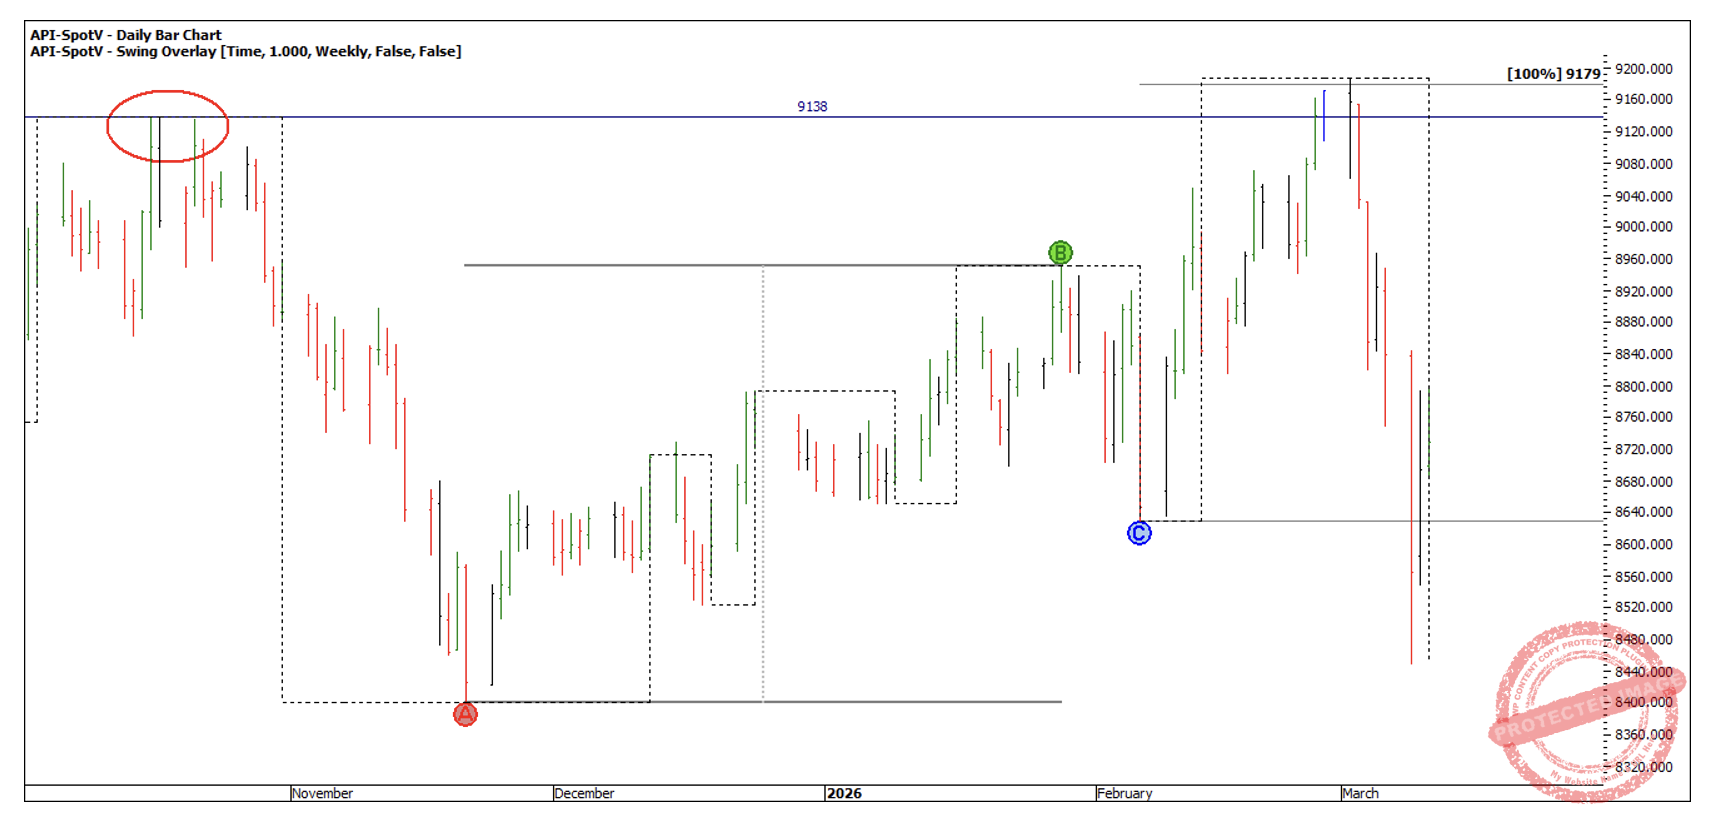
Chart 2
Even though the monthly swing was essentially one large weekly swing, daily sections of the market were still present. From a price forecasting perspective, there wasn’t a daily swing milestone that added to the cluster, but the daily swing chart did give us a strong form-reading signal.
The concept here is three swings, with the last two contracting ranges that did not reach 100% of the Daily First Range Out. It’s worth spending a bit of time studying this concept to ensure you fully understand it from Chart 3 below.
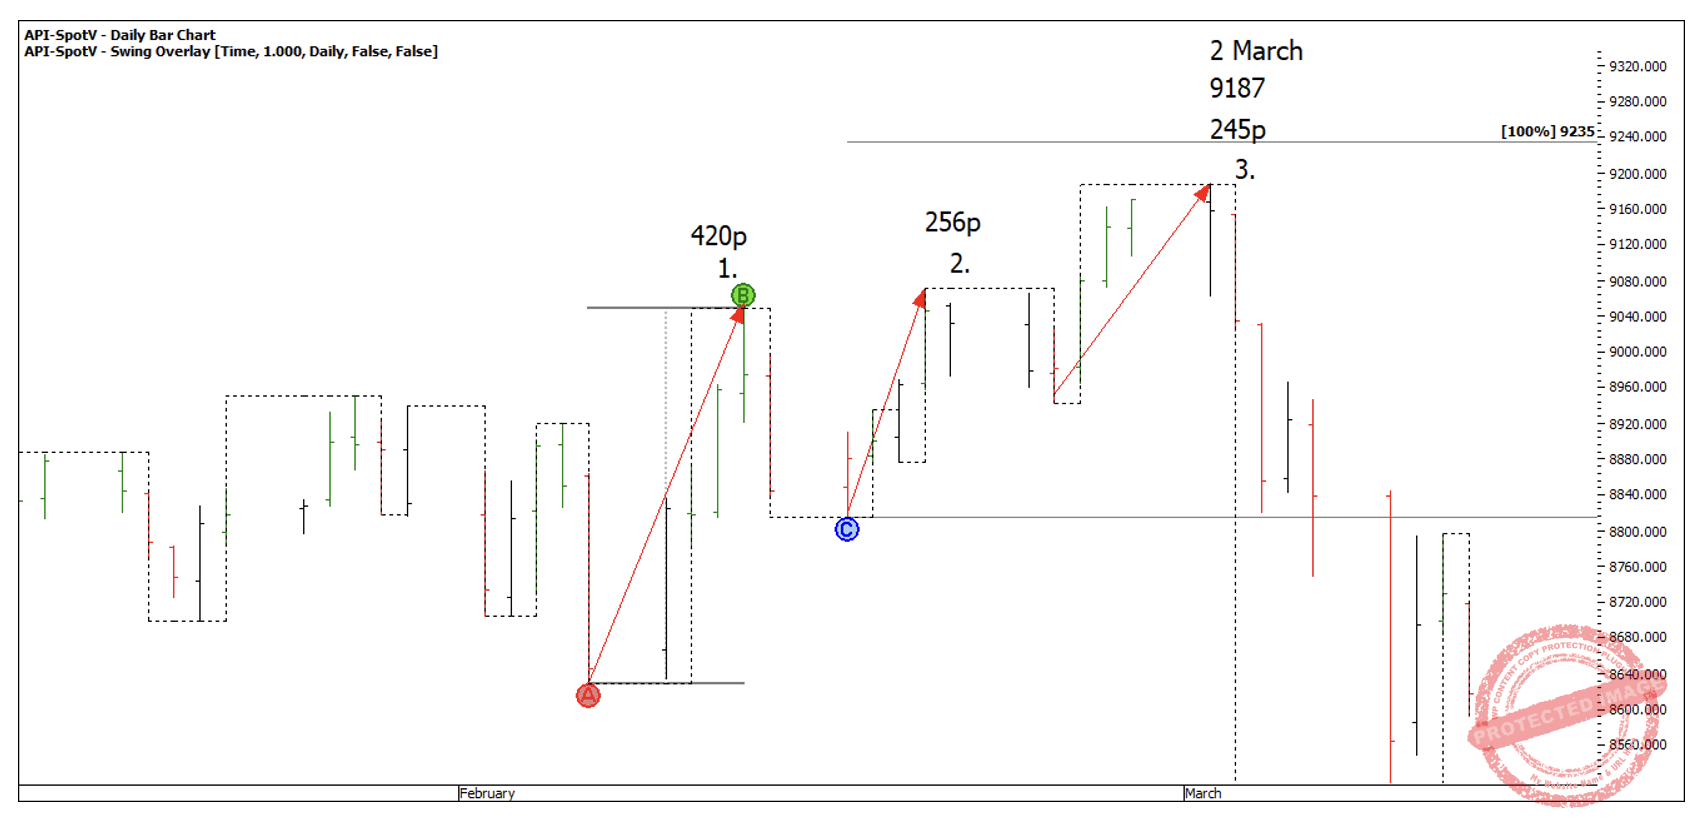
Chart 3
For an entry as the daily swing turned down (not including spread), you could have entered under the cluster at 9107, with a stop above the high of the outside bar at 9188. This would give you a risk of 81 points.
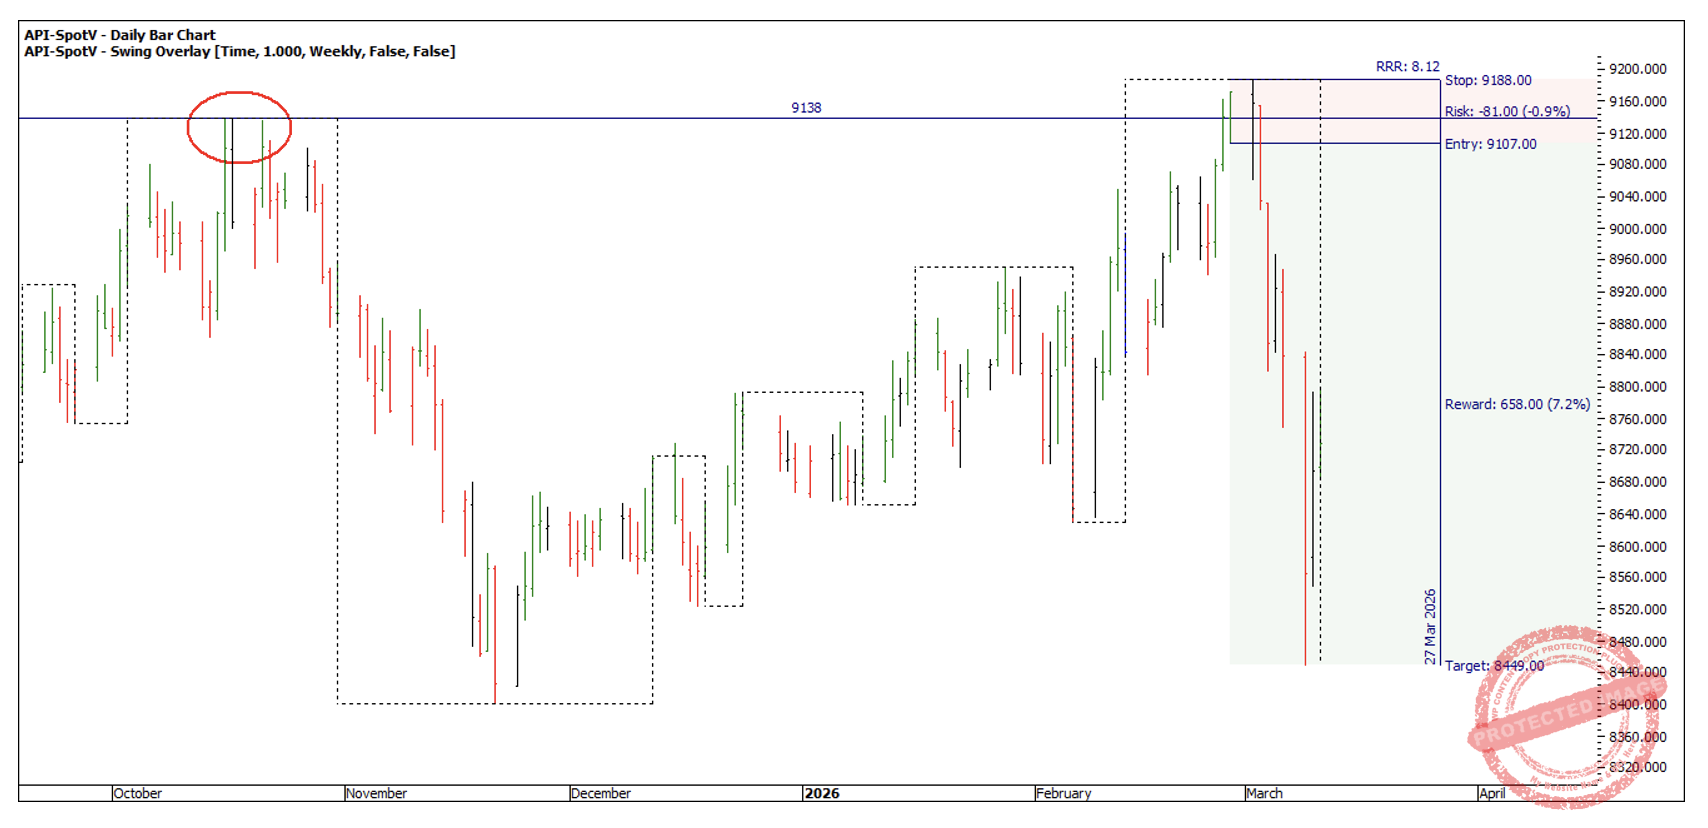
Chart 4
So far, the market has produced a strong spike down, and you could have banked a maximum of around 8:1 Reward-to-Risk Ratio (RRR).
However, if you look for an entry on the 4-hour swing chart, you can really turbocharge your RRR.
Of course, the lower the time frame, the higher the risk of being wrong and stopped out, so that’s something to keep in mind and be prepared for.
In this case, the previous top was at 9138, and the 100% monthly swing milestone was 9179. Once that 100% milestone was hit, we could begin looking for a swing entry depending on your risk tolerance.
An aggressive entry might have been to enter as the 4-hour swing chart turned back down after reacting off 9179.
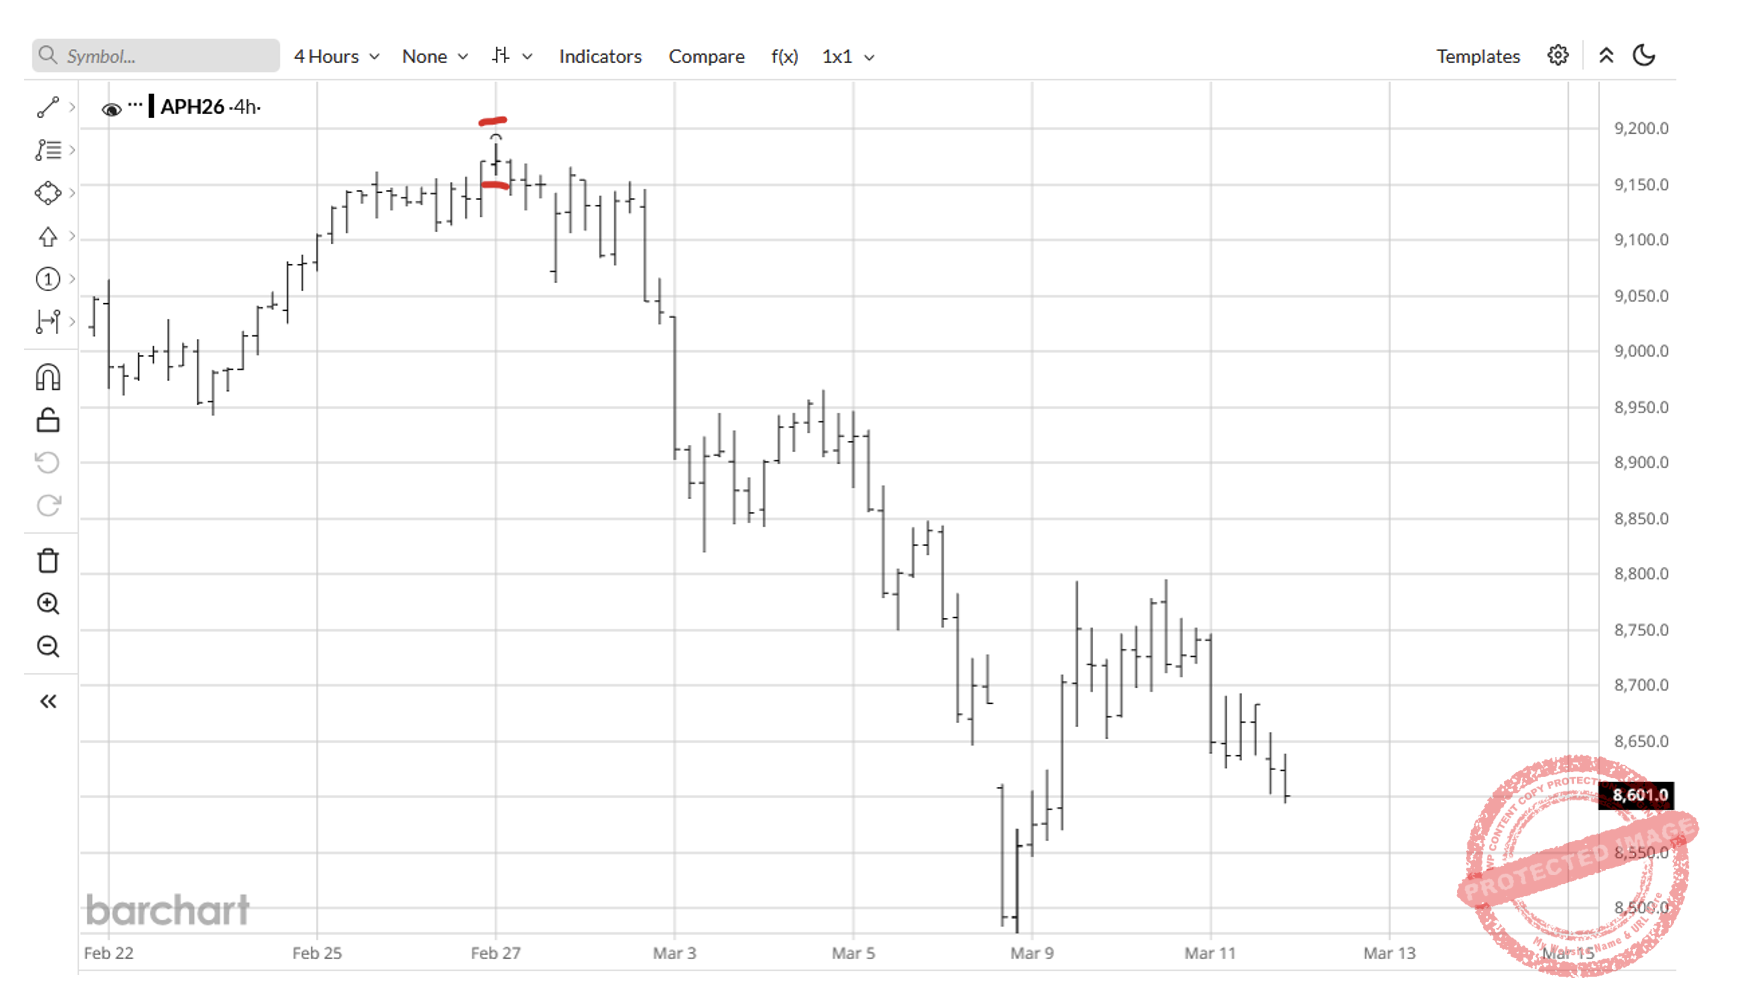
Chart 5
In this case, the entry that presented itself held, meaning you could have been in the market on the first attempt – which is always a great feeling.
With an entry at the low of the bar at 9157 and a stop above the high of the bar at 9188, the risk was only 31 points. That’s less than half the risk of the daily swing chart entry.
So the trade moves from a potential 8:1 RRR to around 22:1. Of course, that’s a best-case scenario, but it’s a great example of how a 4-hour swing entry can dramatically boost your Reward-to-Risk Ratio.
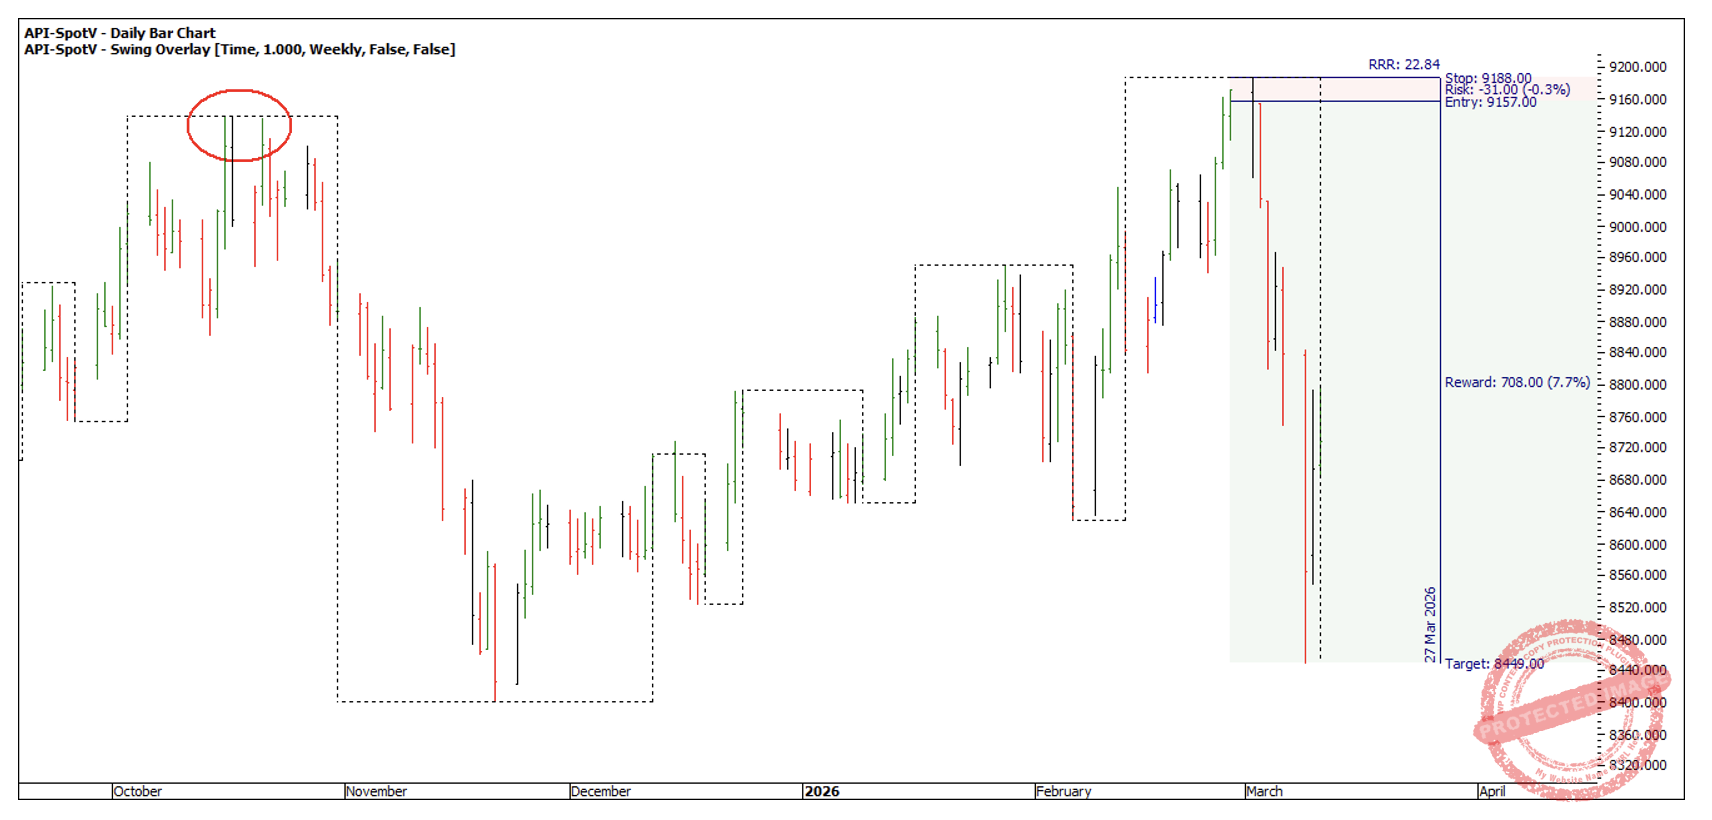
Chart 6
There was also the first lower swing top entry, which may have felt less aggressive since you were entering under the old top.
When you remove the noise of the news, it’s amazing how often the swing charts seem to tell the story.
Happy trading,
Gus