
Simple Systems
The Value of Layering Dimensions
This month I return to an old friend in the form of Boeing.NYSE. This stock has an affinity to me based on my previous passions and is one that keeps me engaged as it experiences volatility and movement that is often aligned to the factors that impact commodities markets. Keeping in mind aircraft are in simple terms a commodity required for aviation, albeit highly refined from the raw materials of which they are constructed.
Gann gives us the foundation of three dimensions to measure markets in. If we can keep simple applications of all three, we can be on top of most of the moves most of the time. Nothing replaces a deep understanding of the DNA of a market but as often noted it is incredibly challenging to be across multiple markets at that depth. I find my engagement with this market allows me to drop in and out as required without being overwhelmed, it does however require some good habits and also some patience.
Chart 1 shows us the price action, a bar chart with a swing overlay and the weekly trend filter. In simple terms a daily uptrend against a weekly uncertain trend.
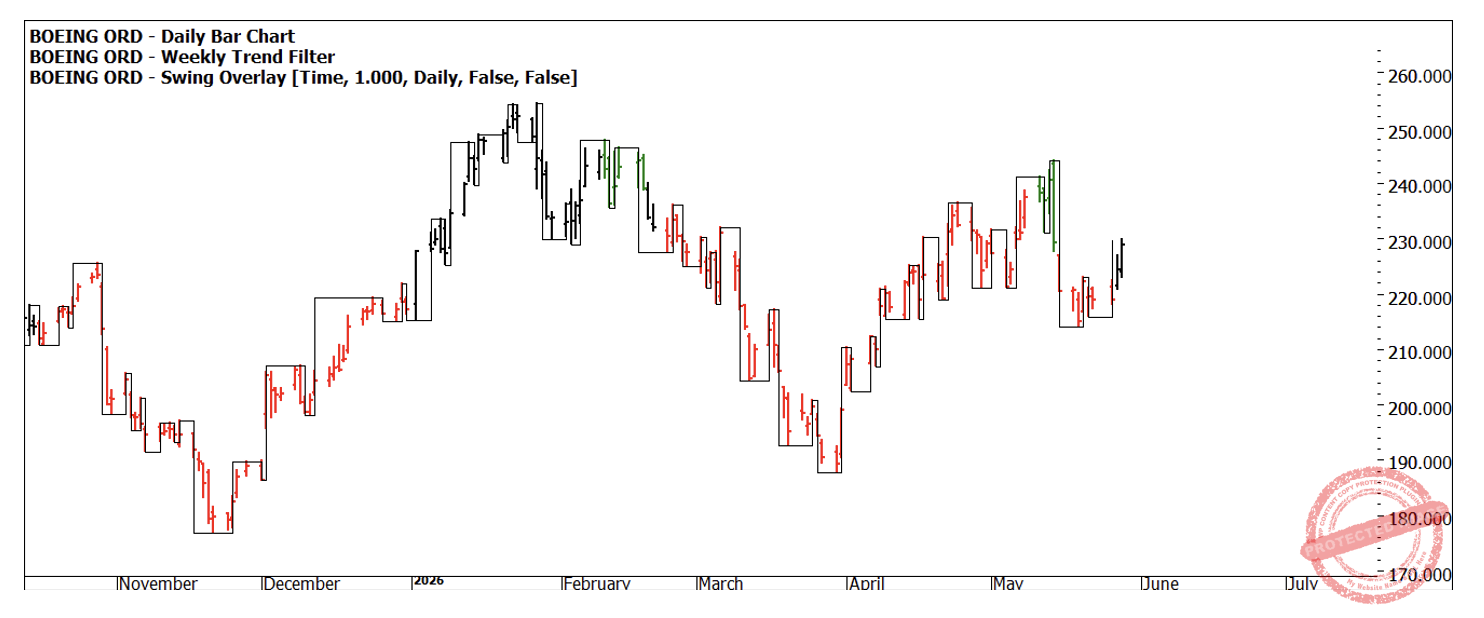
Chart 1 – Daily Bar Chart BA.NYSE
Chart 2 offers up some more price analysis, of note is some gaps not yet filled and the use of 50% retracements holding as support and resistance, acting on the way down and the way up. For me this market is deciding what is next and I am awaiting confirmation as to which way it decides to go. The large signal bar (outside reversal bar) on the 14th of May is an important indicator.
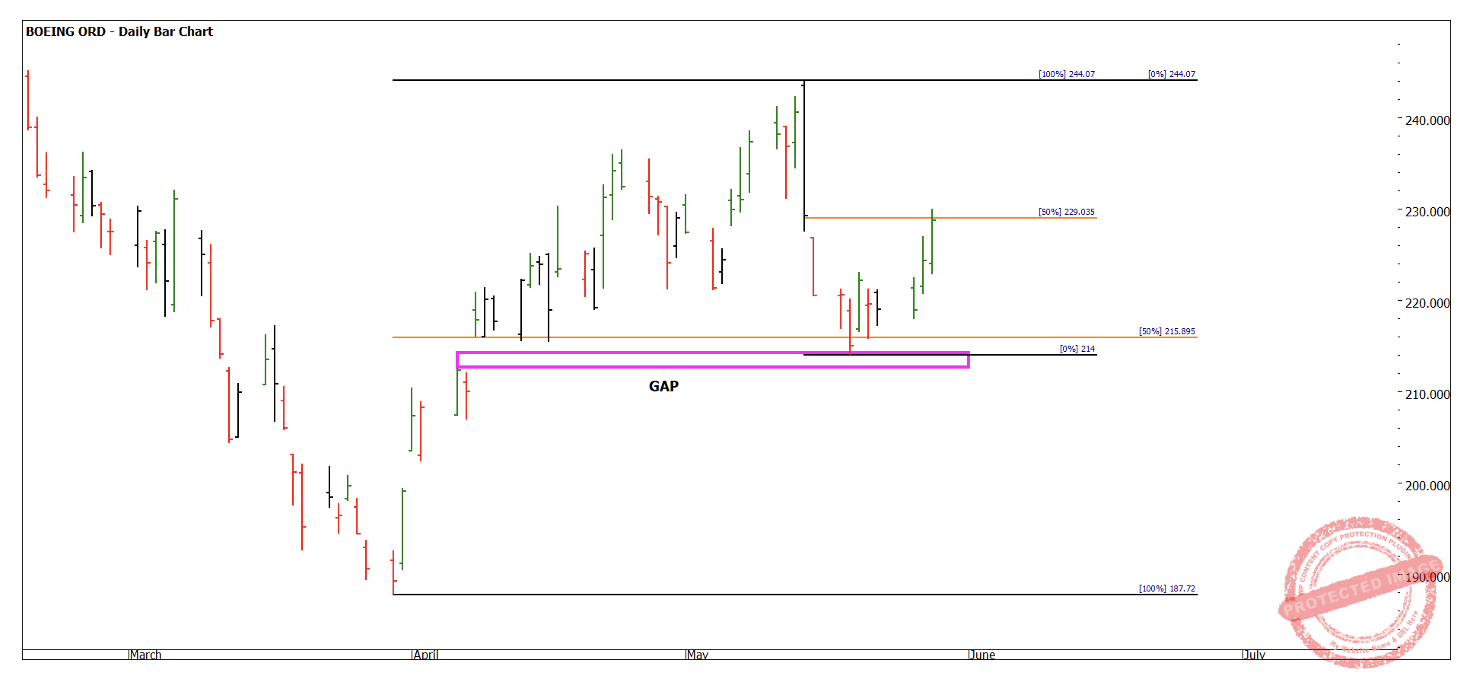
Chart 2 – Daily Bar Chart BA.NYSE
Chart 3 examines the day counts in calendar days over the last 2 years or so. There is also value in creating the same chart in trading days for greater understanding. These numbers should seem familiar in their raw form as well as the repetition and harmony.
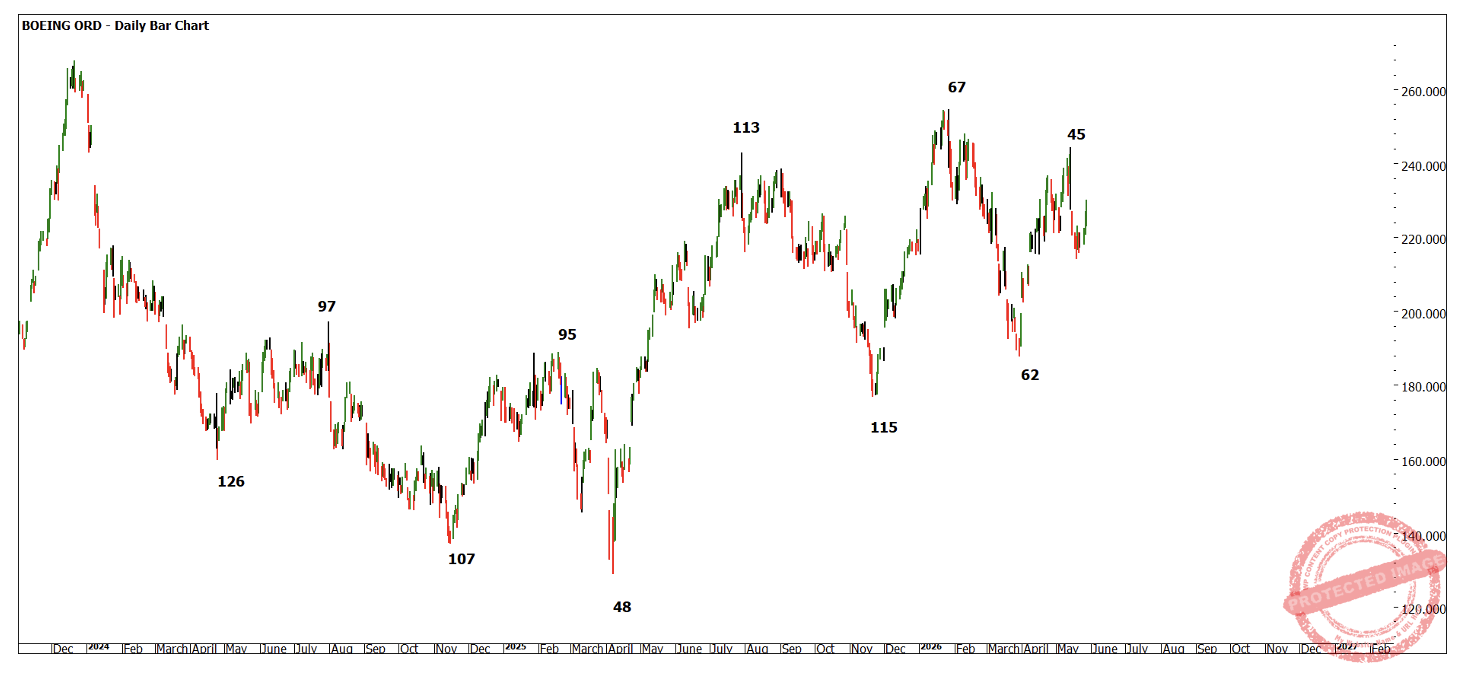
Chart 3 – Daily Bar Chart BA.NYSE
Chart 4 combines some price forecasting as well as some third dimension as we see the major bullish range from April to July last year repeating into a 50% level in May this year. It also closely squares out the range with a 4 x 1 off the same April 2025 low.
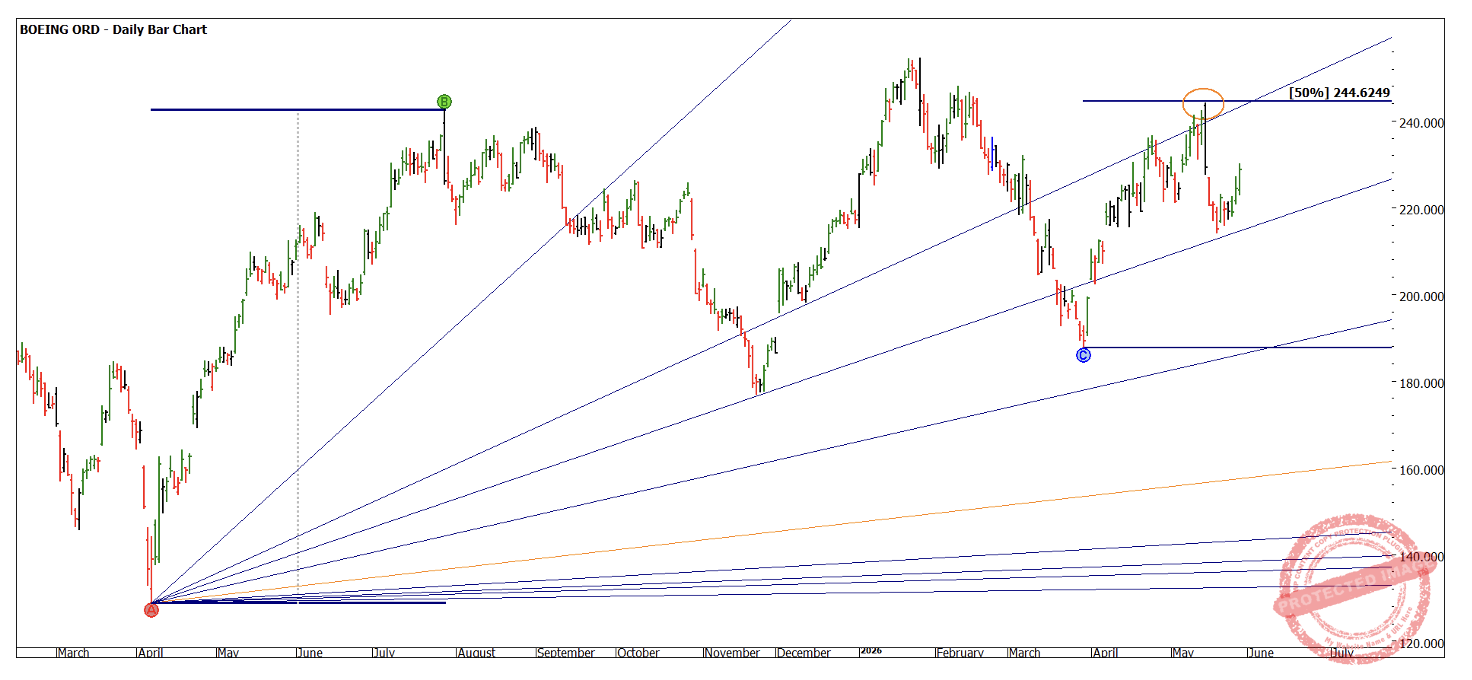
Chart 4 – Daily Bar Chart BA.NYSE
The value of a market square that is working well and delivers major turns cannot be overrated. The low of $89 that formed in 2020 (Covid low) has consistently delivered when it comes to tops and bottoms appearing at strong and weak parts of the square as noted Chart 5.
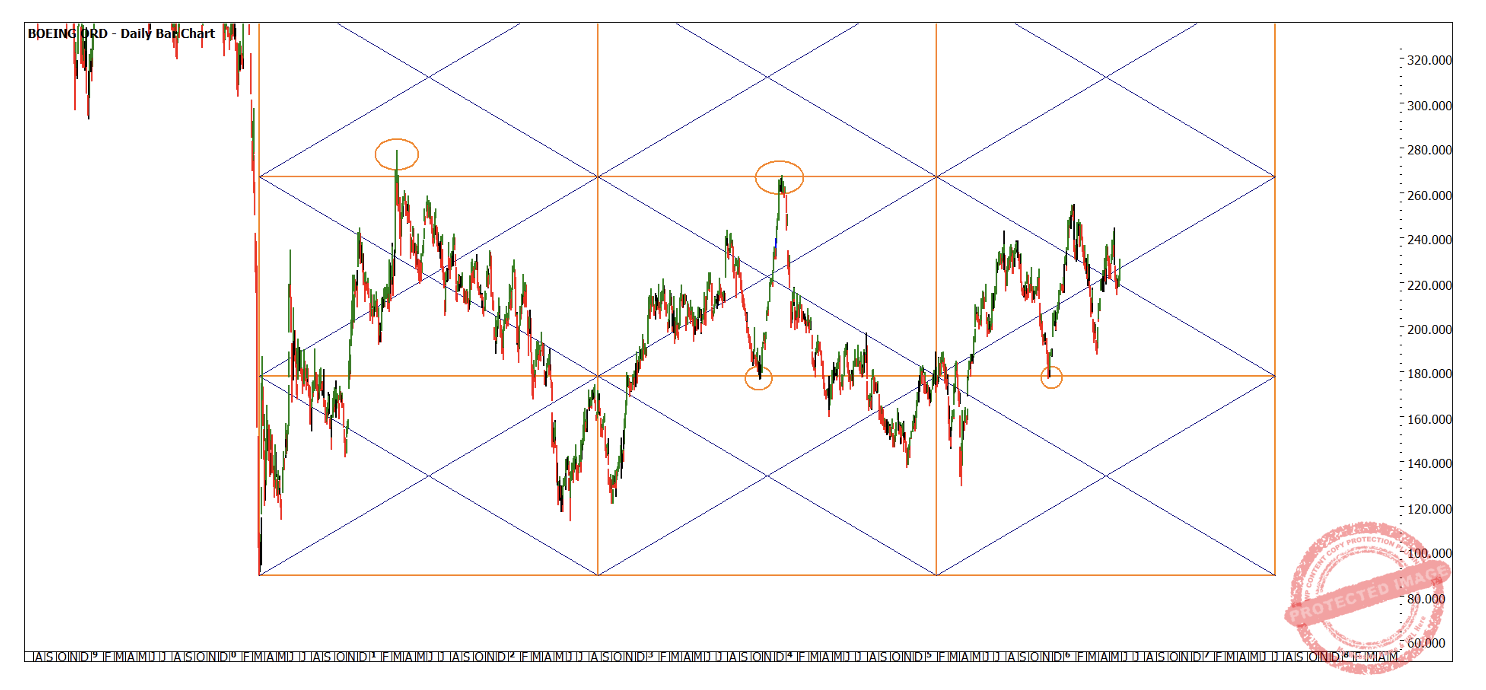
Chart 5 – Daily Bar Chart BA.NYSE
Charts 6 and 7 are adjusted for calendar days and trading days that do not recalculate the price levels but adjust the time basis and therefore the position of the major diagonals. Chart 6 is in trading days and shows the current high being squared out on the 1 x 1.
Chart 6 shows we are in the neutral part of the square and there has been some recent support off the diagonals.
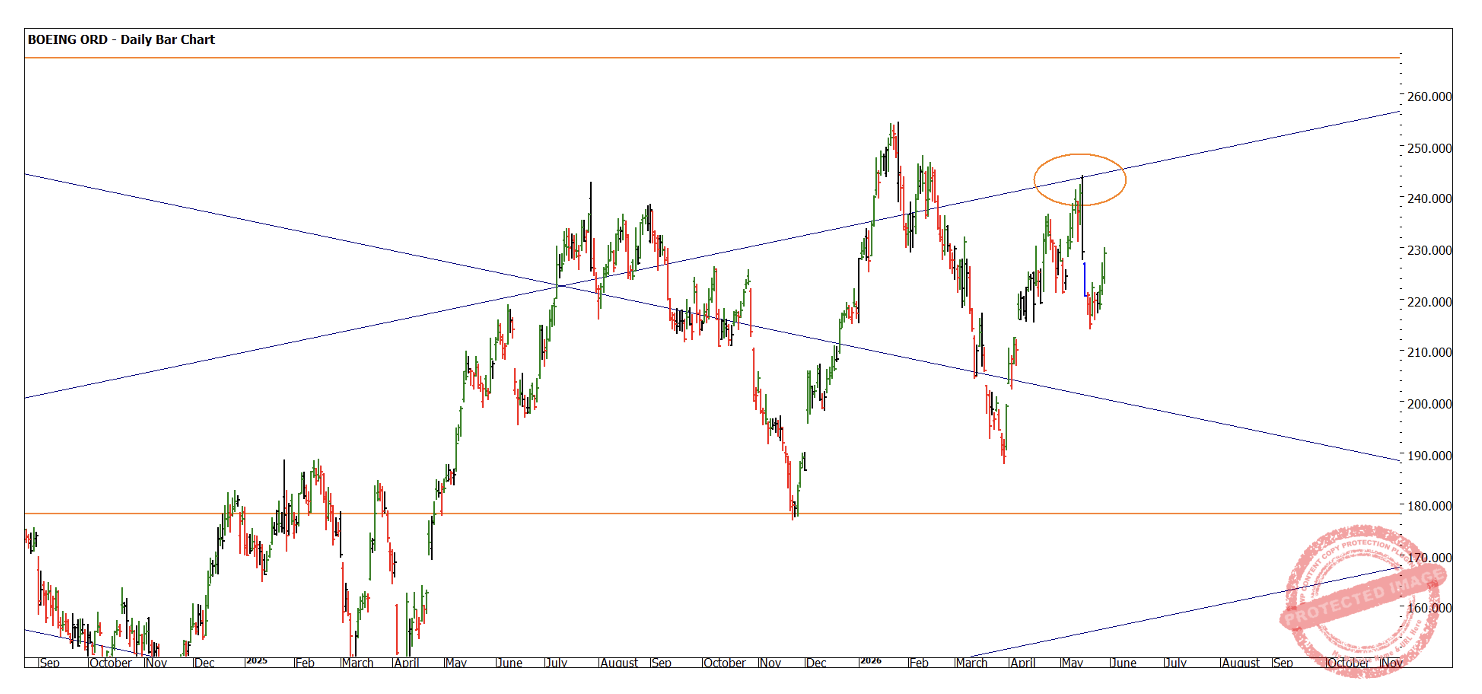
Chart 6 – Daily Bar Chart BA.NYSE
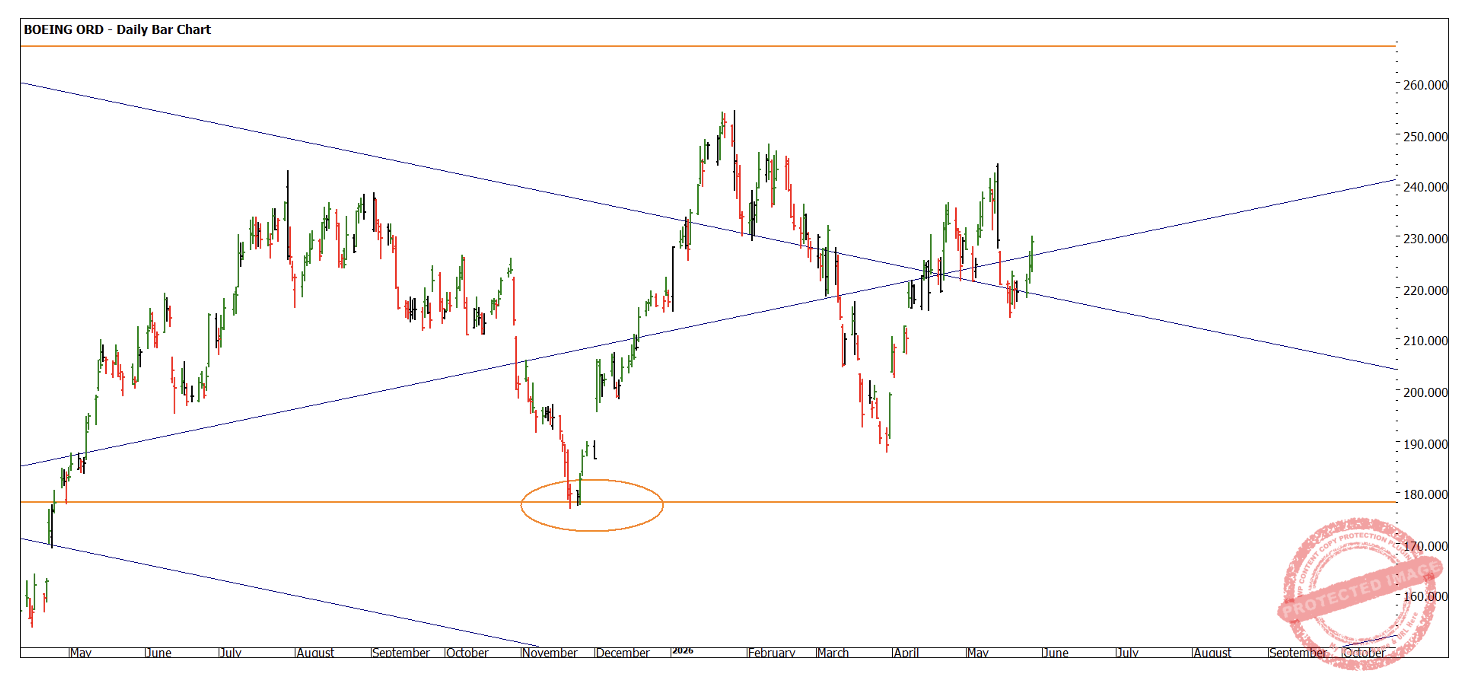
Chart 7 – Daily Bar Chart BA.NYSE
Maintaining and checking these charts allows me to layer my view on when I might expect an area of higher probability to watch for a change in trend or where resistance is broken and there is a continuation of a trend.
Your homework is to build a summary of information of prices and possible dates that you would like to be alerted about if they are triggered, then build possible scenarios of what you may action if they do.
Layering of ideas is initially challenging as it can increase inputs making it harder for us to distil the information we need. Keep it simple to start.
Good Trading
Aaron Lynch