A Simple Plan
David Bowden said to watch for an ‘Indication of a change of trend’. The best one I know of is the Overbalance in Price!
After last month’s article I was watching for the potential for a triple bottom to be confirmed by an Overbalance in Price to the upside on or above the major 50% level.
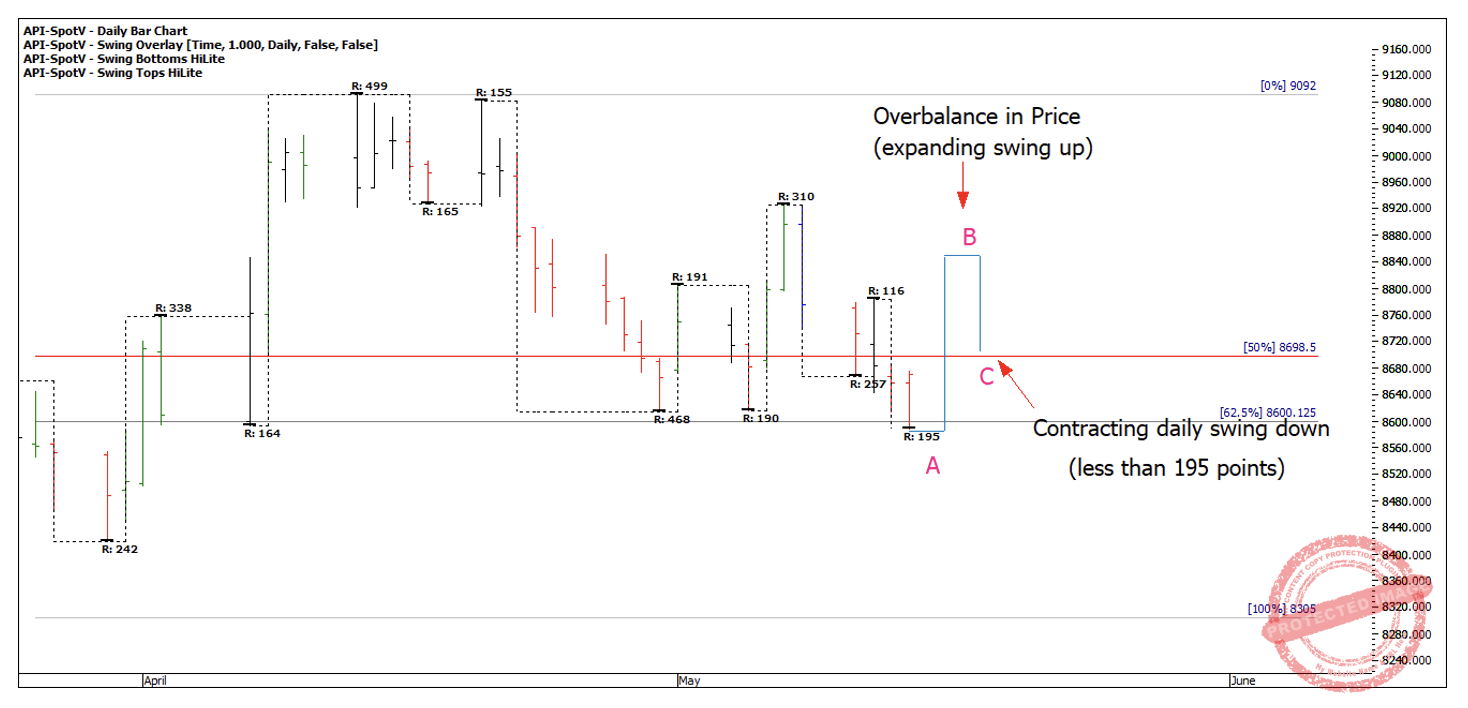
Chart 1
Waiting for this confirmation kept my capital safe as I saw no entry for a long trade. My form reading skills then gave me the ability to read the market as it was unfolding as the next day saw the market rally into the 50% but couldn’t close above it. Interestingly, the 15 May bar gave me what I now call the ‘Long Wick’ a term which I have adopted from Darren (thank you Darren!)
In this case a low open, a run up into a 50% retracement, a low close and a long wick is a real sign of weakness, especially after just touching the 50% to the exact point! The longer the wick, the weaker it appears to be.
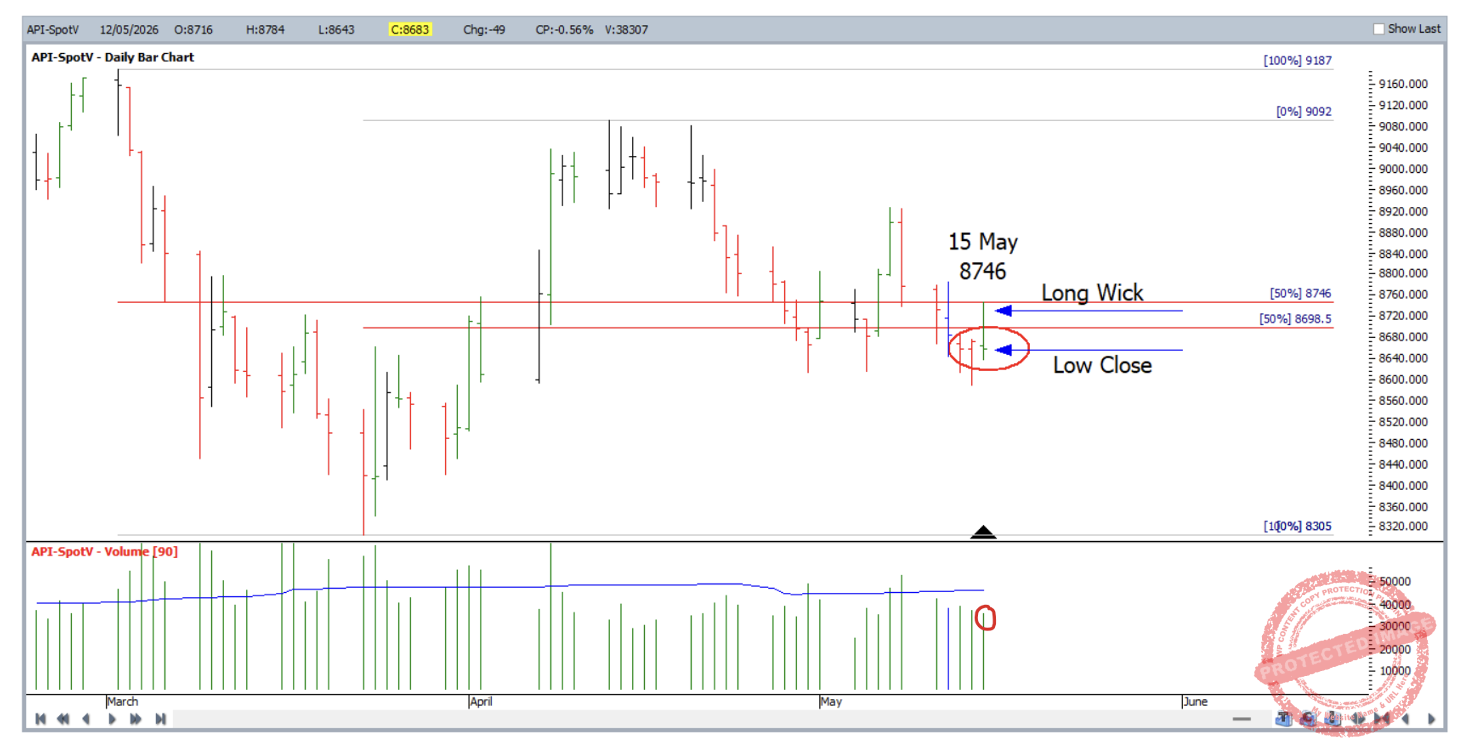
Chart 2
The 15 May bar saw a drop in daily volume, also not a good sign that the market was going to push up.
Still, it just goes to show that if you wait patiently for the right setup or the confirmation, you can really reduce the number of potential losses.
Let’s examine a previous time this market put in a daily overbalance above 50%. The SPI200 made a monthly swing low (made by an outside month) on 6 February 2026 and found support on the 50% retracement.
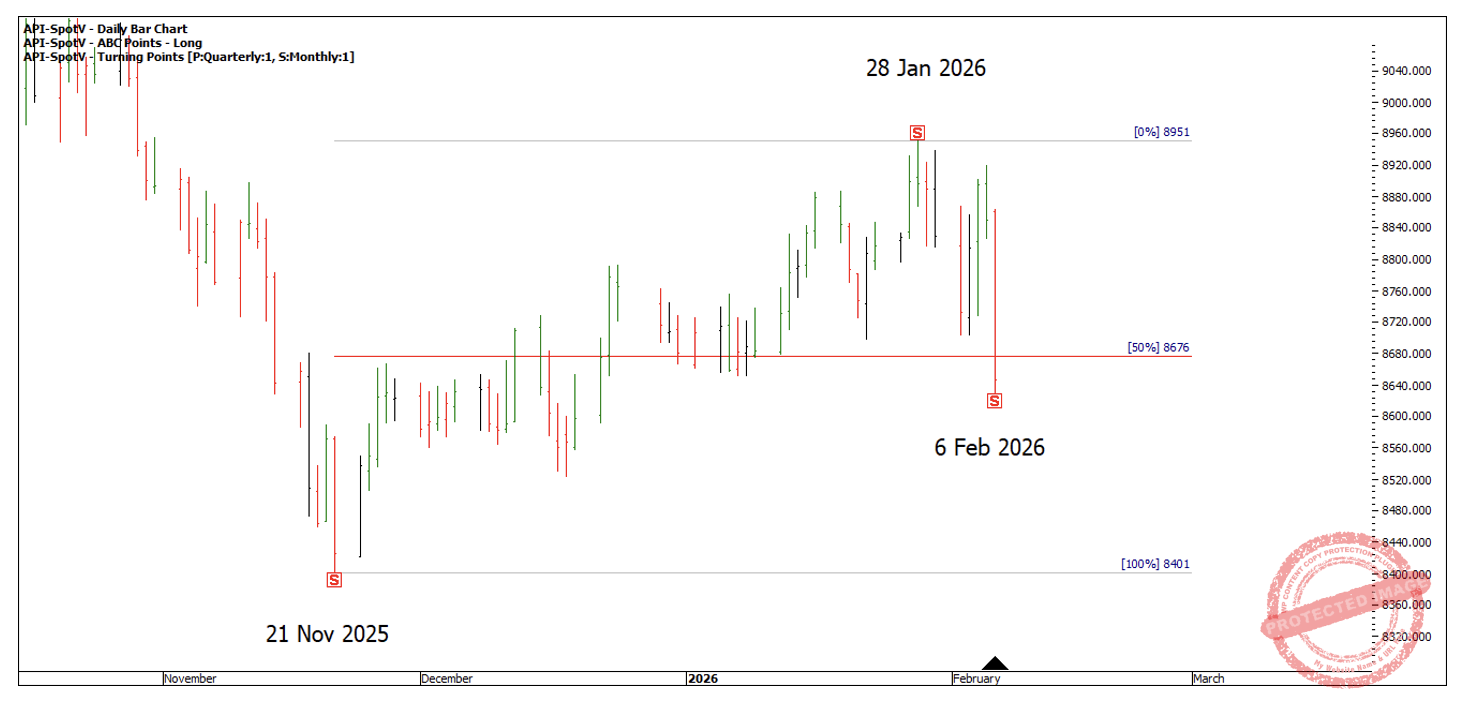
Chart 3
We then saw a very large daily Overbalance in Price to the upside forming a daily ABC pattern on 16 February. The ABC itself has a 56% retracement, or close enough to 50% in my books, and above the larger 50% support level.
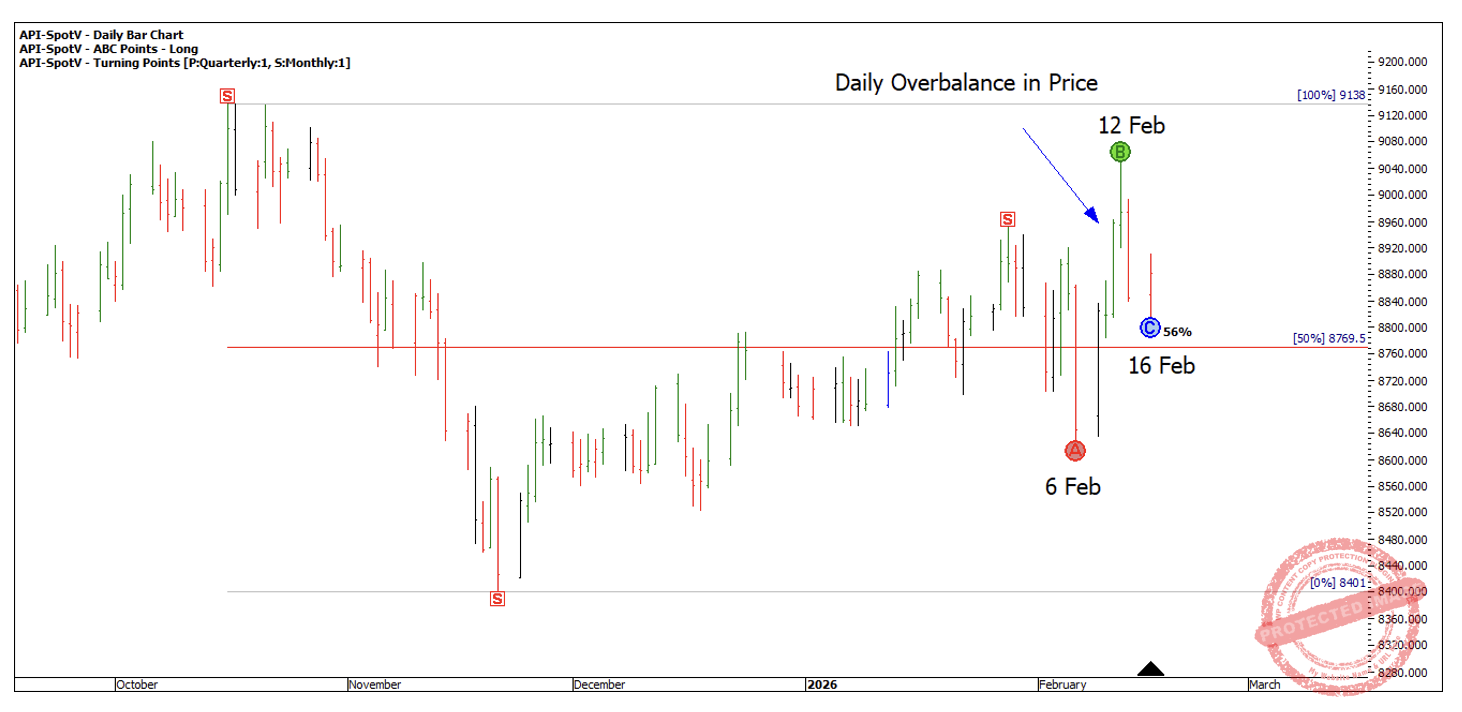
Chart 4
If you look at this period of the market on a daily swing chart, this kind of picture is classic swing chart setup.
- Expanding range up of 420 points compared with the previous range of 216 points
- Contracting swing range down of 234 points compared with the previous range of 291 points.
- Above two very relevant 50% support levels.
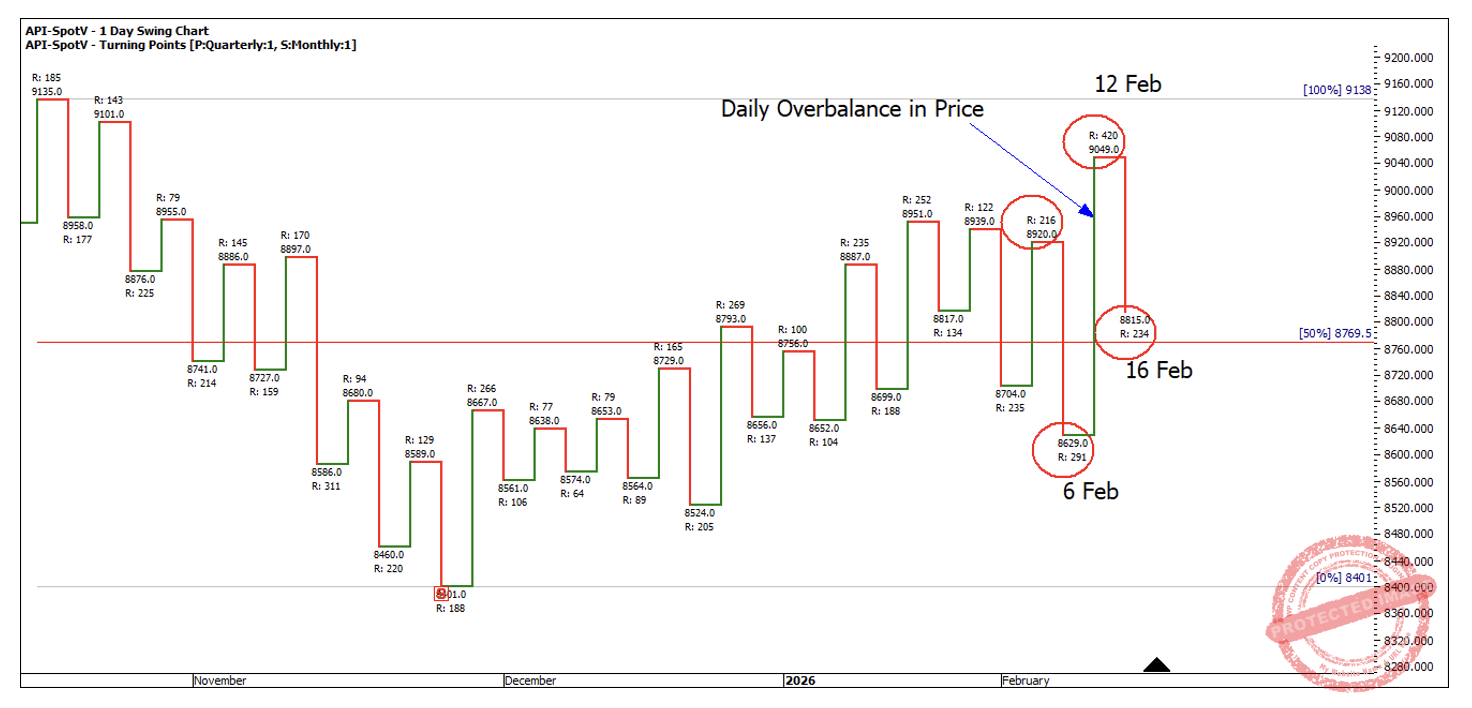
Chart 5
Now if we think back to the BHP trading exercise in the Smarter Starter Pack, we could use the Stock Style trading plan, to trade this setup. The rules being:
- Enter by 25%
- When the market reaches 50% move stops to entry plus commission
- Take profits at 75%
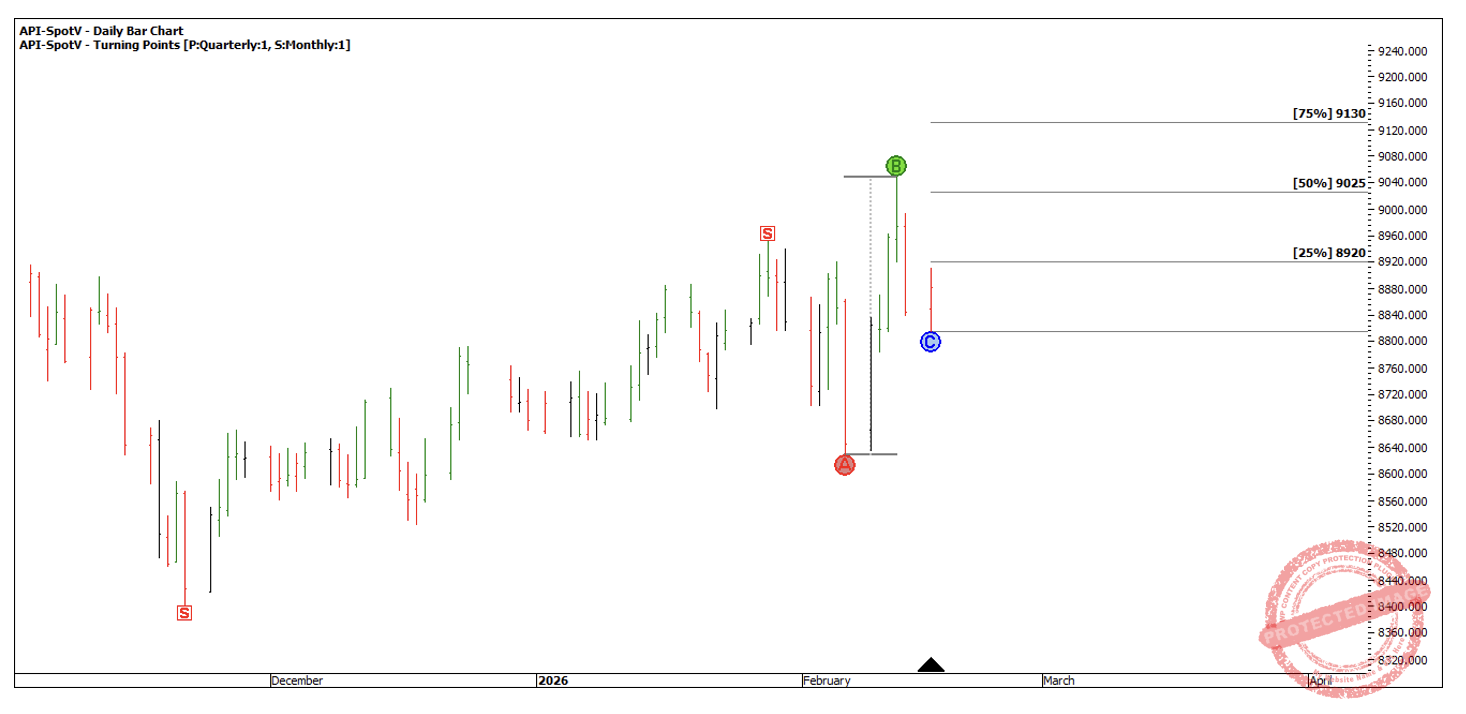
Chart 6
The details of how this daily ABC trade unfolded is as follows:
Entry: 17 February at 8911
Stop: 8814
Risk: 97 points
19 February: Market hit 50%, move stops to E+C.
26 February: 75% milestone hit, profit taken at 9130
Profit: 9130 – 8911 = 219 points
Reward to Risk Ratio = 2.25 to 1
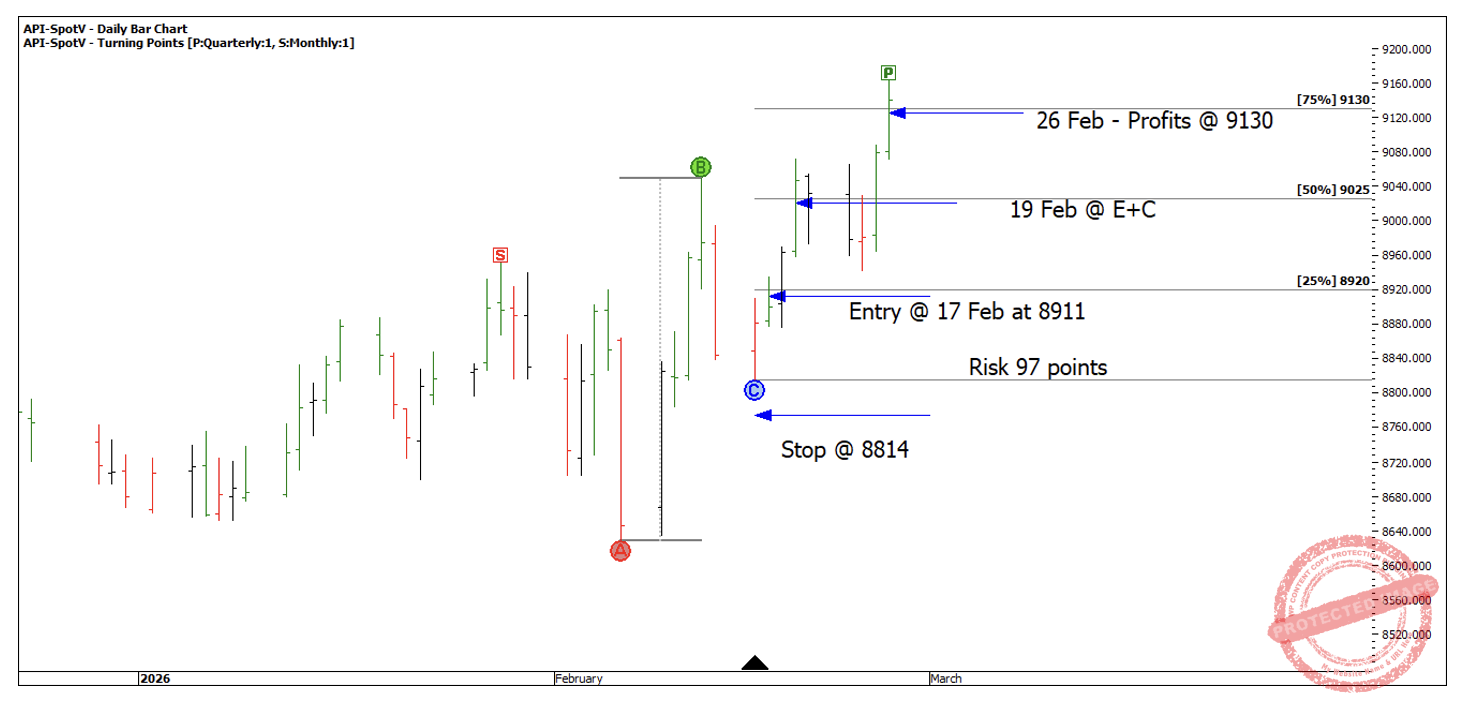
Chart 7
Simply looking for long ABC trades above 50% retracements or short ABC trades below a 50% retracement, is a great place to look for high probability ABC trades!
Happy Trading,
Gus