Golden Memories
The year has progressed more quickly than ever, and as those older than me suggest, time definitely speeds up. For traders in the 2025 and 2026 Ultimate Gann Course Coaching, June 10th has been a date on the radar for the Gold market based, of course, on history repeating.
I have been closely following a previous section of the Gold futures contract and applying it in the current environment. This concept referred to as a Road Map is a Master Forecasting Course technique and, in the week that we sadly lost David, it’s fitting for me that an opportunity to apply his techniques from Smarter Starter Pack all the way up, has materialised.
Chart 1 shows us the all-time high reached in January this year and the subsequent sell off. The pattern of note is the double bottom at approximately 75% of the all-time high.
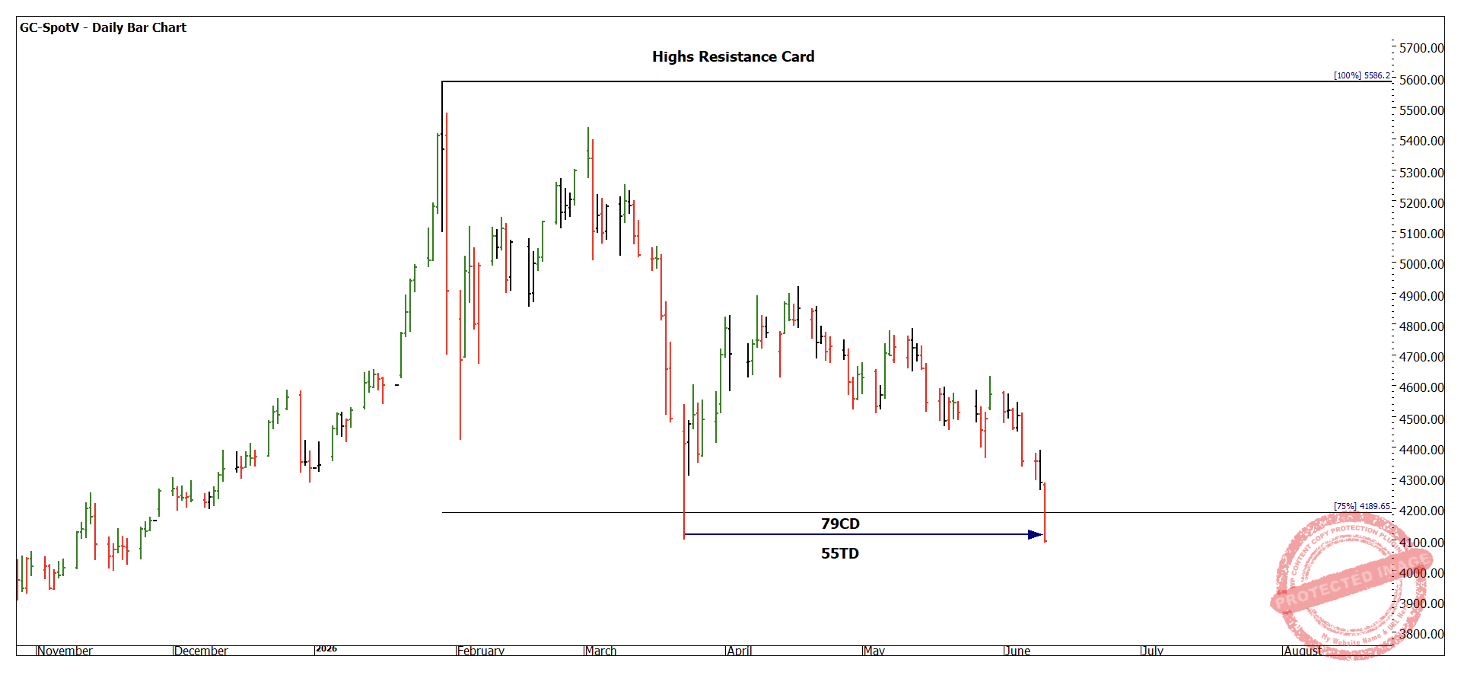
Chart 1 – Daily Bar Chart GC-Spotv
Chart 2 looks at price analysis to consider the retracement on the last major range. The price has come to sit at 37.5% or 38.2% depending on your preference.
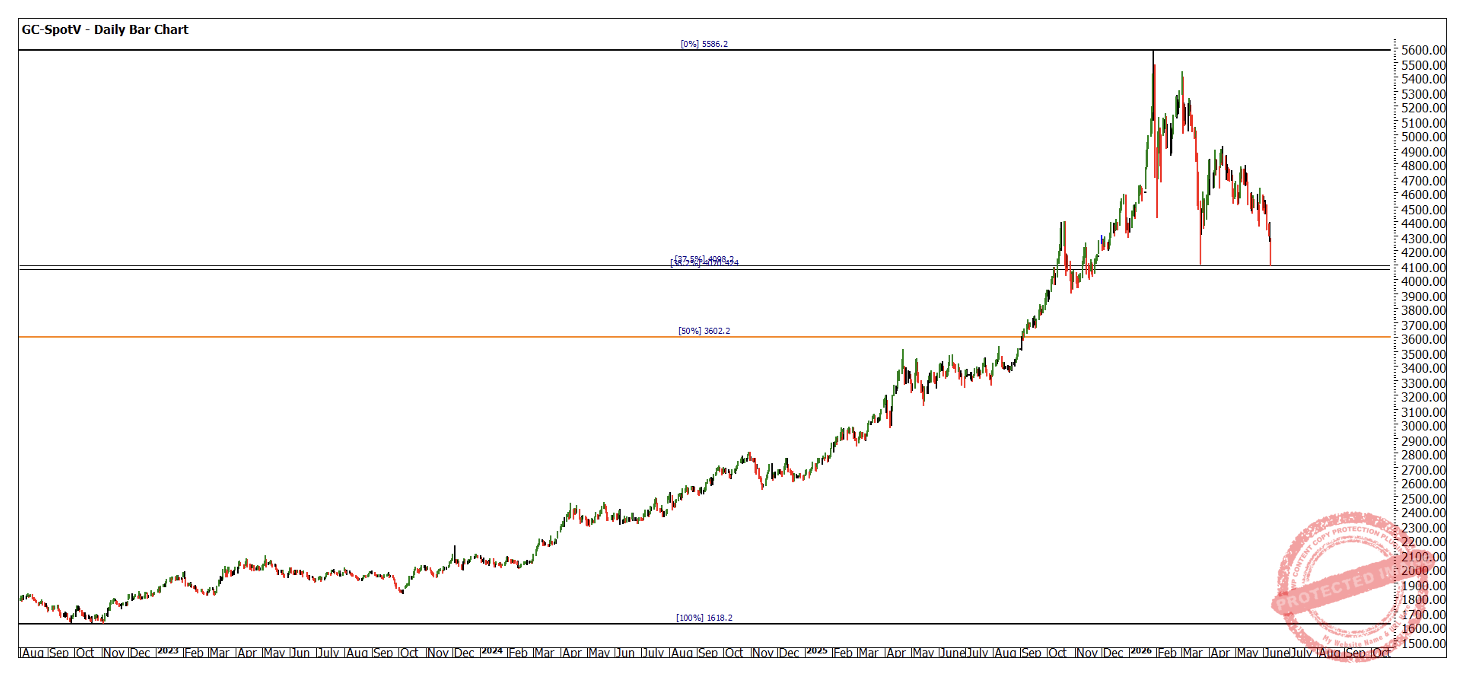
Chart 2 – Daily Bar Chart GC-Spotv
Using the First Range Out in a slightly abstract way we can see the current price levels of the potential double bottom repeating.
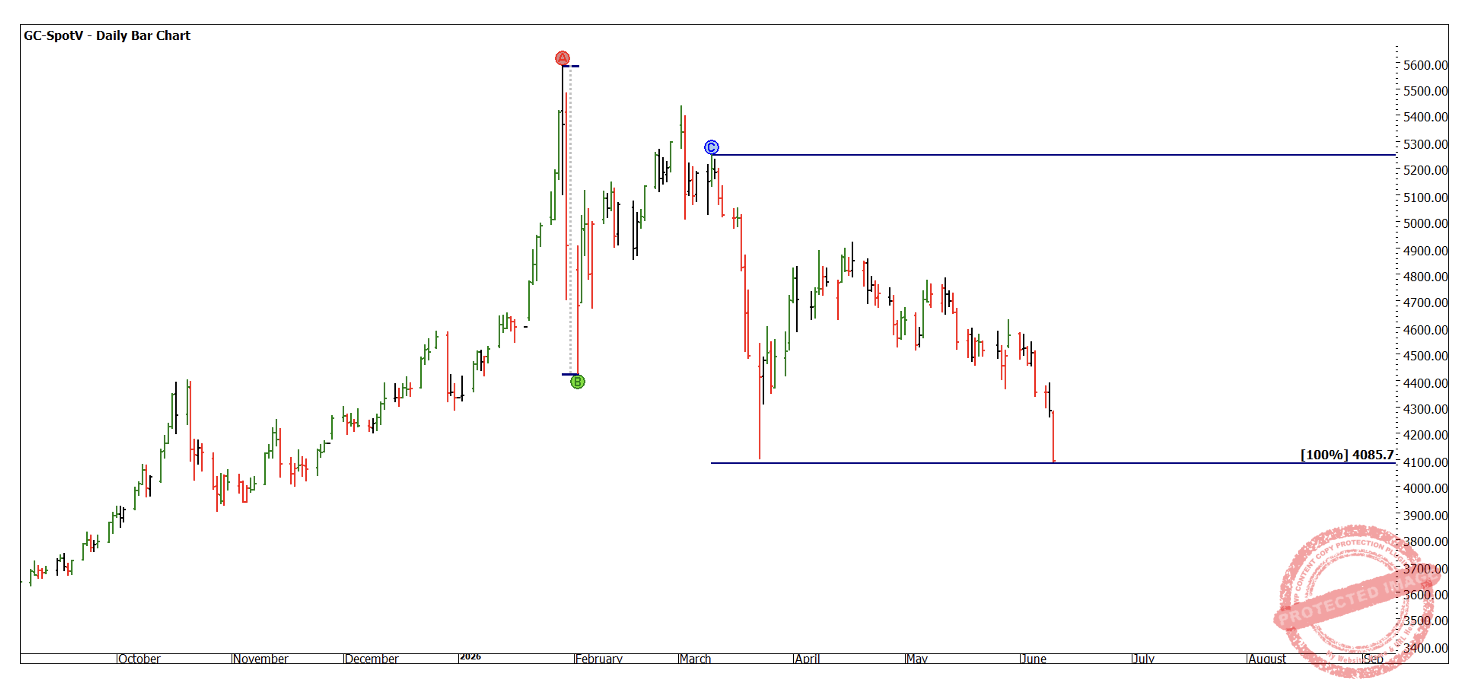
Chart 3 – Daily Bar Chart GC-Spotv
For the purpose of this article, you should work time counts and pure second dimension analysis for the 10th of June as a homework assignment.
The next chart looks at the position of the market with squares. The square of the all-time low and its position in that square is important.
You will note that both points of the double bottom sit on a full multiple and in the case of the second leg has pushed into the strong part of the square, possible acting as a springboard.
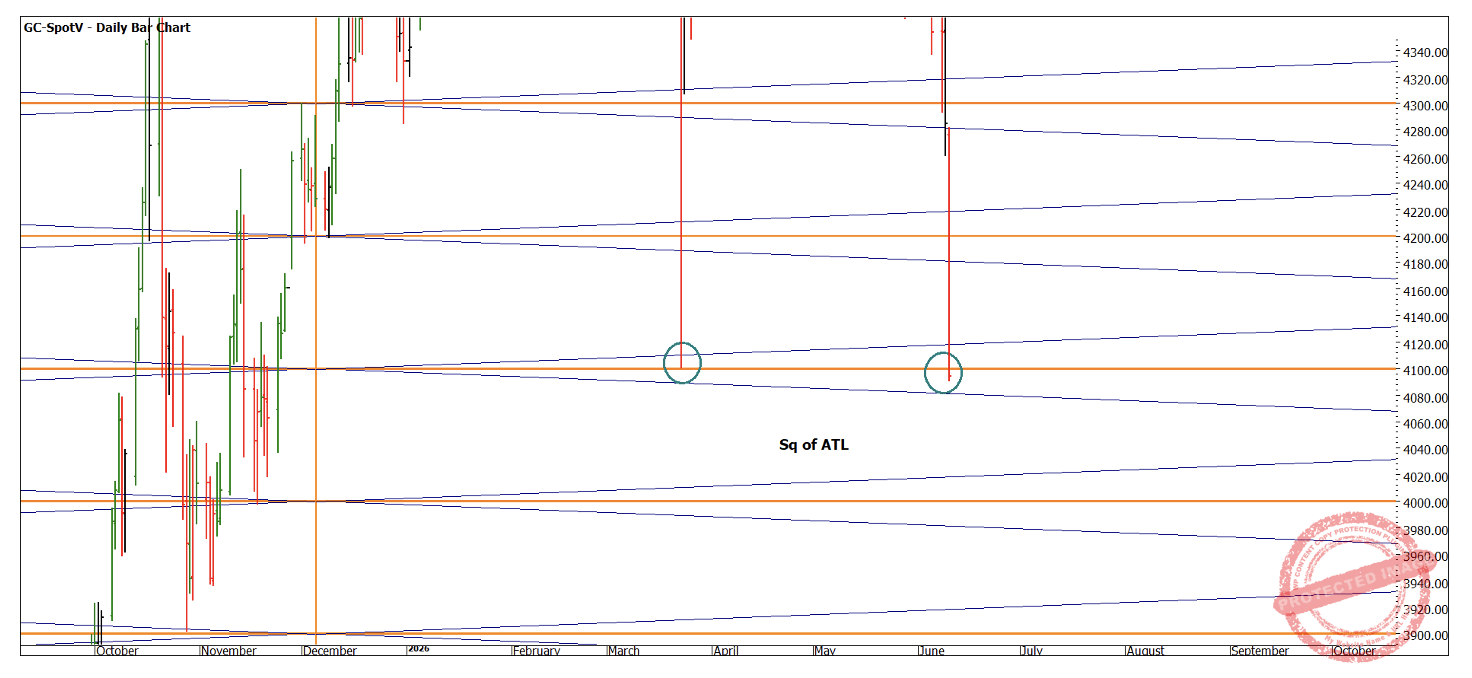
Chart 4 – Daily Bar Chart GC-Spotv
I have included a natural Square of 144 from the all-time low as well. The current data in ProfitSource has not yet pulled in the current session, so the arrow line marks the lowest price in the session and it suggest price has come to sit in the strong part of the square on a diagonal.
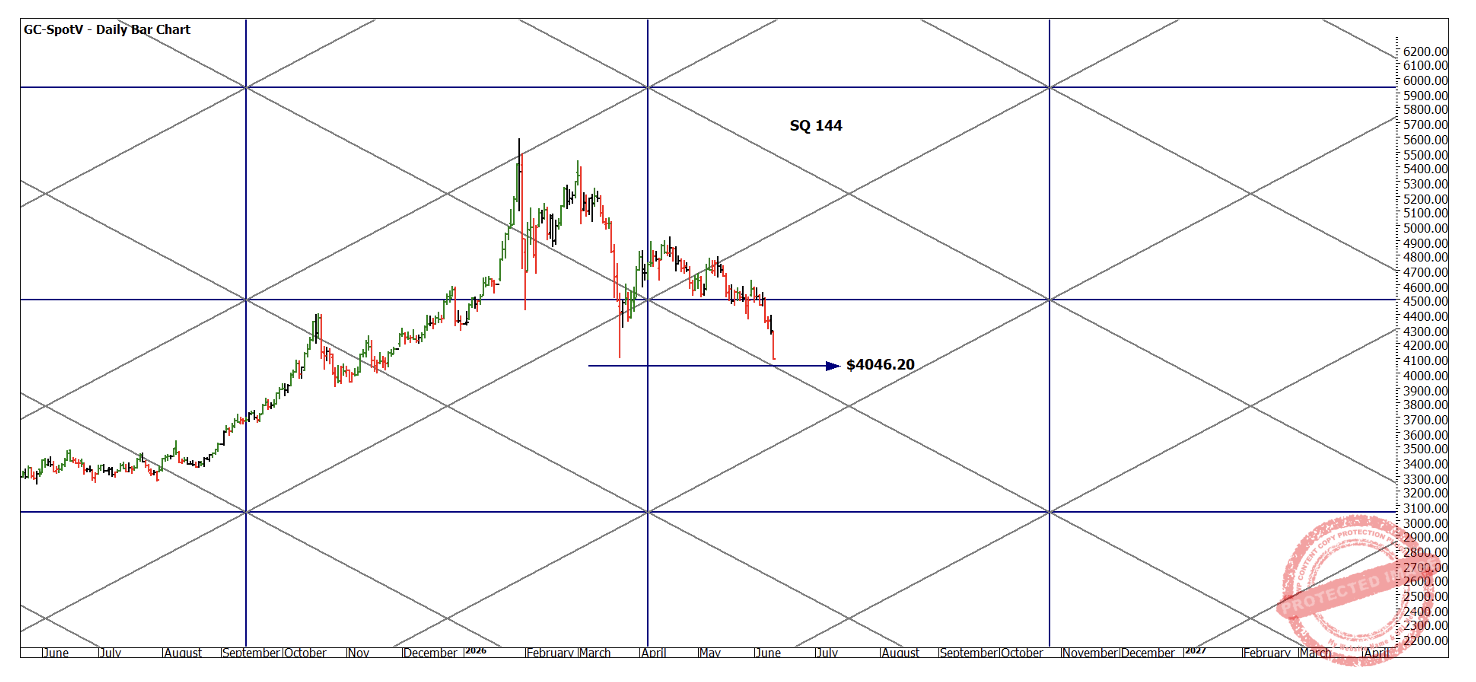
Chart 5 – Daily Bar Chart GC-Spotv
Chart 6 takes us to the 1-hour chart for the most recent session. Using a higher bottom entry on the 1-hour chart has allowed for a very close entry to what may be a pressure date. At this stage it’s impossible to know if this will continue in the way we might wish.
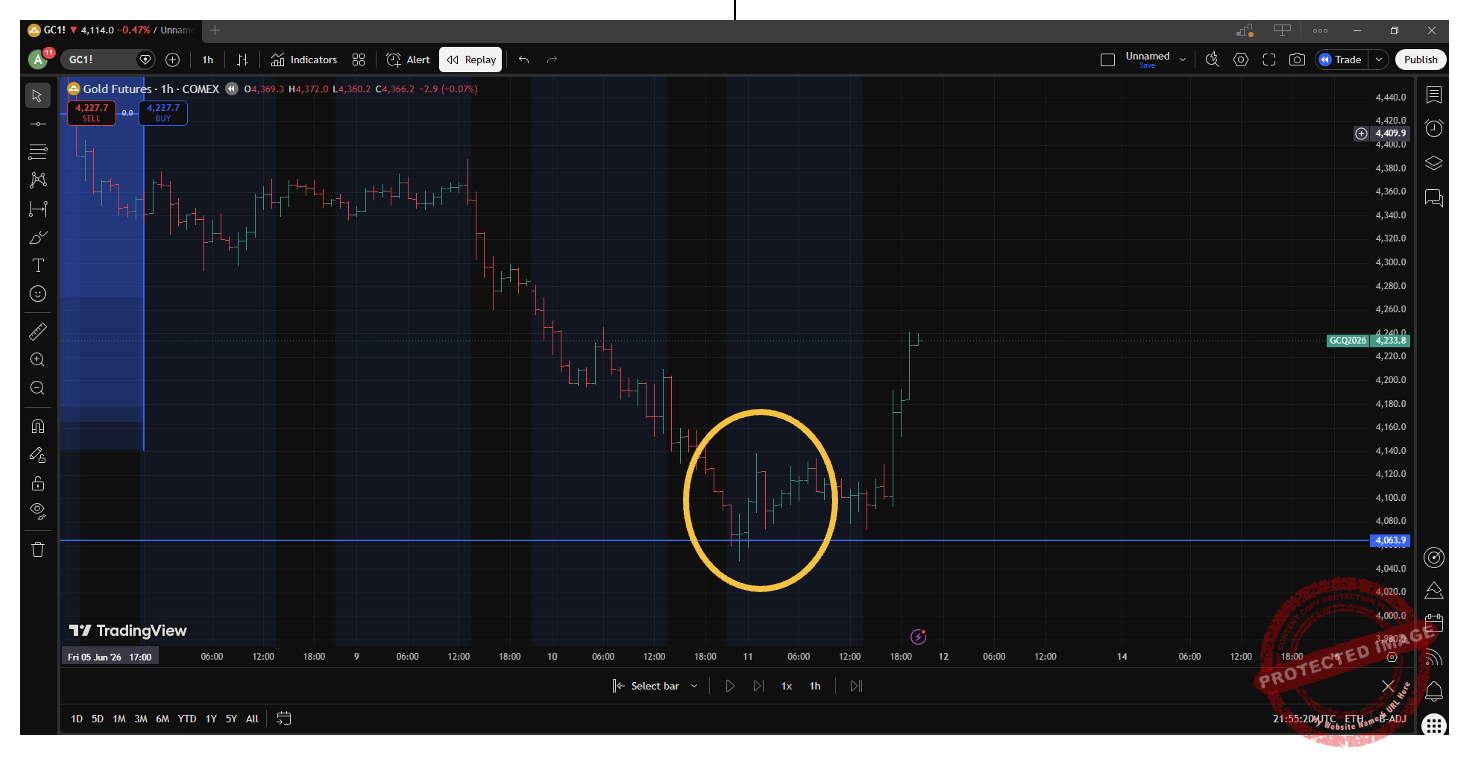
Chart 6 – 1 Hour Bar Chart Gold
The trade management now is paramount, with approximately $20 risk per contract, this position could already be at breakeven depending on your trading plan.
A research task for you would be to see what aspects can you combine to support a classic Gann setup at this junction?
Good Trading
Aaron Lynch