
Crude Update
The markets continue to provide movement as we have been discussing all year, the result has been the prepared have had the opportunity to take action.
Energy and in particular crude oil has become a focal point with the continued challenges in the Gulf region. We are seeing economies rebalance to renewable energy whereby last month we saw electric vehicle sales surpass combustion engine sales for the first time. This transition will have a significant timeline to roll down before we could ever suggest oil is a relic of the past.
We have seen the reduction in production of oil due to many factors, and this has created a springboard for price. The time-based analysis on crude has been shared with our Ultimate Gann Course students around the July low and it has shown that was a strong area to expect the market to move higher from.
Chart 1 shows us the upside moves we have seen since the low in July, if we use the cluster of highs around $110 from earlier this year we can see a number of repeating ranges into this price point.
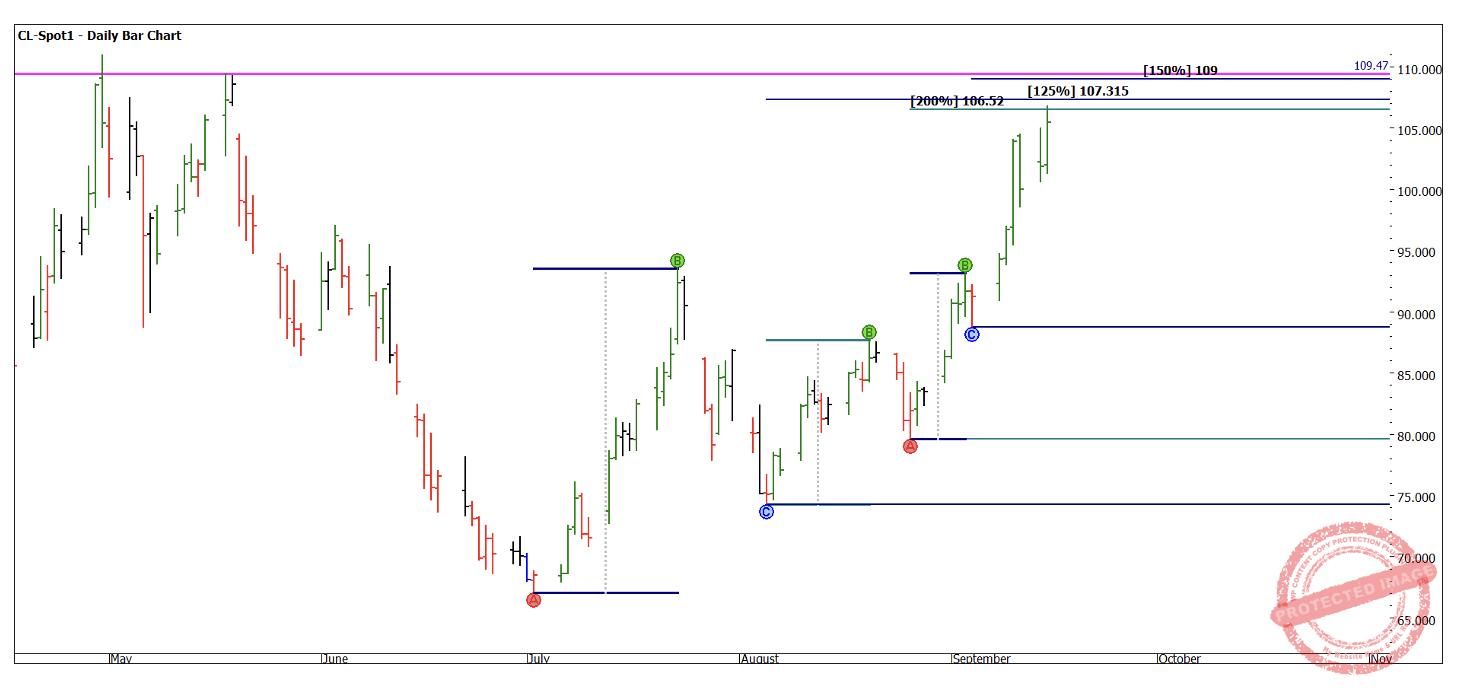
Chart 1 – Daily Bar Chart CL-Spot1
The ranges are showing expansion and moves greater than 100%, into what is resistance, so we could build into our trading plan a rule to tighten stops and look for a potential reversal. I am of course keen to see how our seasonal date rolls across the price action, but even into the first week of October looks to be a smart place to be staking. This is the value of having not only a price target but an additional filter of time.
The ABC point in early September had some good harmonies for Point C and as price broke Point B it accelerated to the 100% level. This setup delivered just under a 3 to 1 reward to risk ratio, the question you might ask yourself is how could have I identified the lows on August 5th and 26th as places to build from.
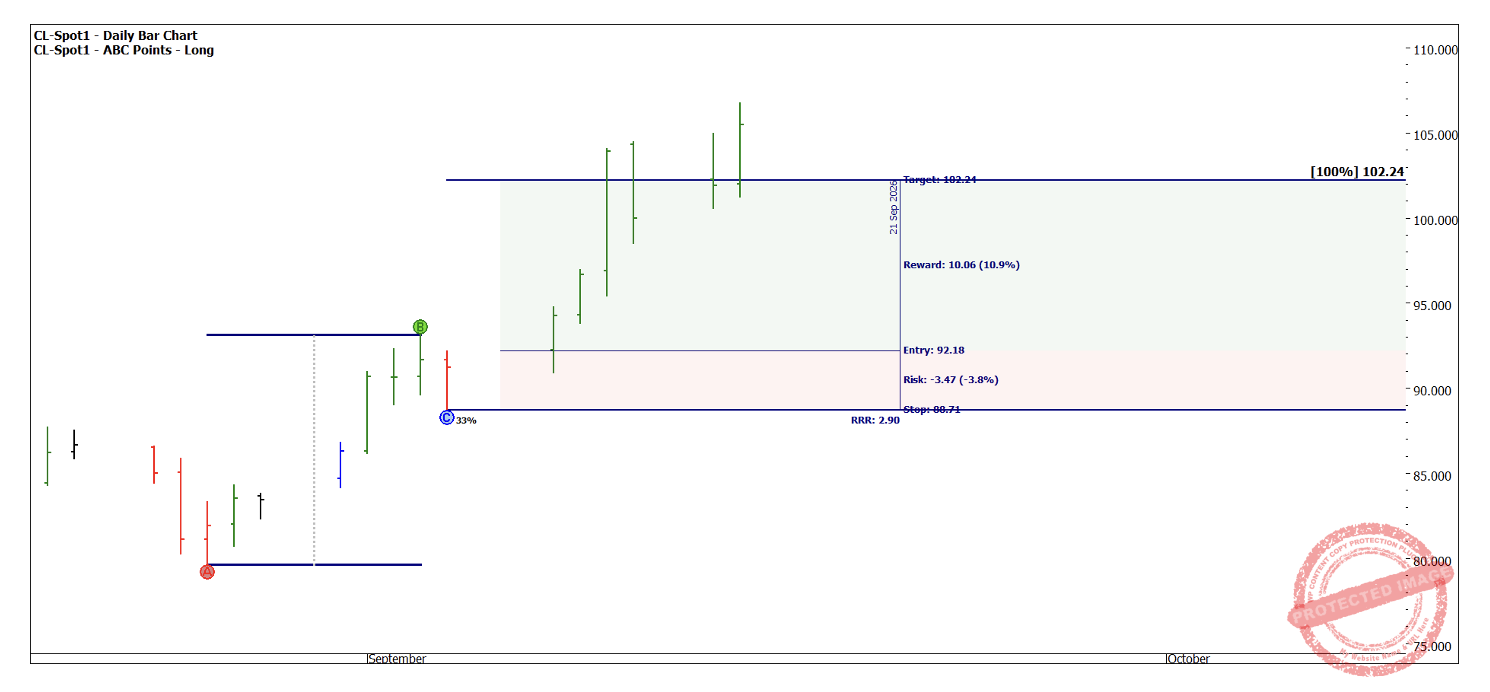
Chart 2 – Daily Bar Chart CL-Spot1
The value of a Lows Resistance Card also assists us here when we see the 2025 low in December at $54.98. If we double this, as we see in Chart 3, it places us very close to the highs of the year and would be a smart place to watch for the bulls and bears to battle out whatever is ahead.
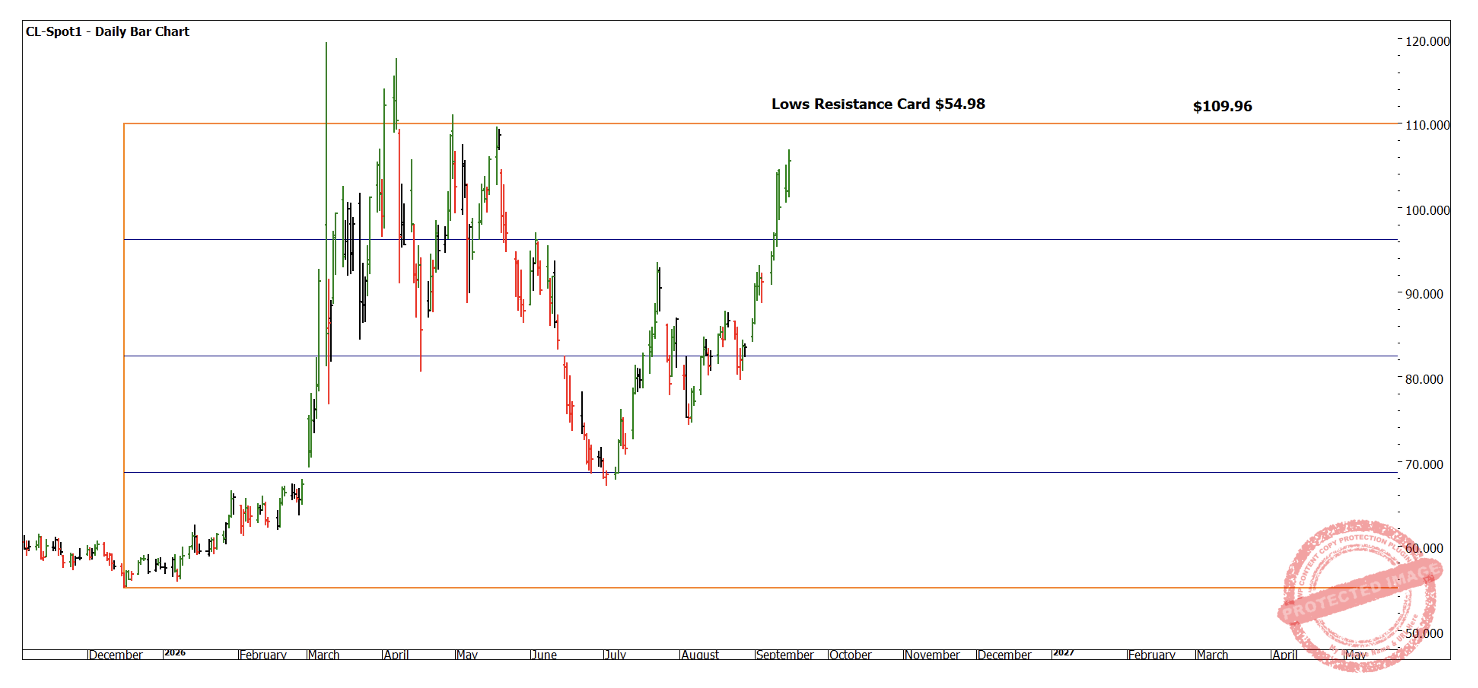
Chart 3 – Daily Bar Chart CL-Spot1
Chart 4 leaves you with another price calculation to consider, we know the value of 50% projections. In the case of crude getting into significantly higher prices, it must overcome the big picture 50%. If this can be breached, we may see oil prices at economically painful levels. We should be ready to understand either way the impact these levels could play on a technical basis.
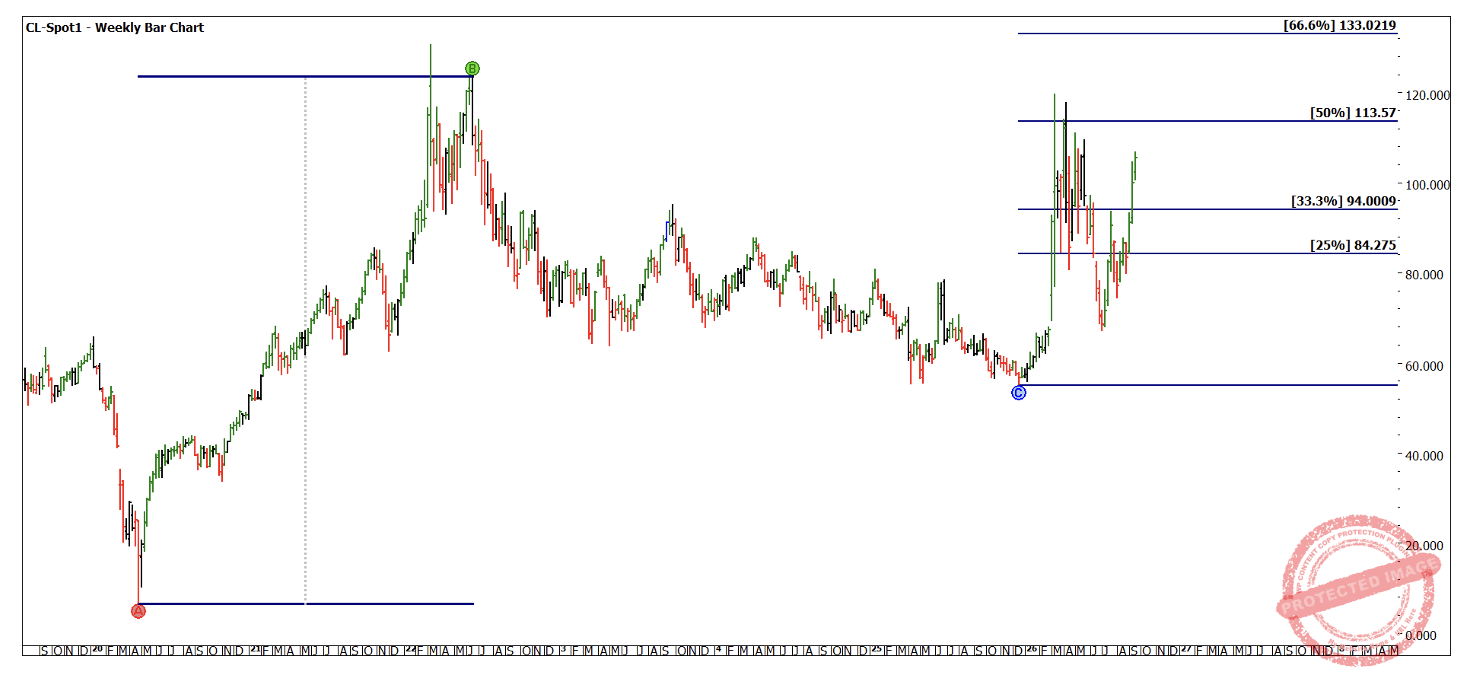
Chart 4 – Daily Bar Chart CL-Spot1
Good Trading
Aaron Lynch