
Commodities Update
This month we take a break from the usual format and do some general form reading on a few representatives of the commodities sector. Let’s take a look at the charts and see what sentiment could be established.
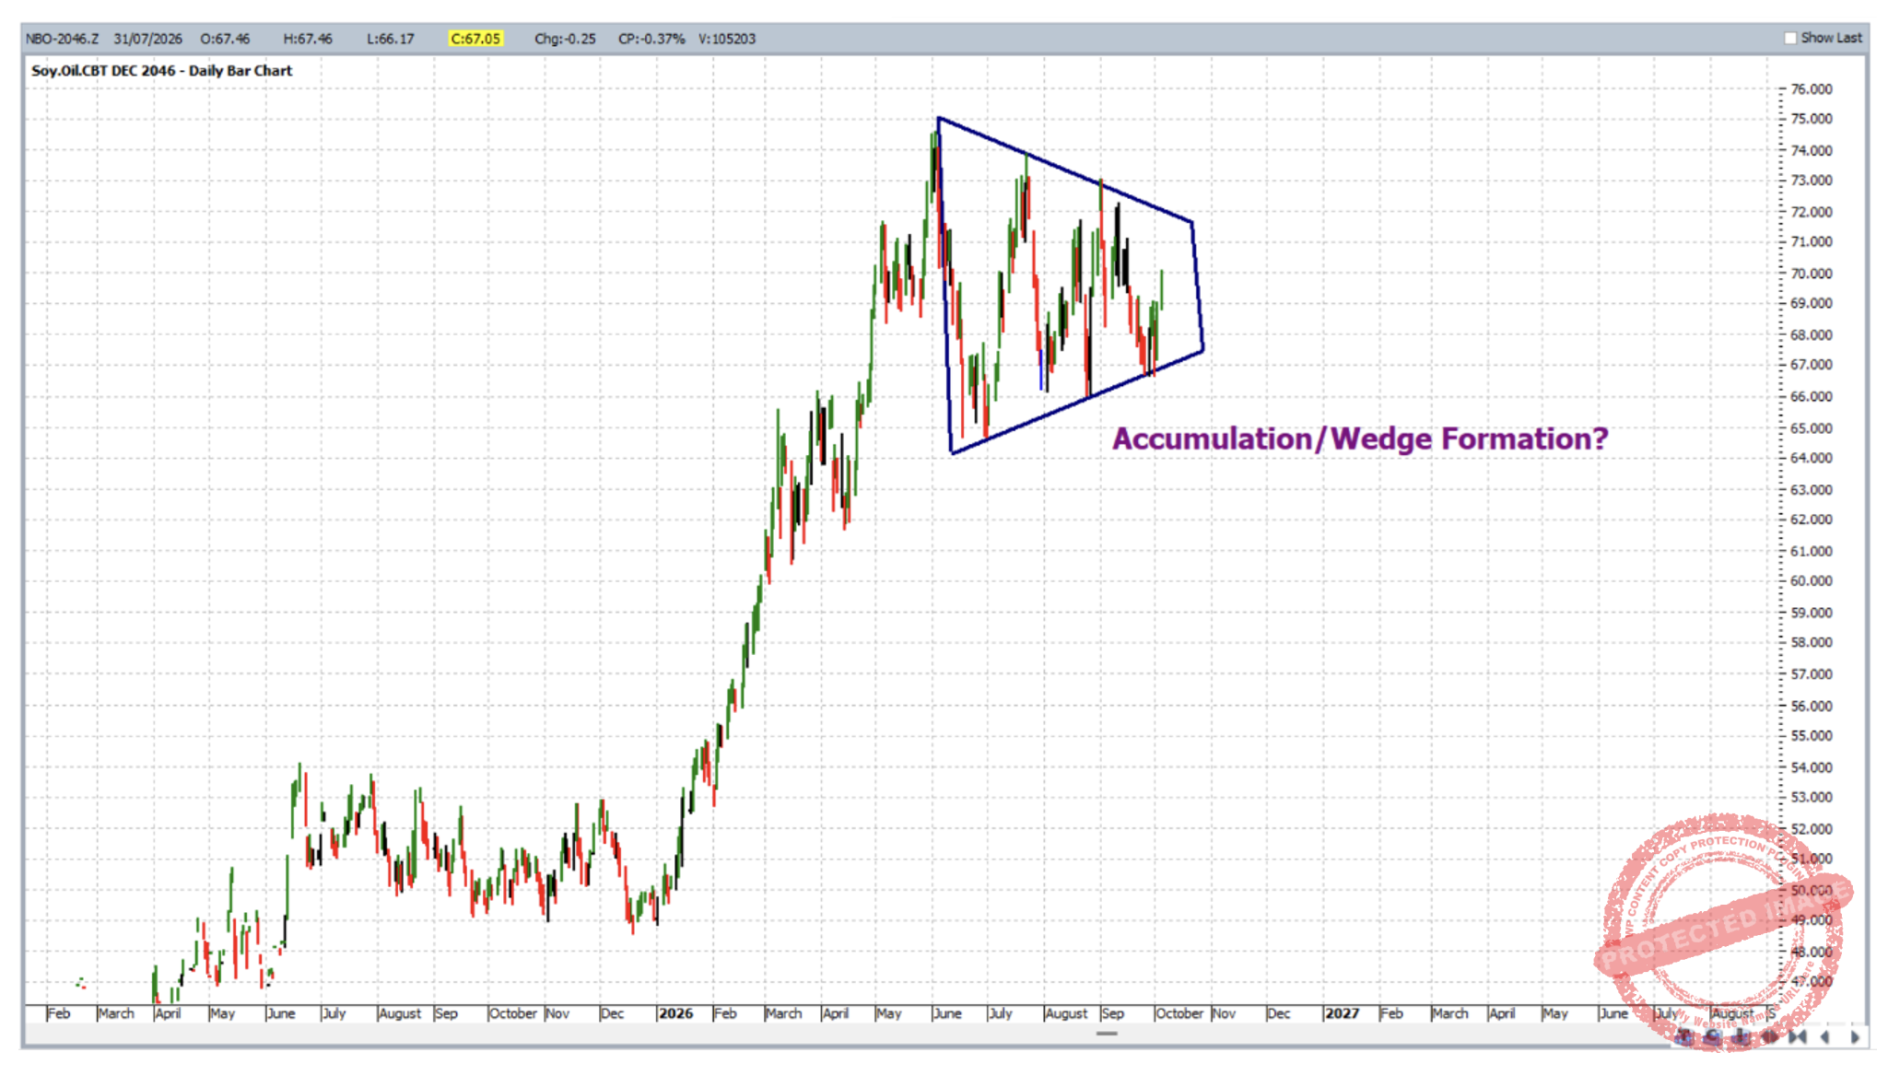
First up are Soybean Oil futures, a derivative from the Beans complex. Each year the December contract of this market trades at a higher volume than its other contracts for a long period of time. So why not take a look at the December 2026 individual contract chart, symbol NBO-2026.Z in ProfitSource. This chart currently draws us into a few simple but strong analysis pointers and they are all shown together on the one chart below.
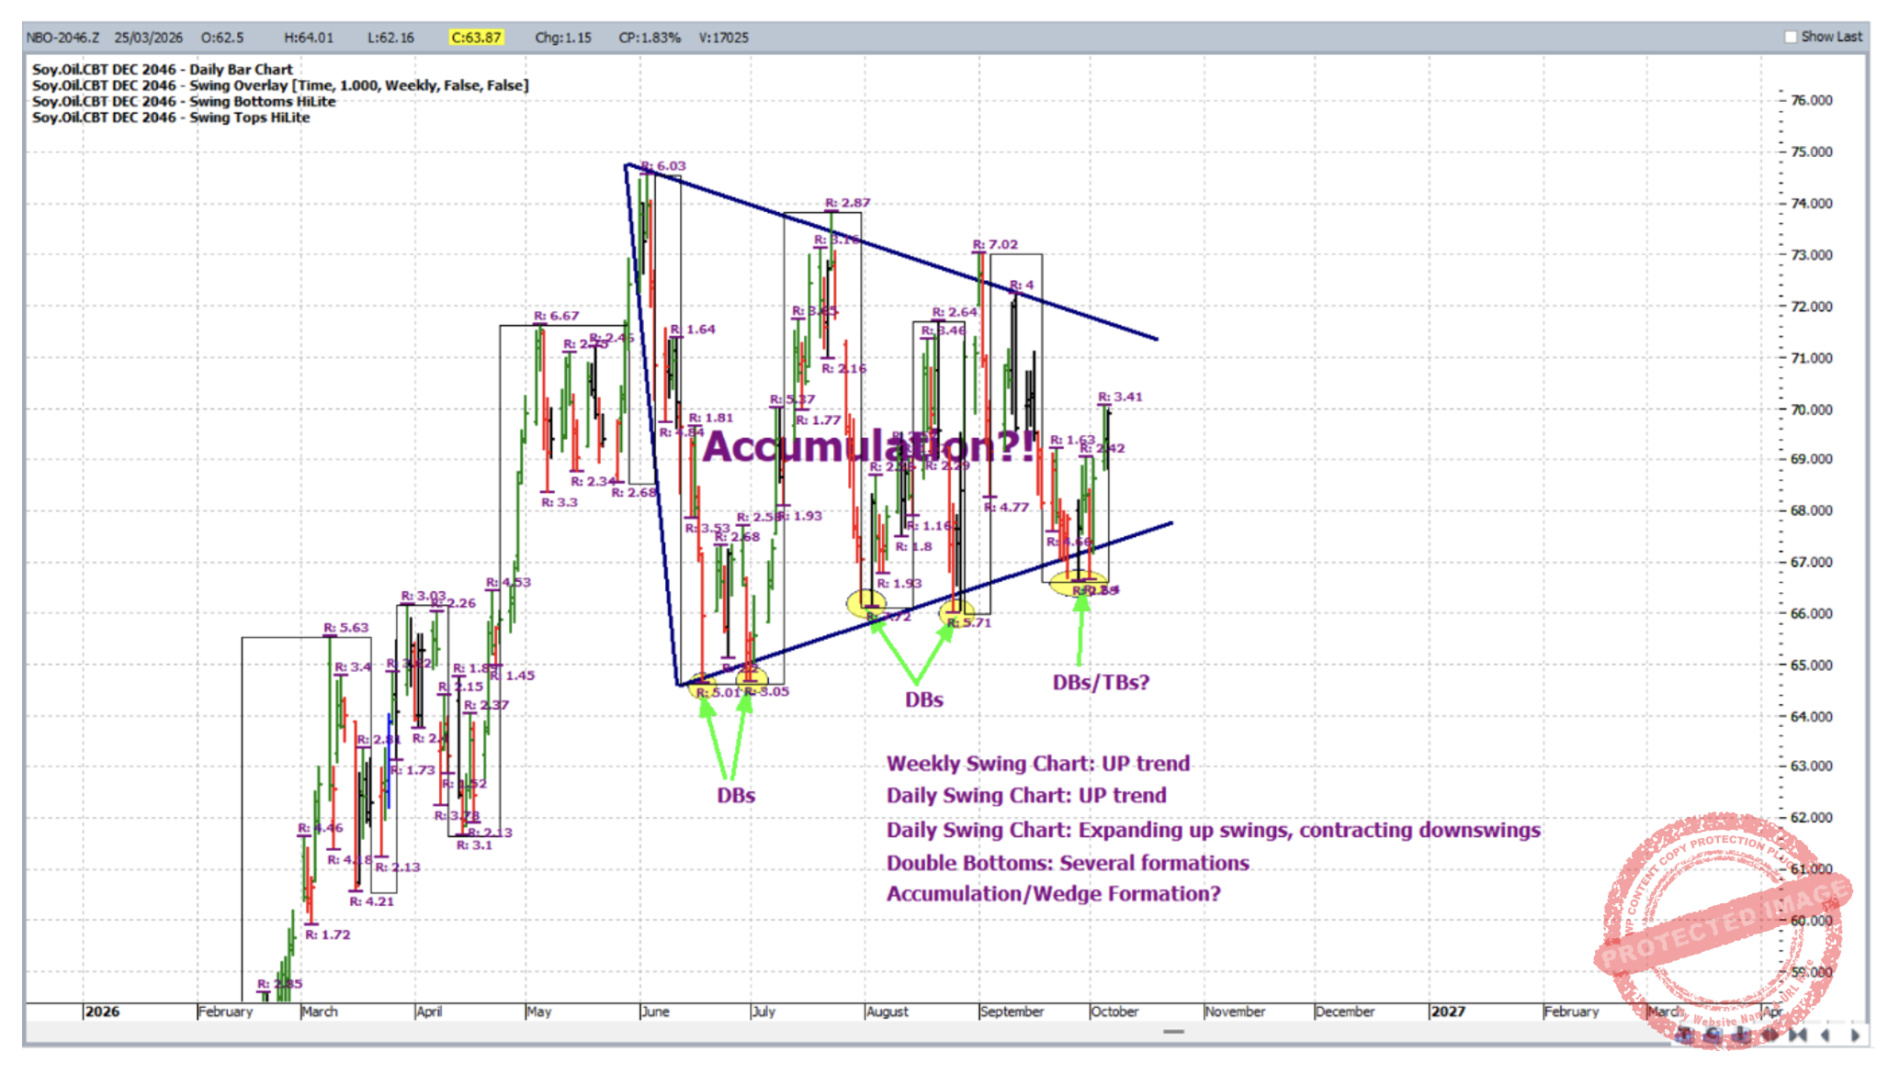
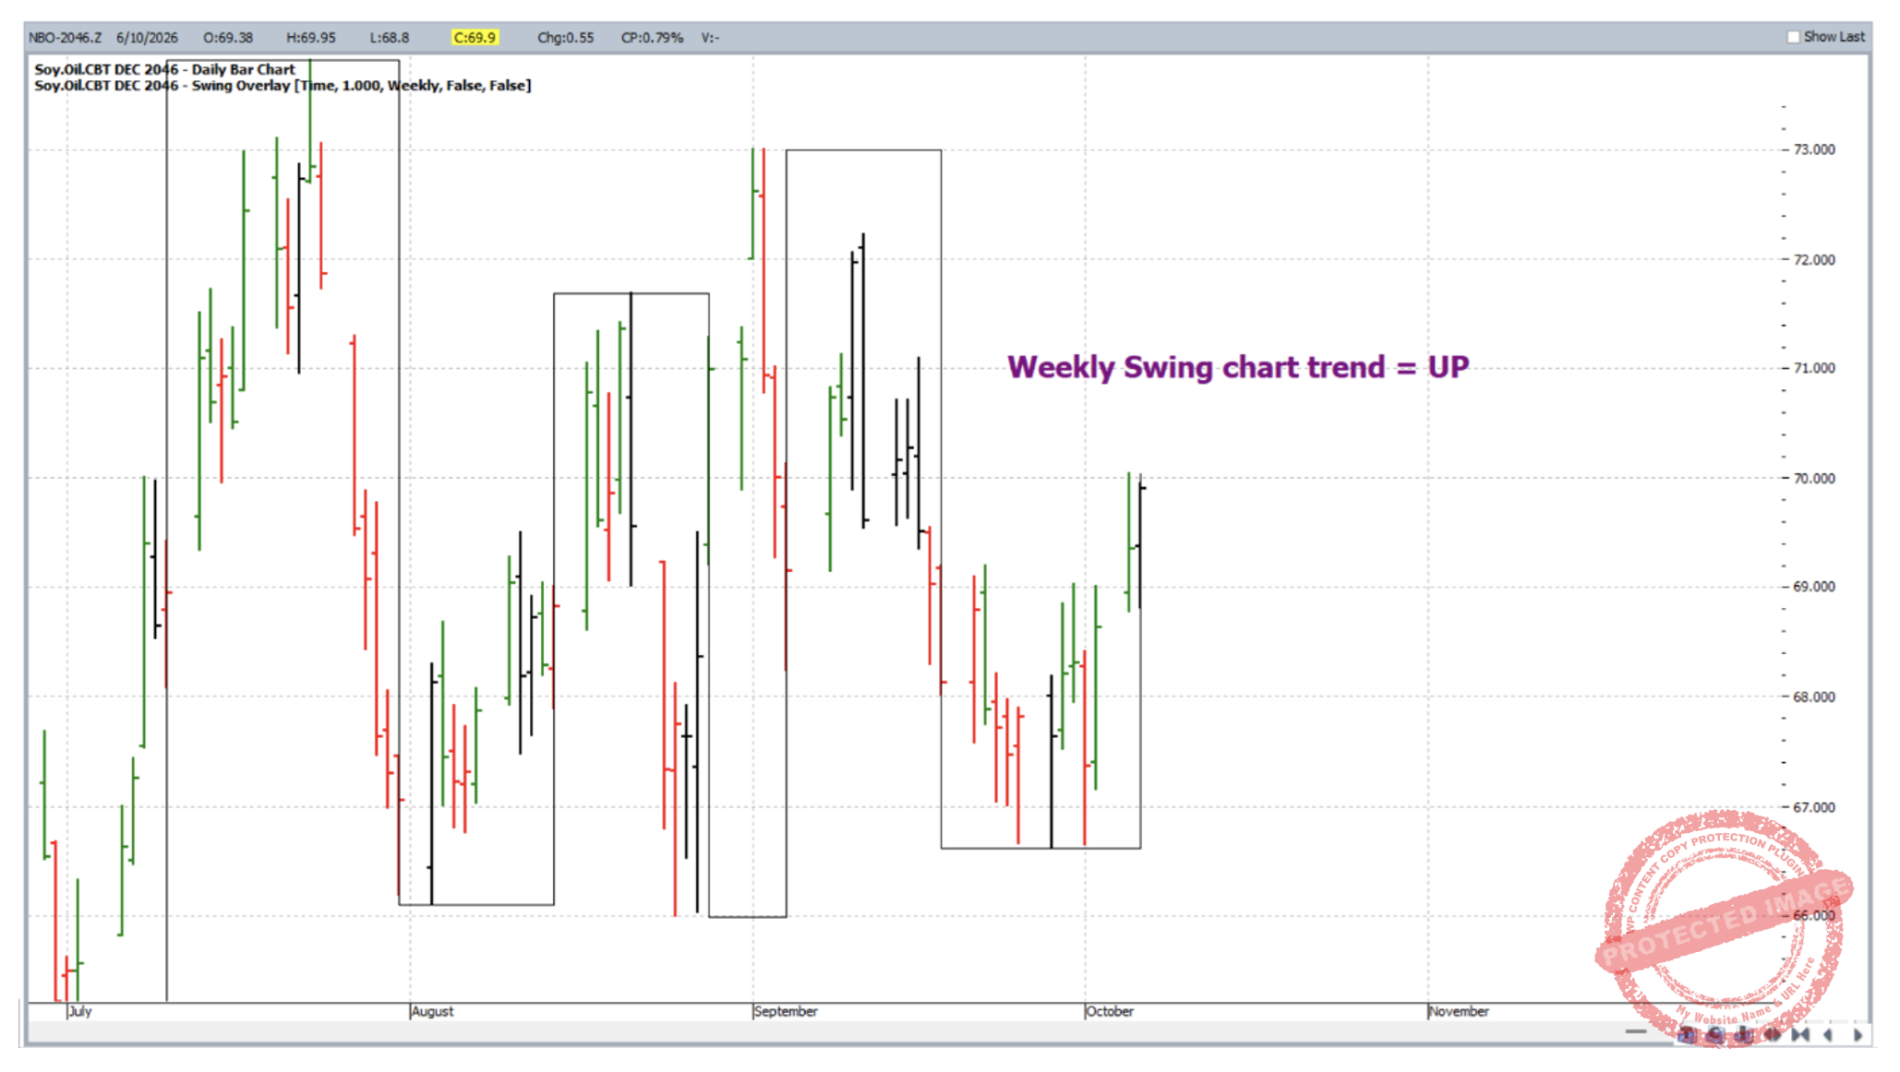
There is a fair amount of visual noise in the chart above. Or you might say it’s hard to read, especially if you were not the one who constructed a busy chart like this yourself! So let’s take a look at one analysis pointer at a time. First of all, with the aid of the Weekly Swing Overlay it can be demonstrated that the current major (weekly) swing chart trend is UP. This is in favour of the bulls.
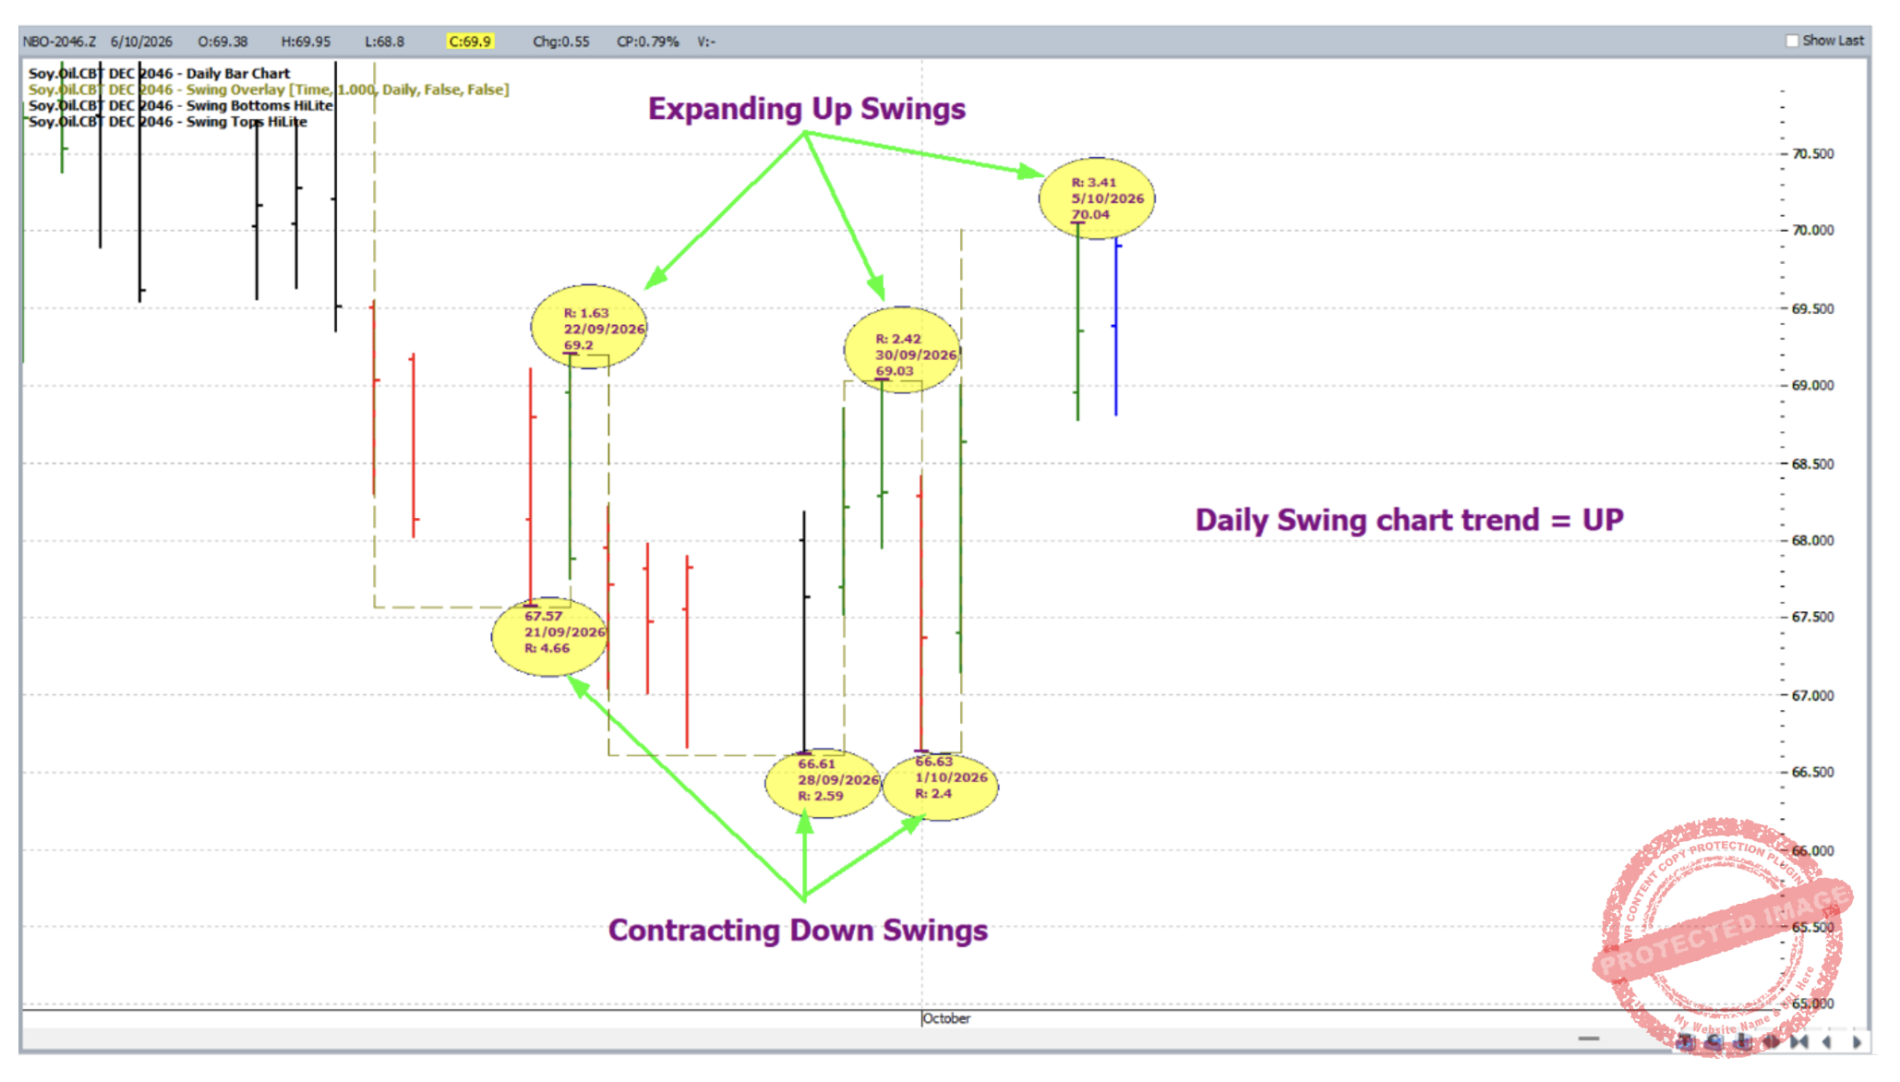
The chart below shows that the minor trend (daily swing chart) is also UP, with expanding upswings and contracting downswings. This is done in ProfitSource with the aid of the daily swing overlay and the Swing Bottoms/Swing Tops Hi-lites. Again, bullish.
Incidentally, of late there have been several double bottom (and one triple bottom) formations.
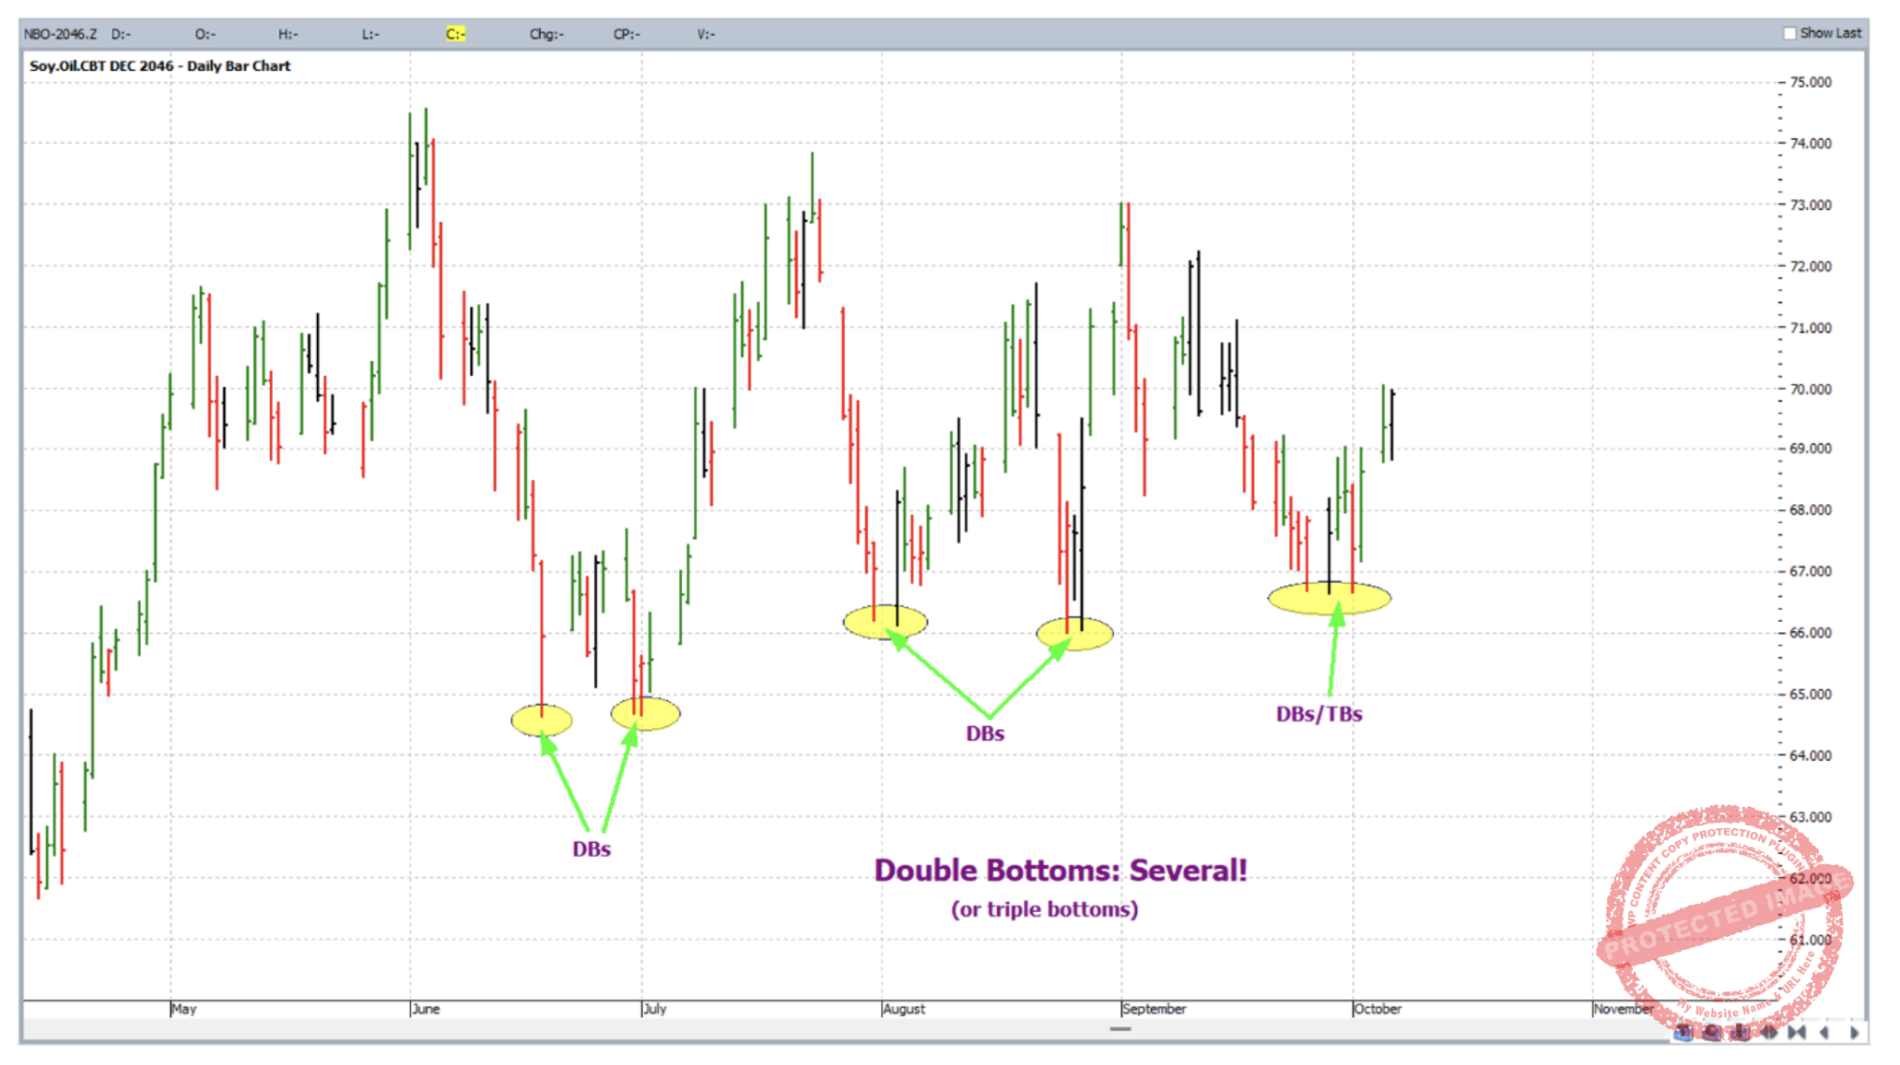
And last but not least, currently presenting itself in a rather large “Wedge Formation” (from general technical analysis). This can be typical of a commodity before break out moves. For instance have a look at the bottom left hand corner of the chart and observe what was happening in the last half of 2025 before the breakout of early 2026.
Now to the Sugar futures market, a typical representative of the “Soft Commodities” sector. This market has its March contract as very dominant so let’s take a look at its continuous “Gann style” chart, symbol SB-Gann.H.
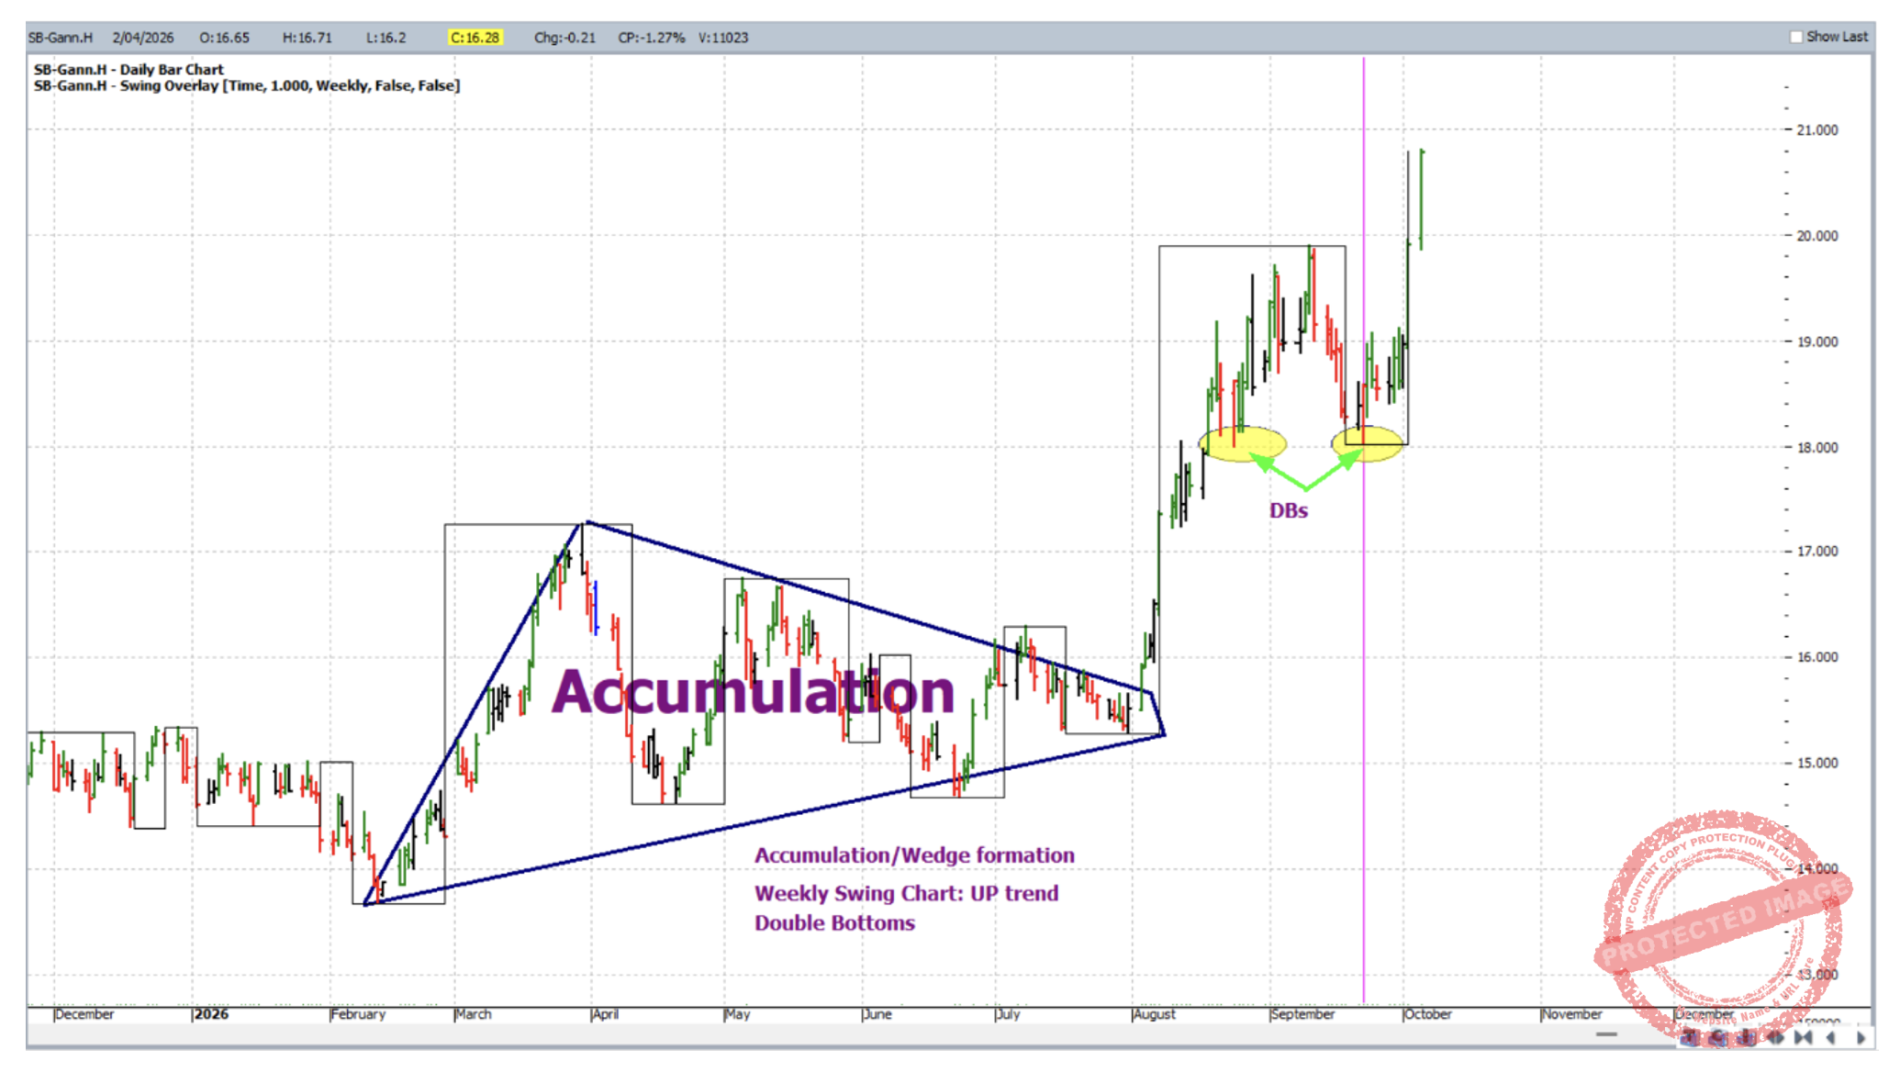
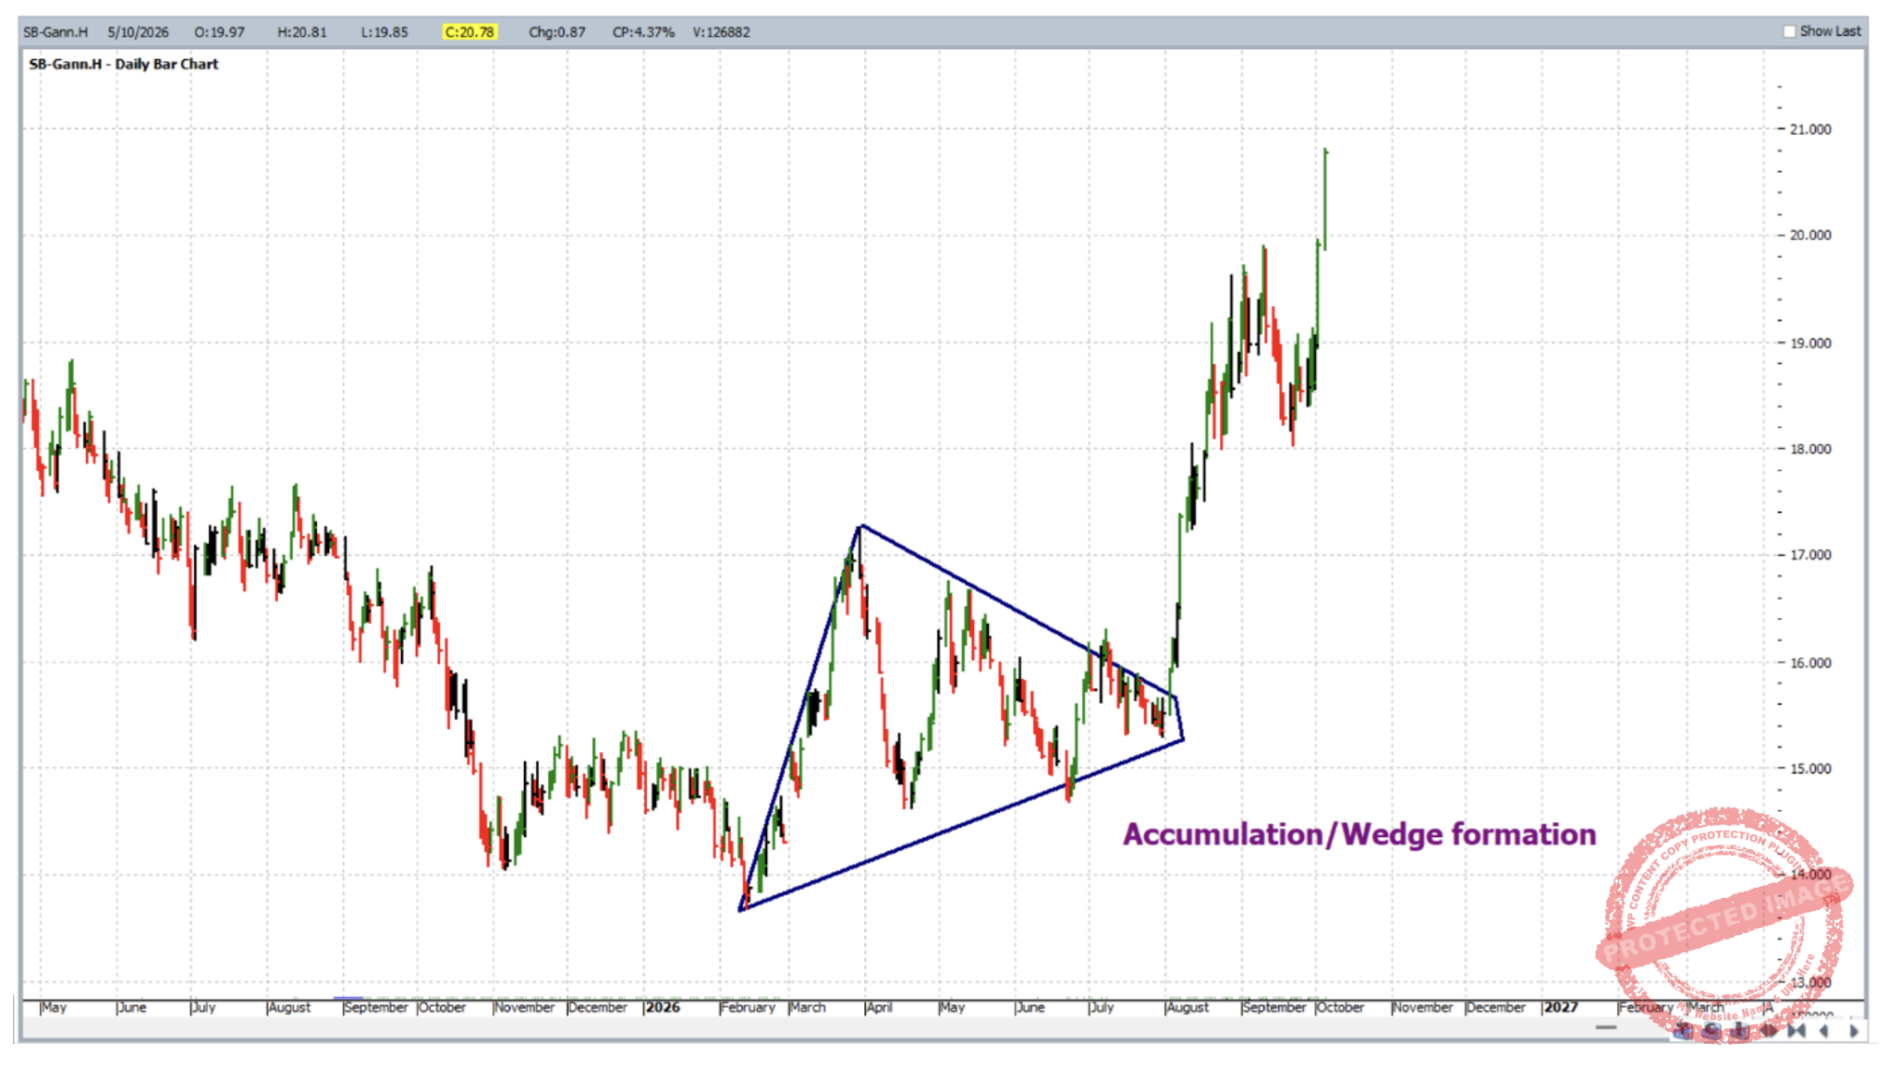
Not as busy as the initial bean oil chart, but let’s break it down anyway. First of all, prior to the break out in August was a typical wedge formation/accumulation period.
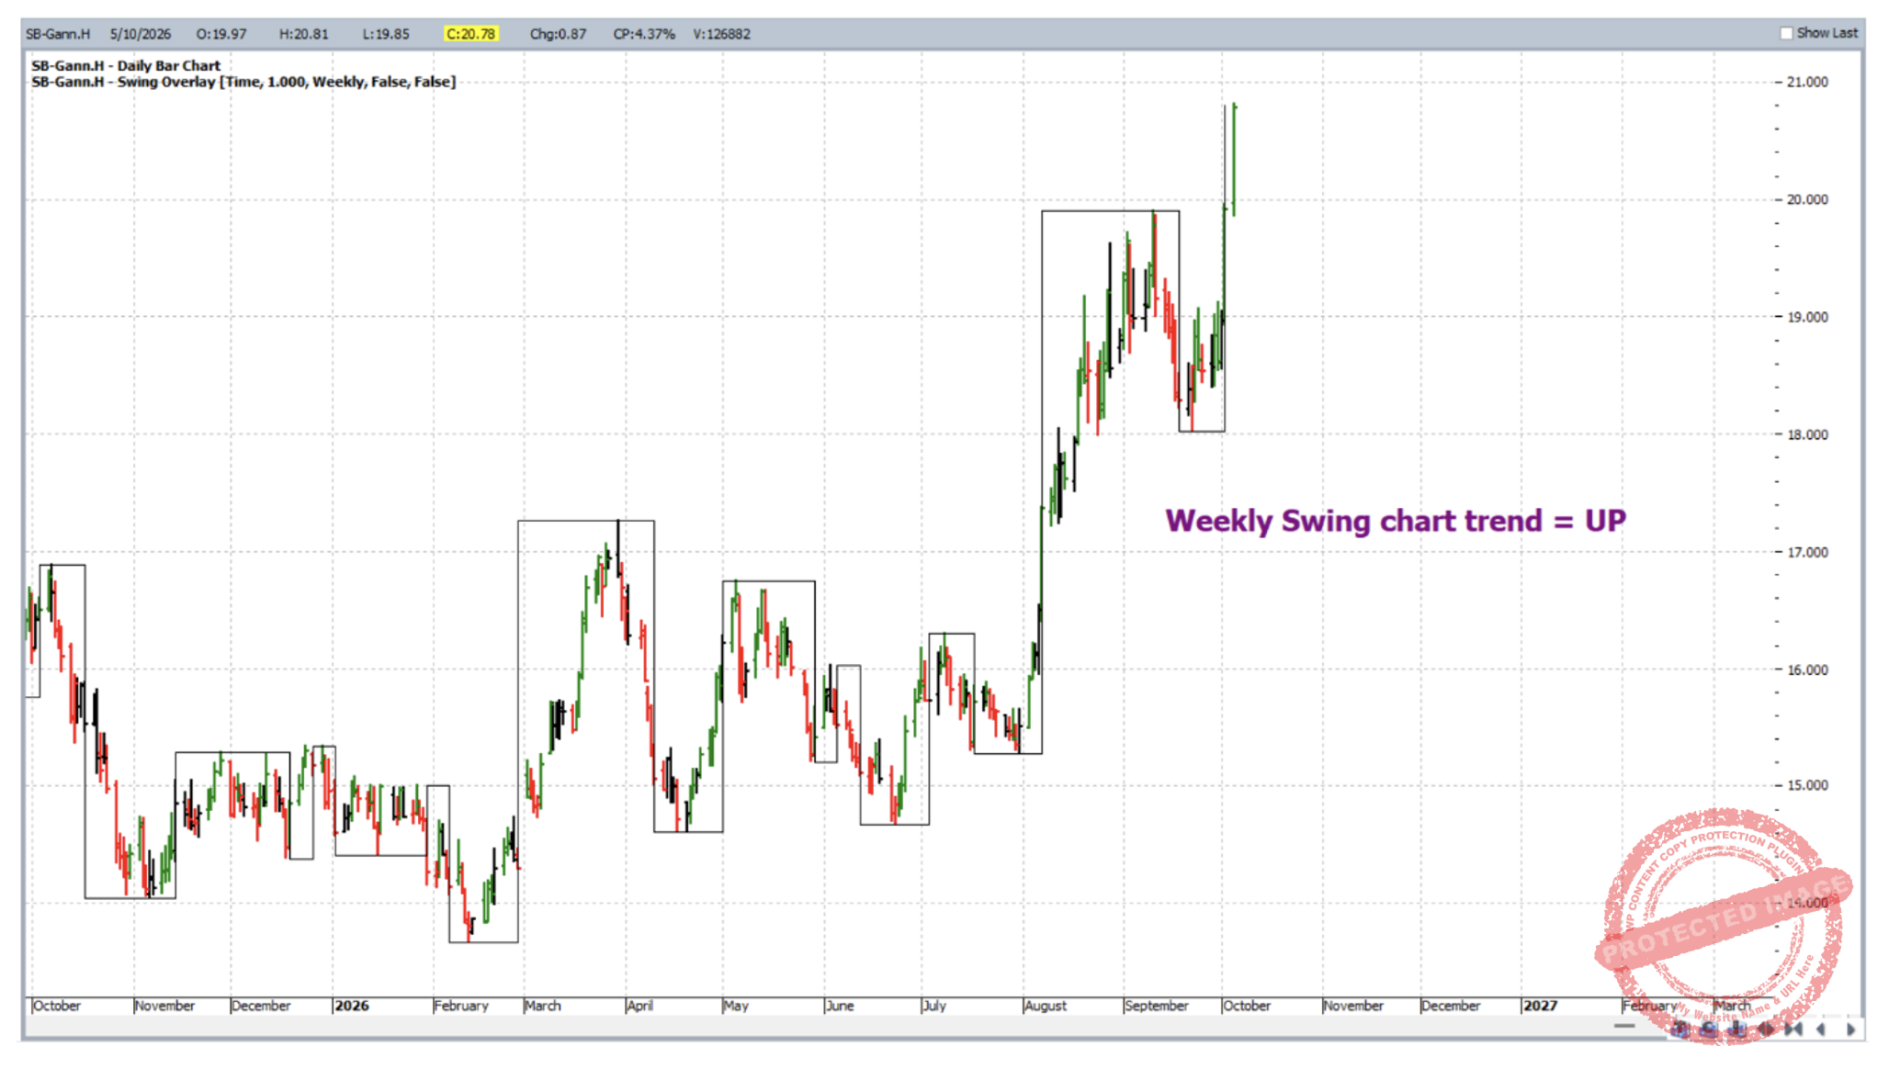
The current weekly swing chart trend is UP.
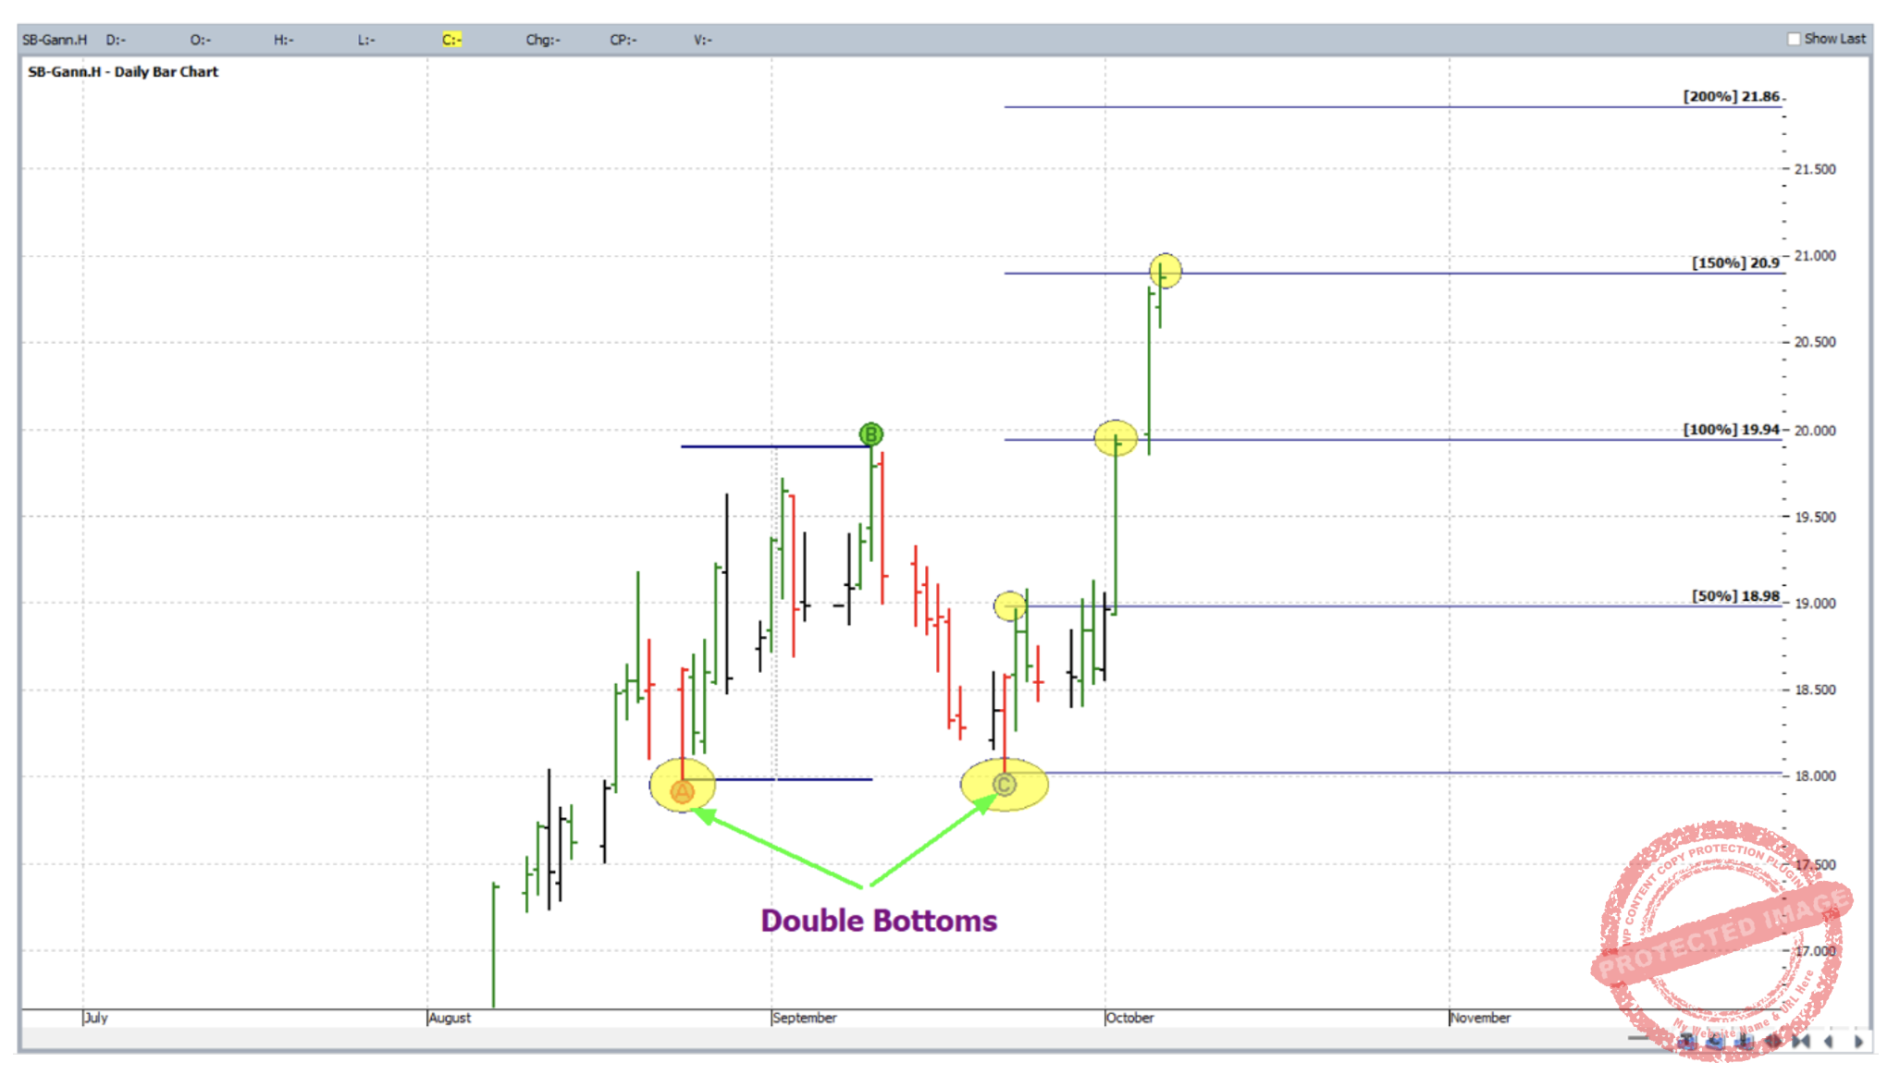
Zooming in, a double bottom formation is currently underway with its 50%, 100% and 150% milestones being acknowledged by the market with some precision.
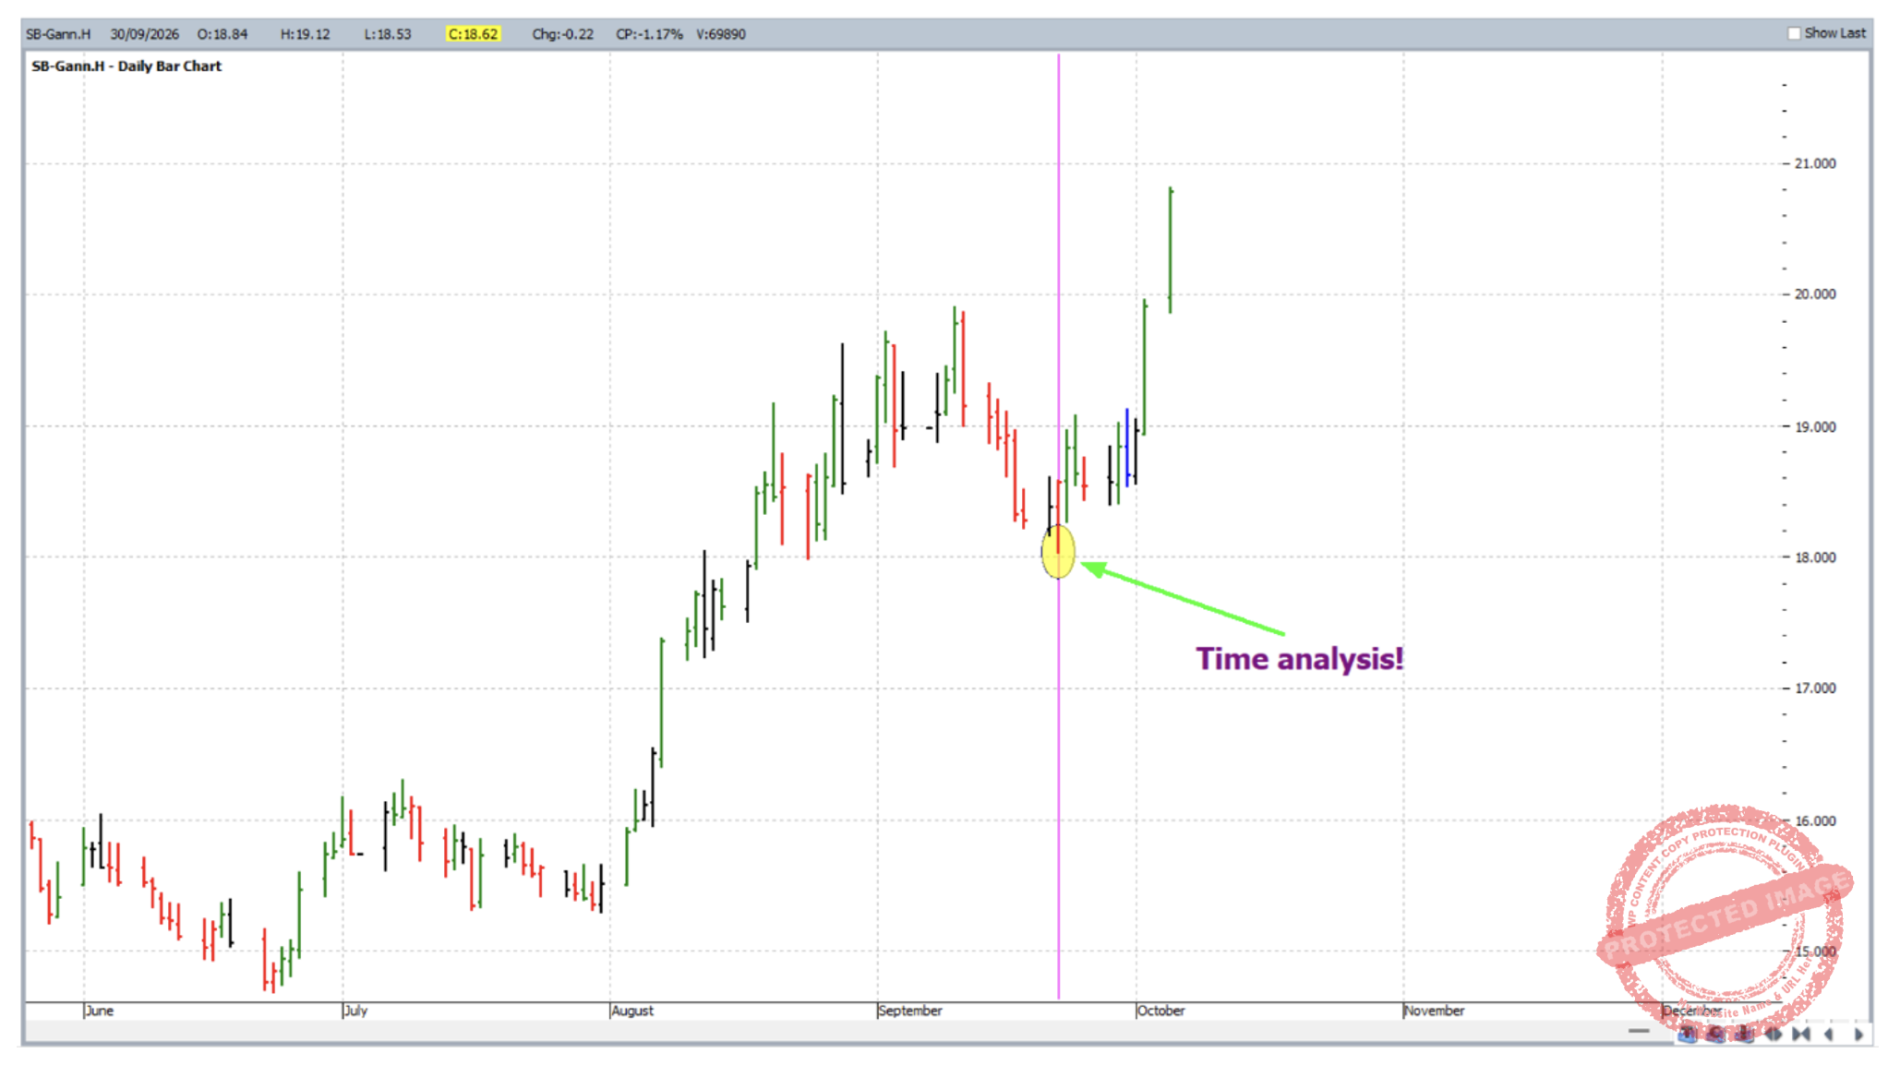
As for the vertical line on the initial Sugar chart, this pertains to time analysis as taught in the Ultimate Gann Course.
The question here with Sugar is whether or not the horse has yet fully bolted. In part this could be answered by some further price analysis. Try this for an exercise:
- Open up a monthly bar chart – symbol SB-SpotV (sugar’s continuous chart by volume)
- Set the ABC pressure points tool to only display the 100% milestone
- Aim for two ABC applications:
- A = 2016 high, B = 2020 low, C = 2023 high
- A = 2023 high, B = Aug 2024 low, C = Sept 2024 high
If Sugar’s February 2026 low is strong enough there could be more in it for the bulls.
As usual, keep an eye on the key milestones of the major ABC projections. Look out for price clusters which offer underlying support or overhead resistance.
Work hard, work smart.
Andrew Baraniak