
Sitting on Old Swing Highs
We are at an interesting point on the SPI200 as I write. On the smaller picture I see three weekly sections down just short of 200% of the First (weekly) Range Out. This suggests we could be near the end of this monthly swing down, as three sections can be a sign of completion.
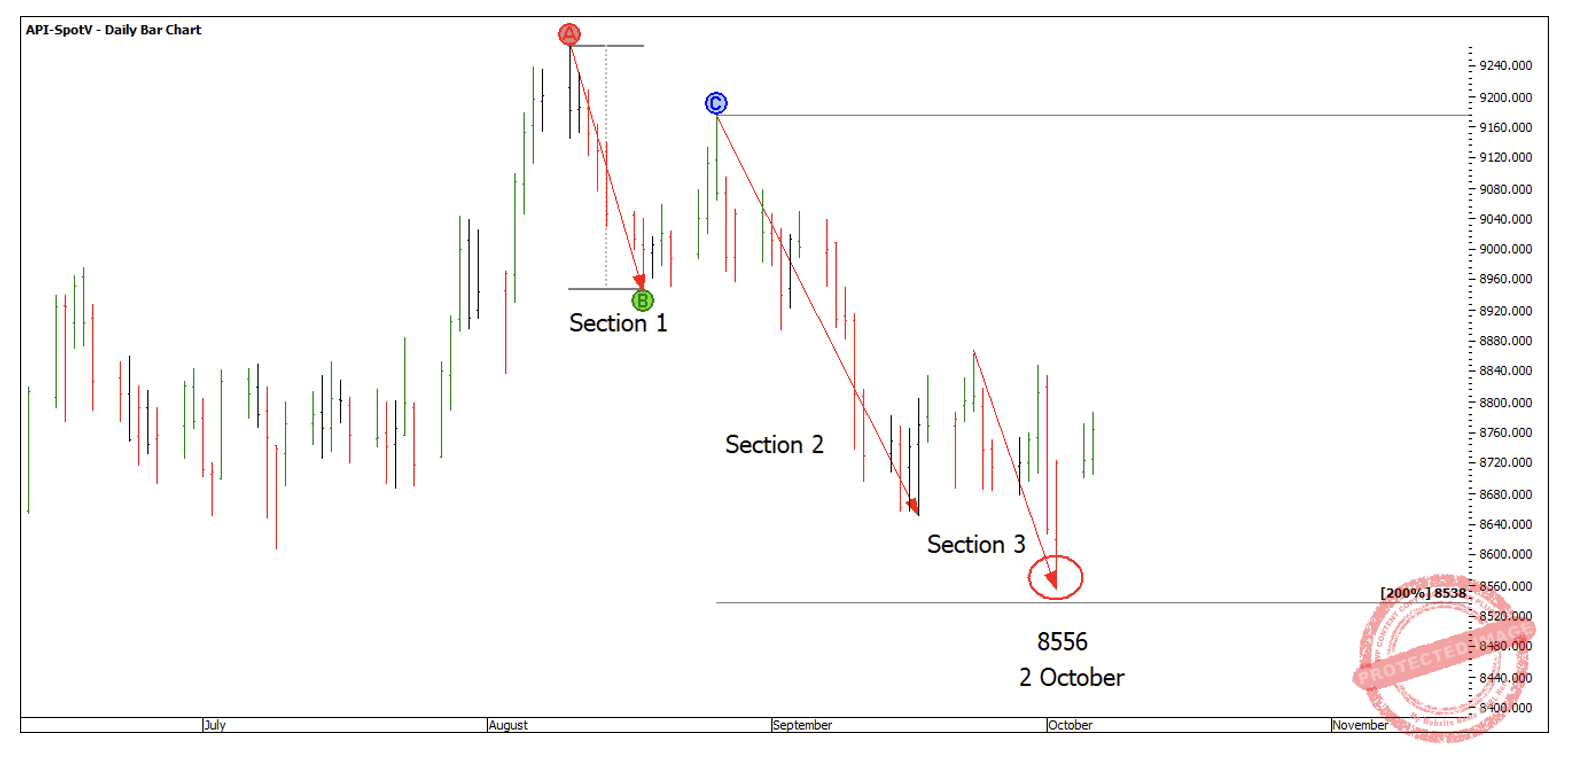
Chart 1
Using the quarterly and yearly swing chart, the current low of 8556 on 2 October is only 12 points through the 33.3% yearly Ranges Resistance Card retracement level. Also, I have the yearly swing high at 8581 on 14 February 2025 and the yearly high for 2024 at 8546.
Although this quarterly swing low of 8556 isn’t a yearly swing low, the bigger price support levels still apply.
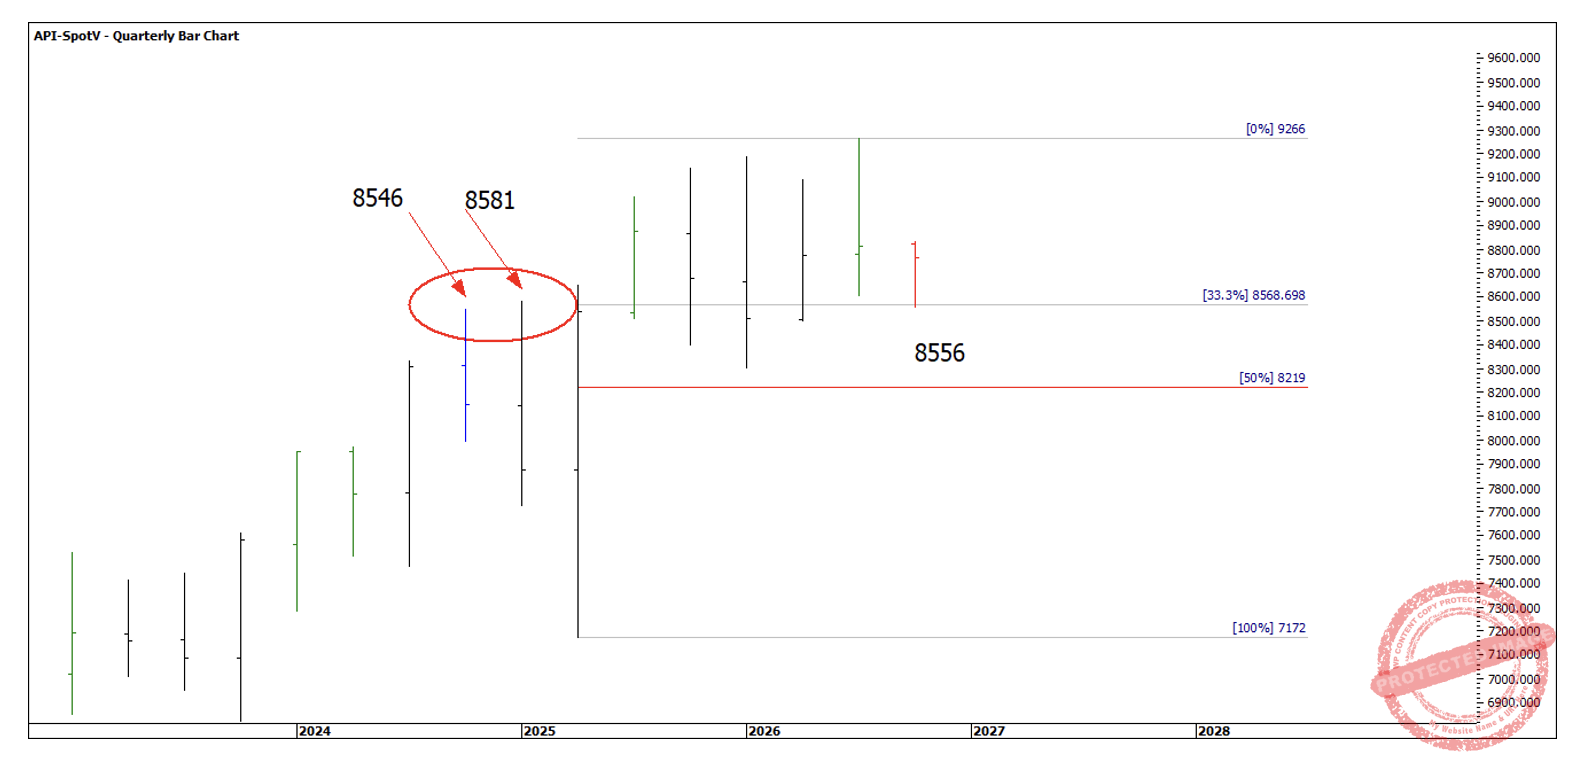
Chart 2
If you add in a yearly ABC range, the current low of 8556 sits smack on 50% of the previous yearly swing running down of 8561.5.
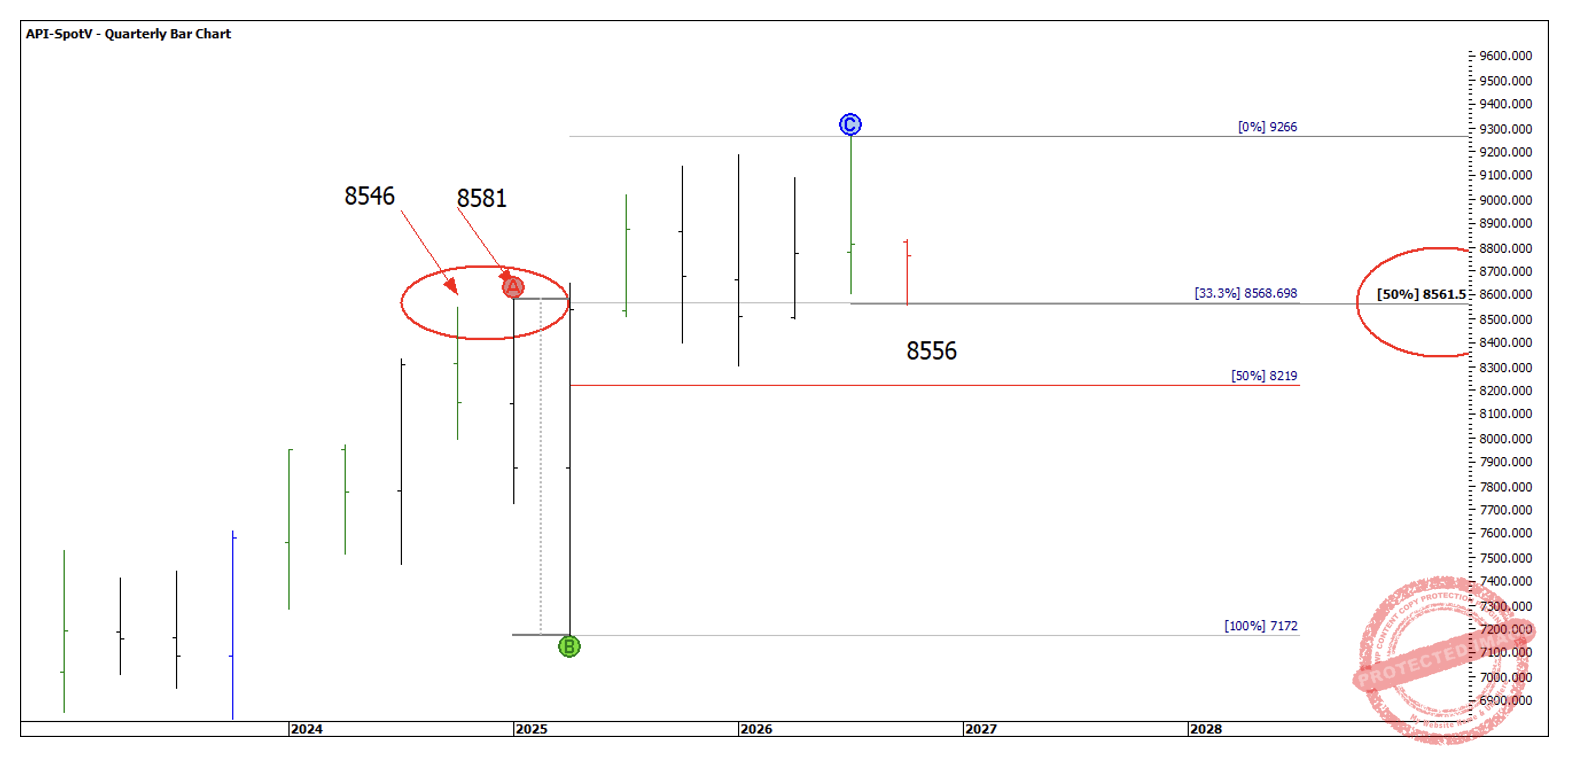
Chart 3
If you refer back to Chart 1, you will see that the market has pulled up short of the 200% First Range Out milestone of 8538, so we should be on alert for the market to test this level.
W.D. Gann says that often two sections will be of equal time or price. The weekly section 3 is currently 307 points down, which if it does get down to the 200% milestone makes it a bit closer to the First Range Out of 319 points.
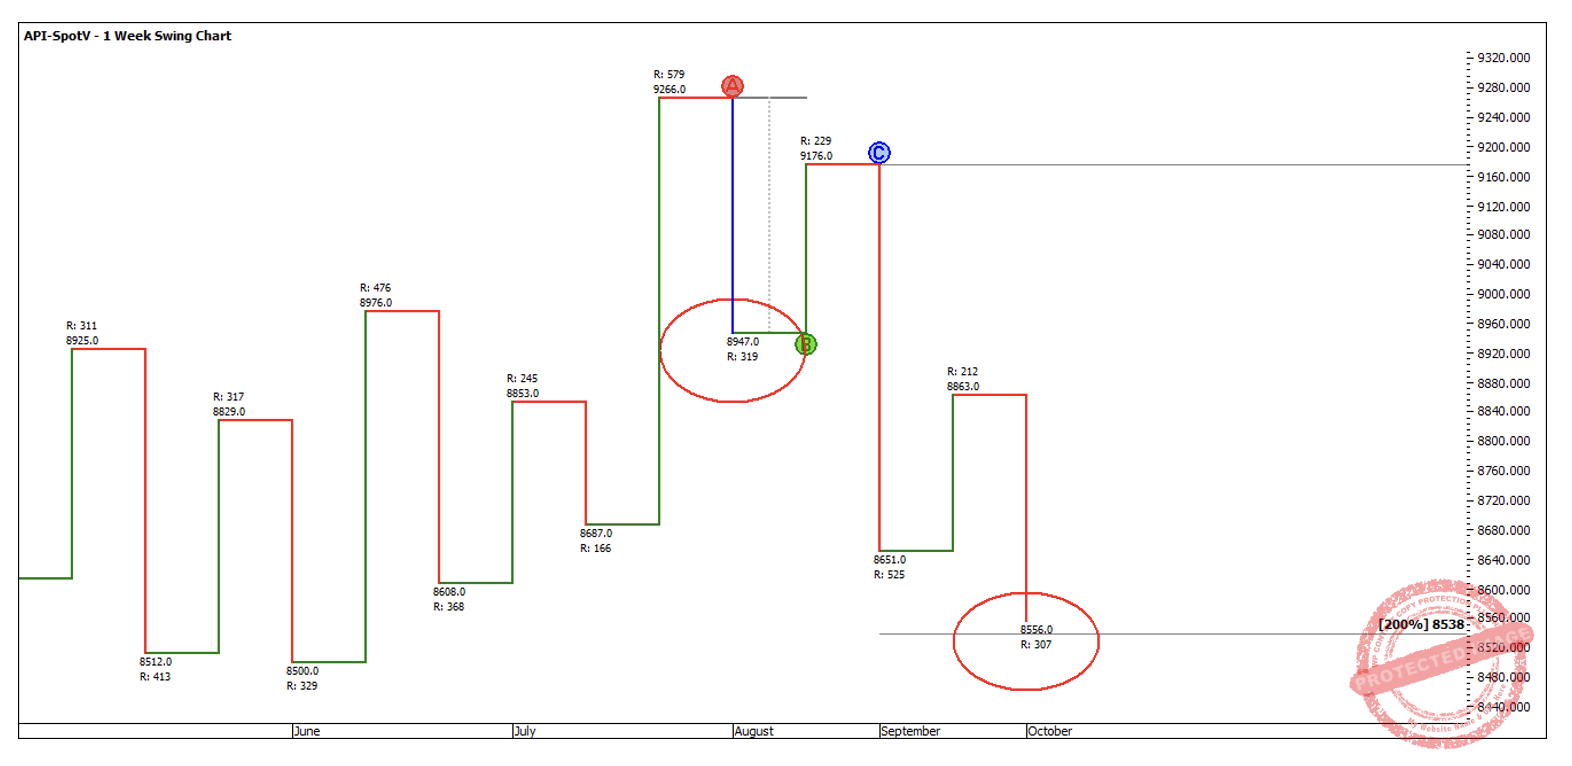
Chart 4
The quarterly swing retracement shows a 75% retracement level at 8545 which clusters very close with 8538.
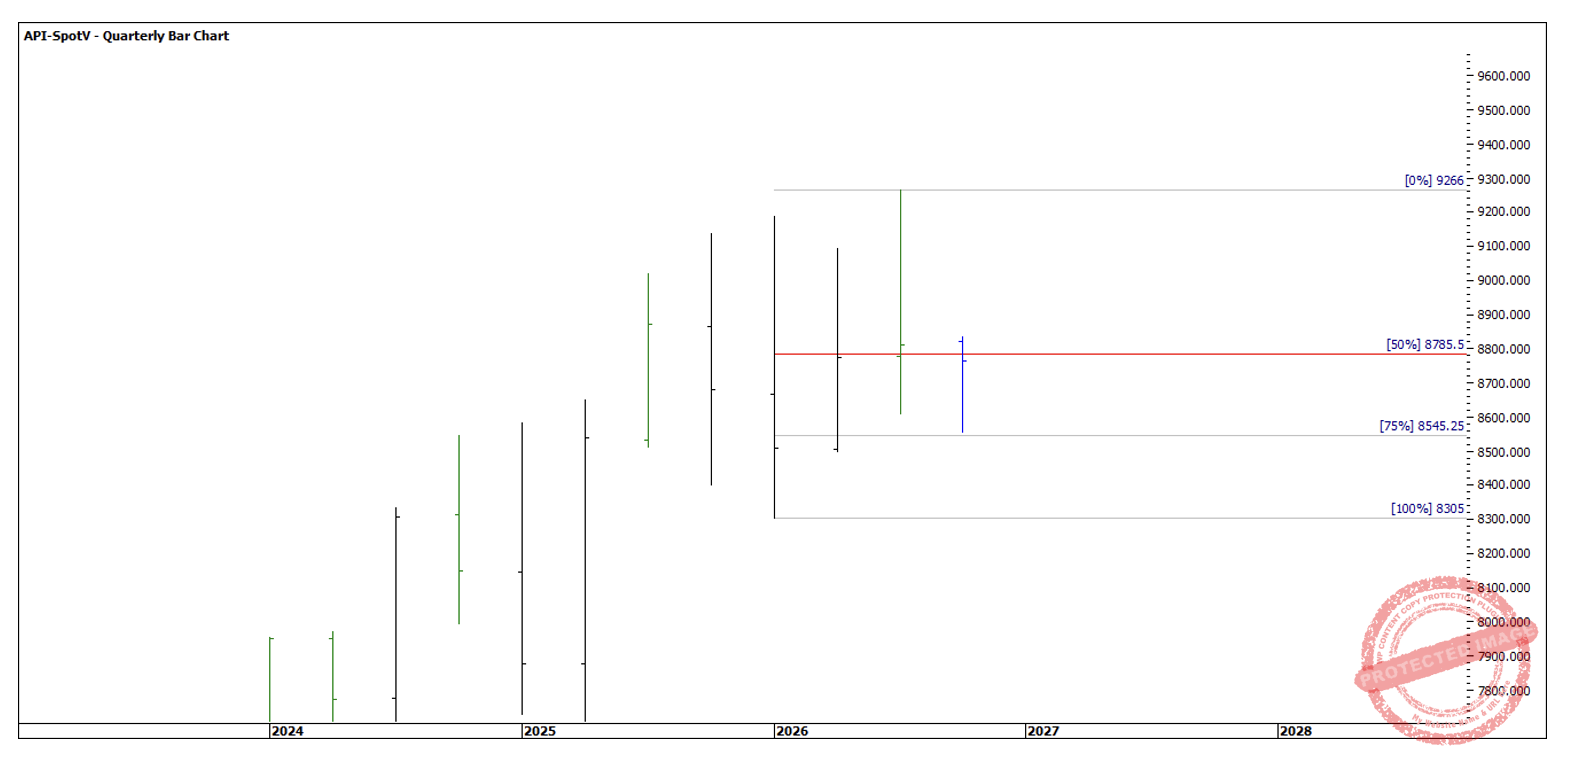
Chart 5
I felt the 2 October low came in a little early in terms of time, I was actually watching around Friday 9 October as my next pressure date, which instead of being a monthly swing low, could end up being a higher bottom.
However, I’ll still watch this date and this 8538 level in case the setup comes together. If there is another run down into 8538, then that would then give three daily sections within the current third weekly section.
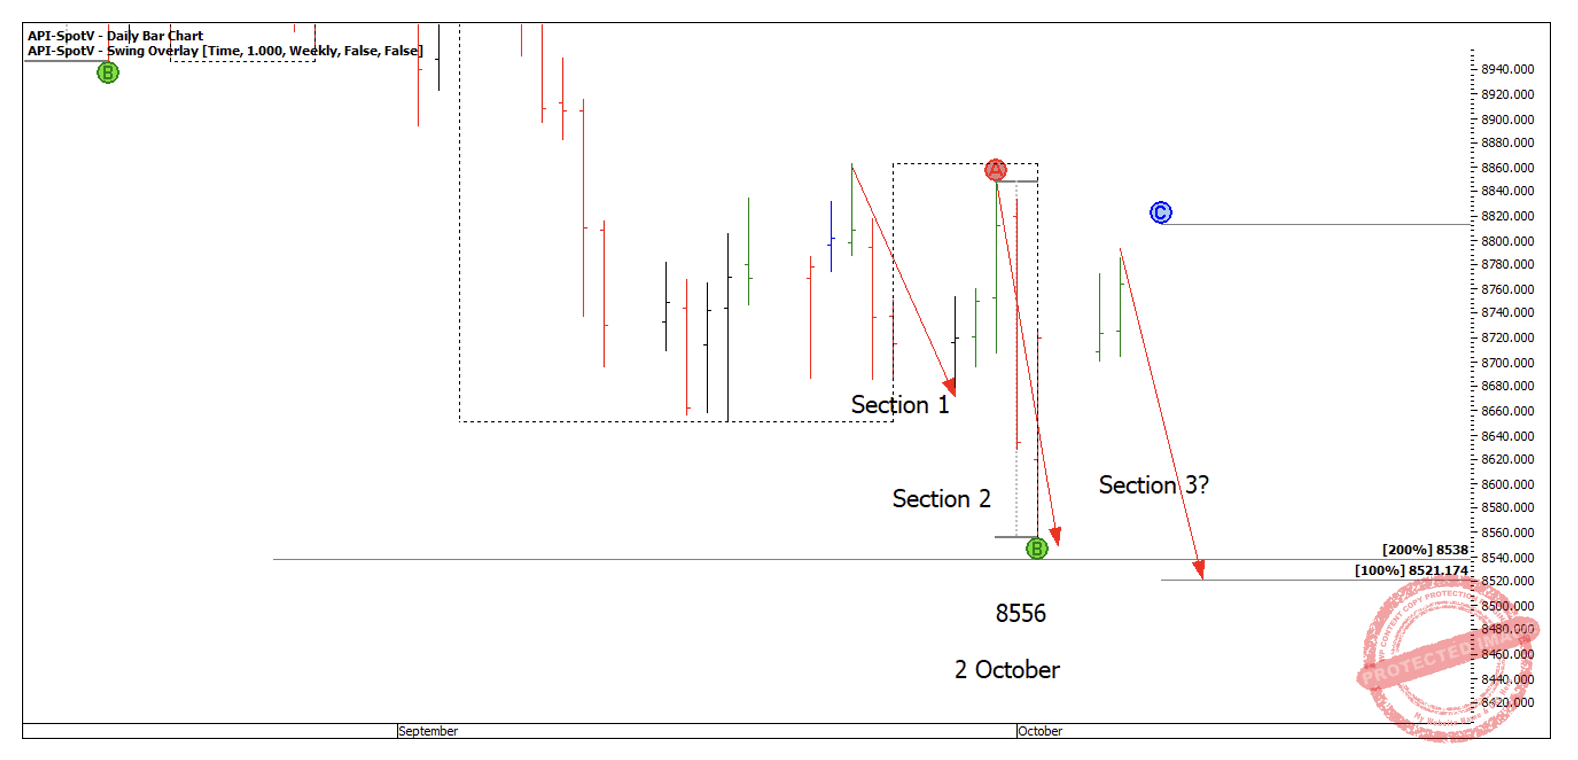
Chart 6
Again, this is just one possibility, and I will also be watching for a higher bottom to form, as we did see the last daily swing range hit the 150% milestone of the daily First Range Out. David says if the market hits 150% then watch for this to become a possible Point A.
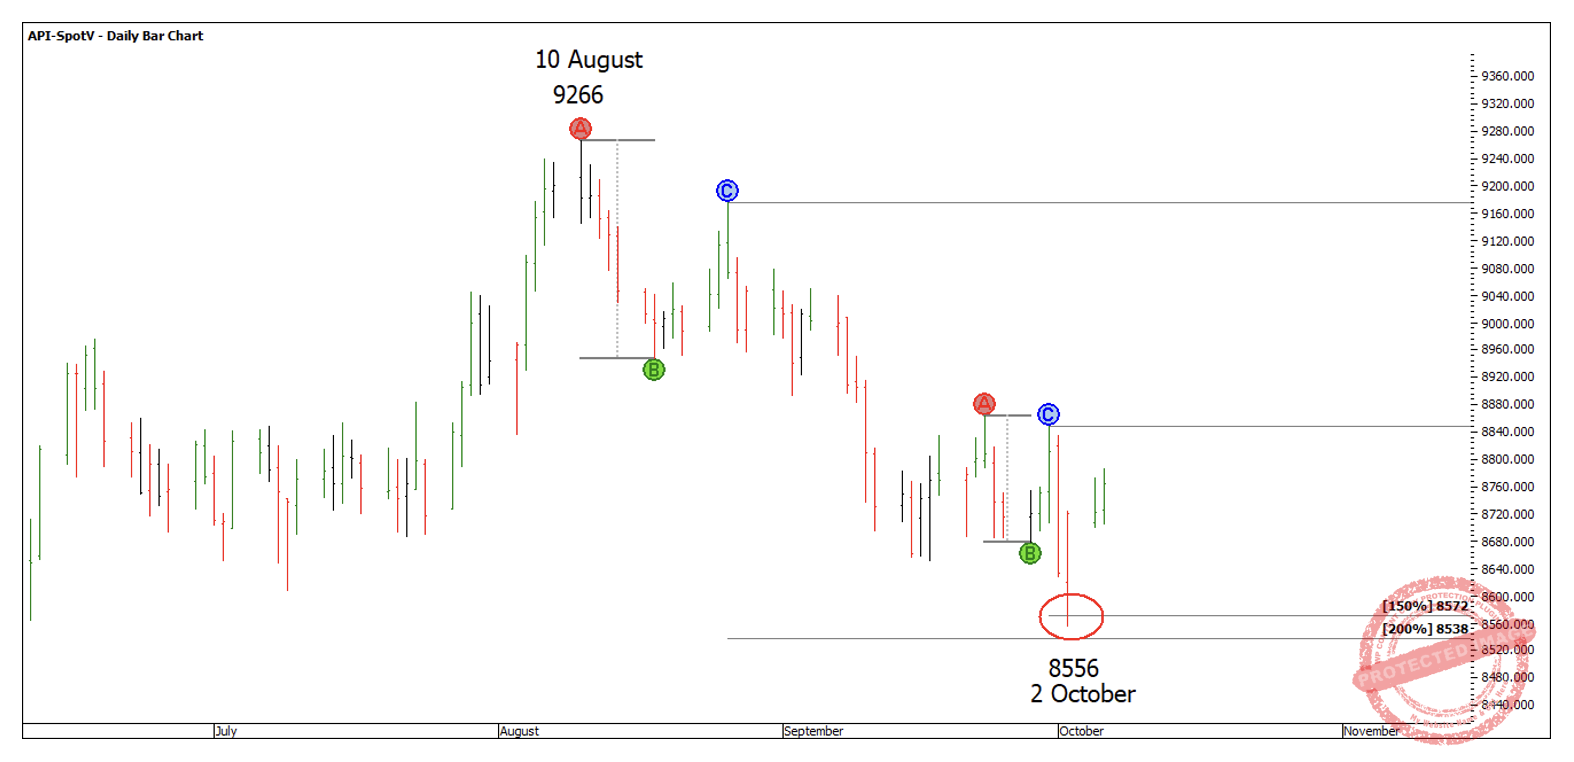
Chart 7
With the information I have at present on 7 October, the current intra-day high is 8813.
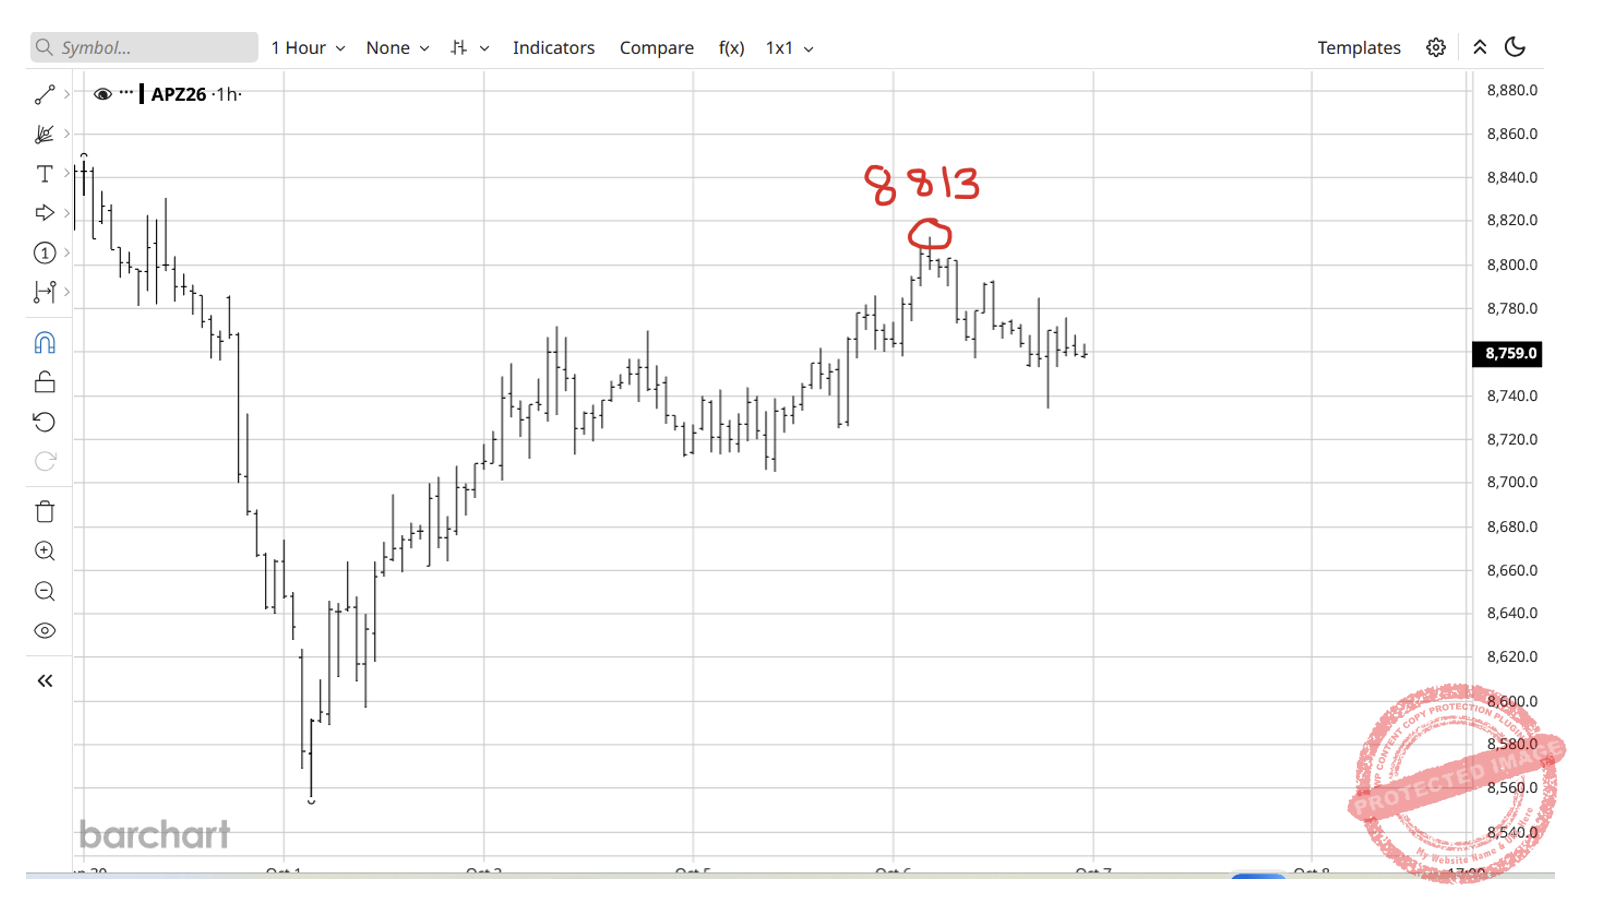
Chart 8
A couple of places I think are worth keeping an eye out for support in the event of a higher swing bottom:
- 50% Retracement 8685
- 50% of the previous swing range down 8667
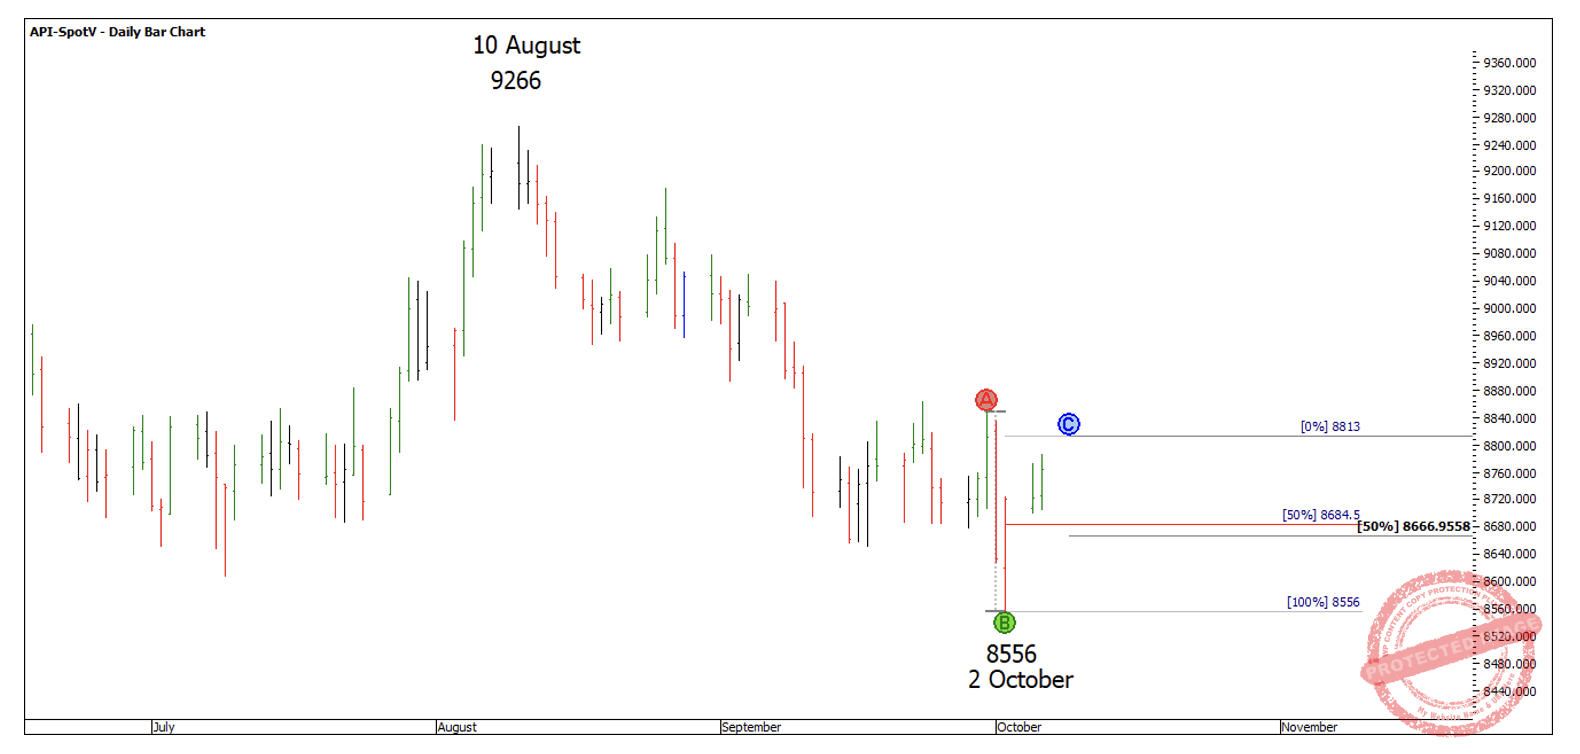
Chart 9
I see quite a few prices coming out around the 8660 – 8670 level, so that will be something I will watch for.
Interestingly, the S&P500 and the Nasdaq are back trading into new All Time Highs, whereas the Dow Jones has been trending down but has now found support on 150% of the weekly First Range Out. As there are only two weekly sections down on the Dow, there is always the possibility for a third.
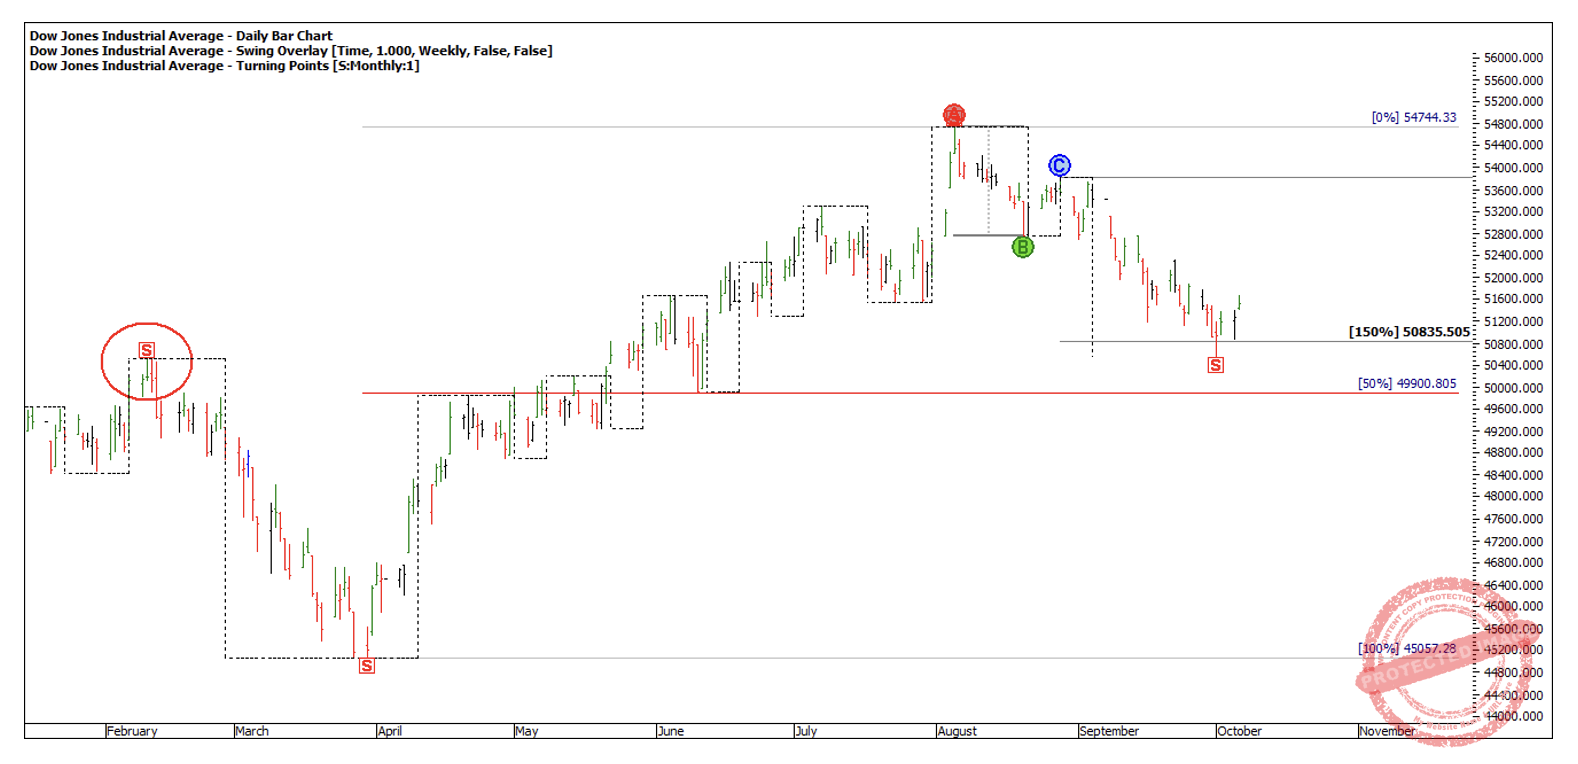
Chart 10
Regardless of what the US indices are doing, I have my two main scenarios that I’m watching on the SPI200, and if none of them come to fruition then I wait for the next setup.
Happy Trading,
Gus