
Chart Your Market
Last month I wrote about the possibility of 23 September being the weekly swing high to start a third section down. This came to fruition and the market then ran down and has currently lowed on 2 October at 8556, just short of the 200% milestone of the weekly First Range Out.
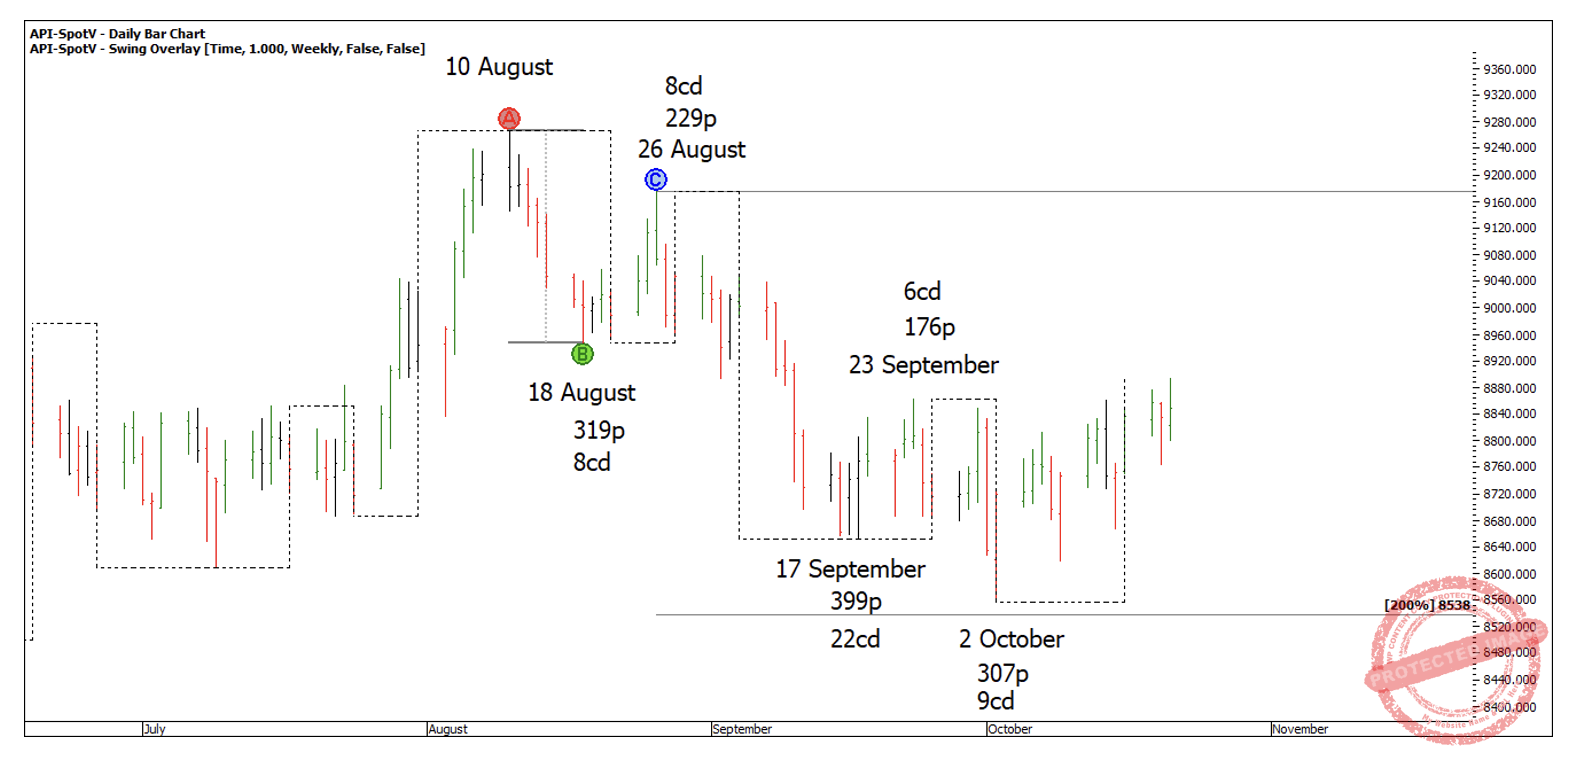
Chart 1
In the October Safety in the Market newsletter, I detailed two scenarios I was watching. Either a run down into 200%, or the market to make a higher swing bottom with my pressure date being 9 October. We also saw this come to fruition.
Since then, the current shape has me interested to see how many bottoms could we expect to see before a breakout in either direction? As of Thursday 22 October, the market has made an intraday low of 8781 at midday, confirming the potential for a fourth swing low.
Of course, the market has to go up to confirm a higher bottom, but this hasn’t occurred yet so at this stage it’s only a possibility.
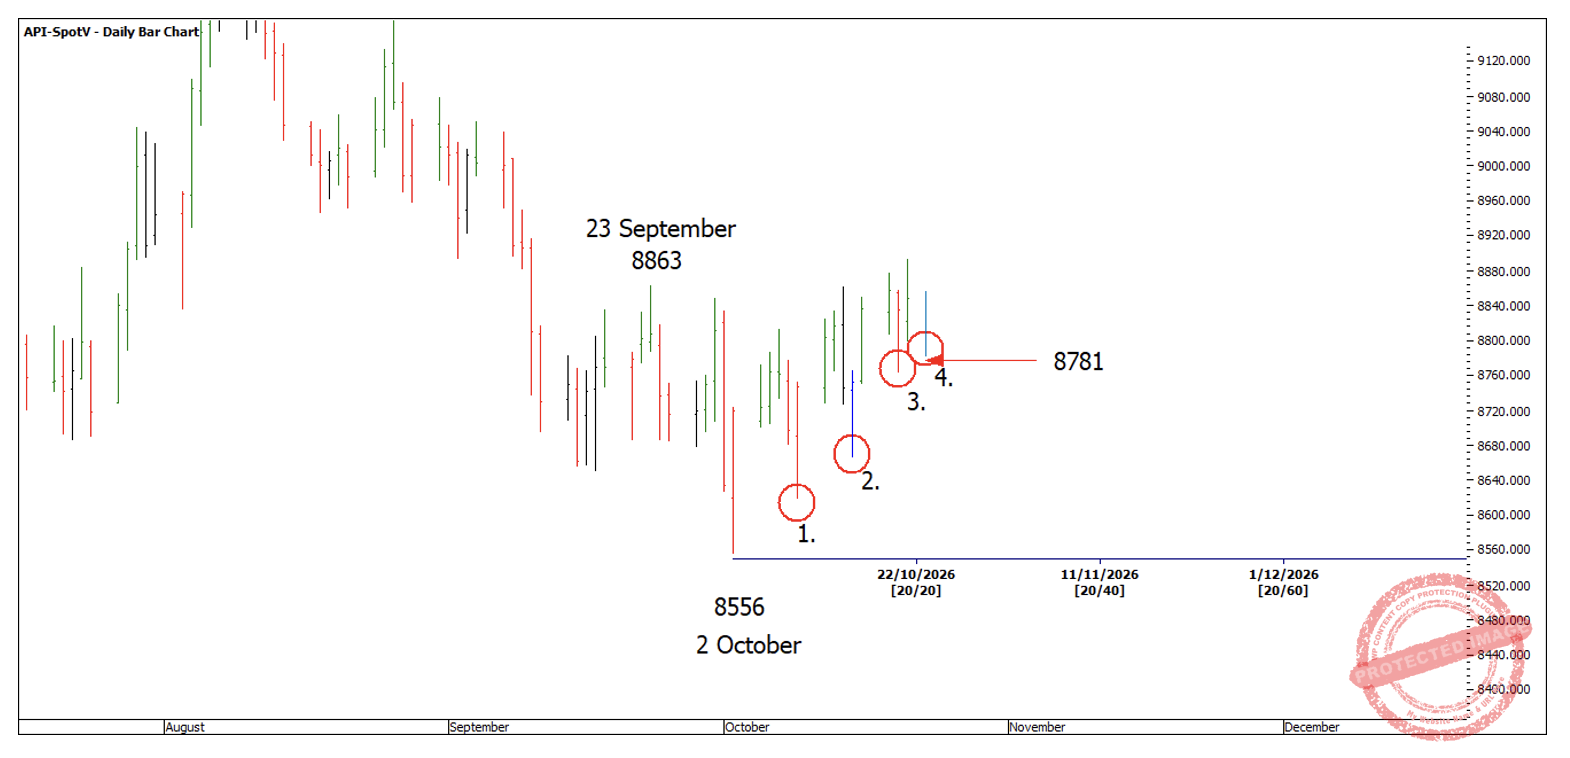
Chart 2
My view is the market is going up and it’s a slow burn to get going with multiple higher bottoms still within the sideways range starting back in September. This to me suggests that the market is winding up for a spring to the upside.
Although I couldn’t blame anyone for also seeing four daily swings into a double top!
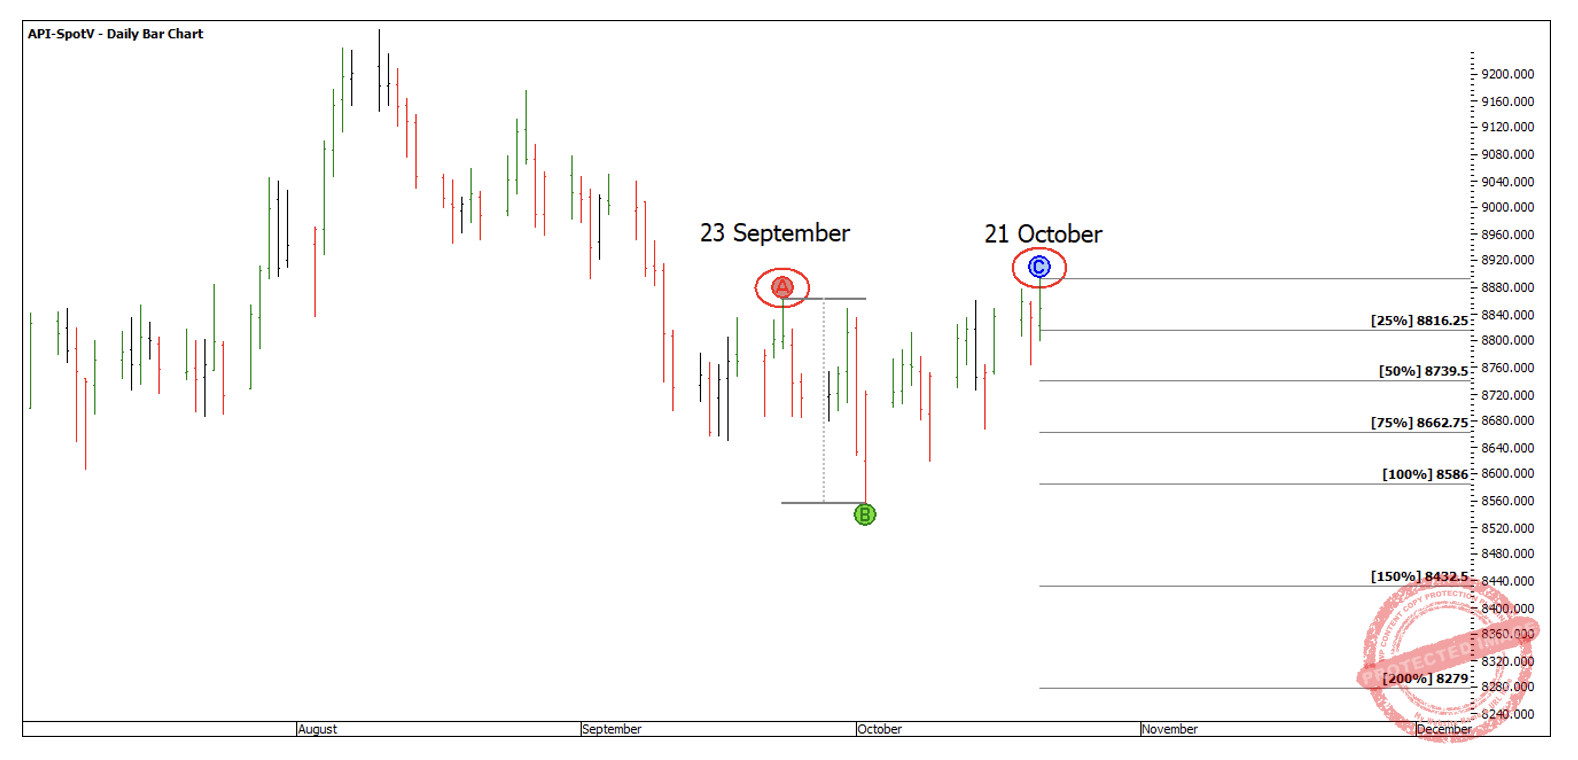
Chart 3
Personally, I don’t think this is the case and a couple of reasons being;
- The weekly time swing has overbalanced to the upside with 19 days up so far.
- Increased daily volume from 15 October low onwards.
I find it a great help to run the time swing chart directly below the price swing chart as that way you can easily see at a glance what the time and price swings are doing at any one time on any time frame. See the red swing chart in Chart 4 below.
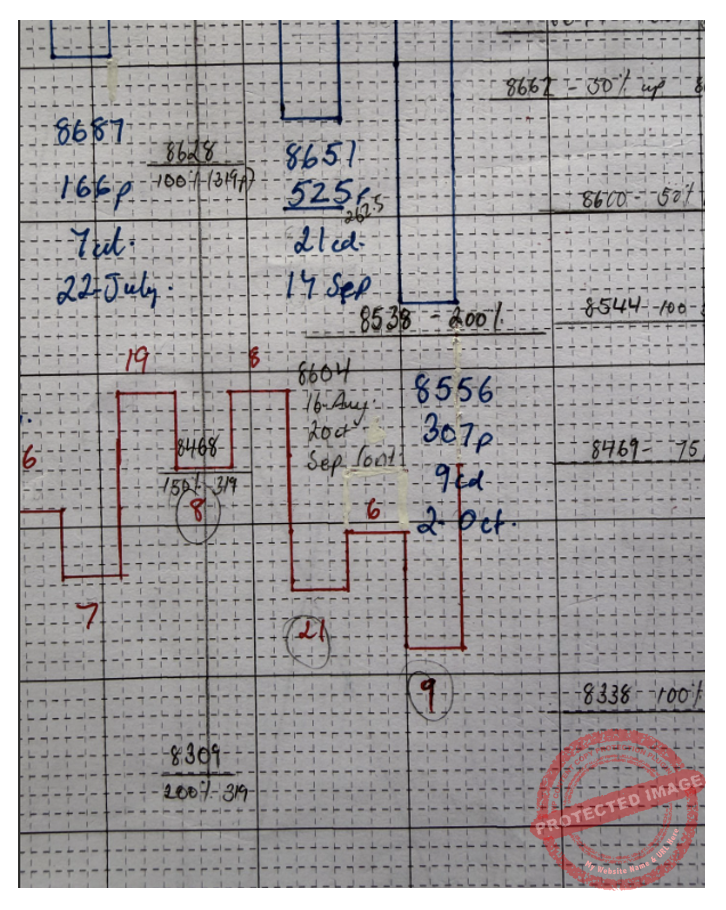
Chart 4
Recently I decided to create and keep a 1-hour hand drawn bar chart of the SPI200 to gain a better understanding about 1-hour volume. Very quickly this chart has proven to be worth its weight in gold. I’ve been able to apply squares I thought too small to use on today’s market. Squares like 144 and 256.
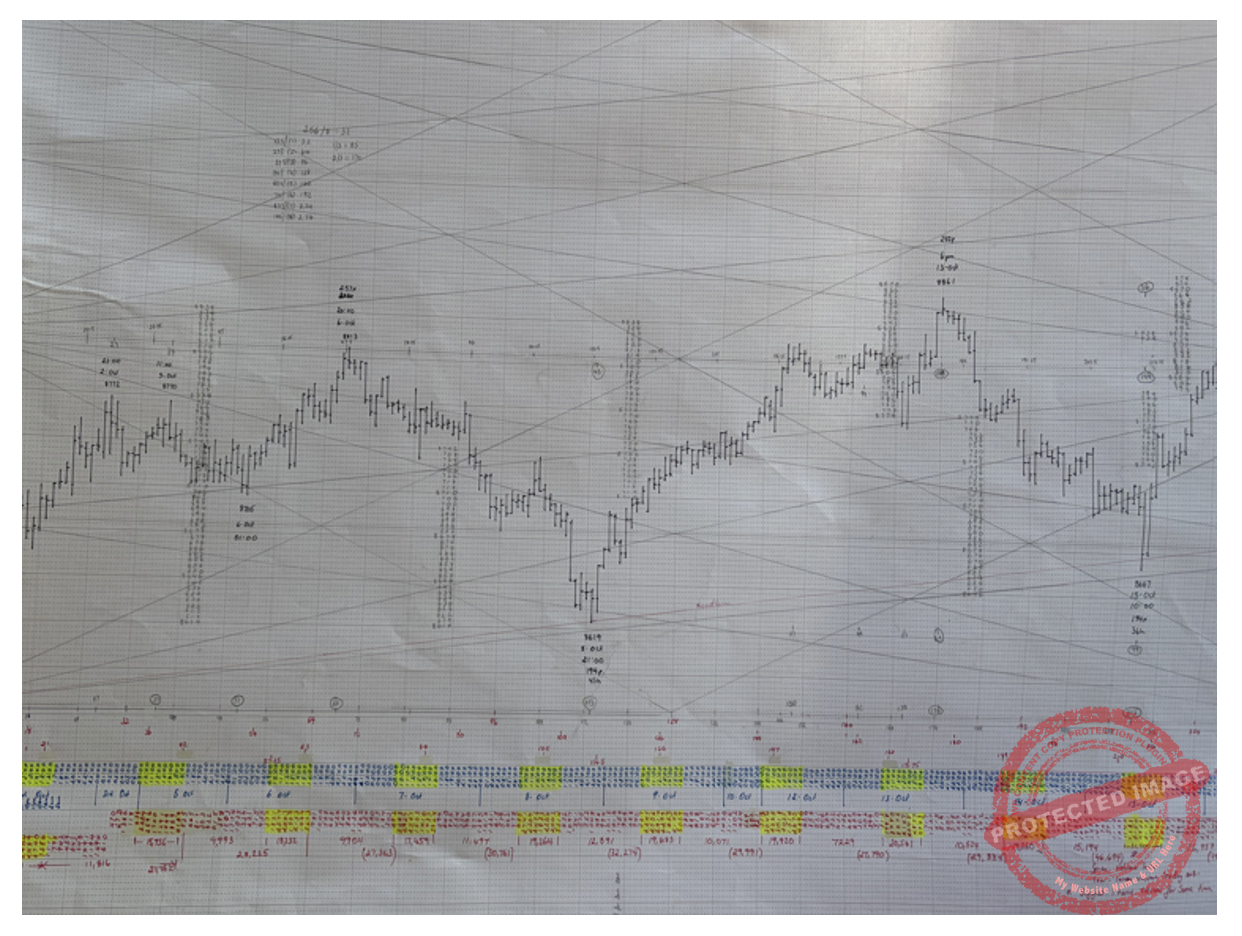
Chart 5
For instance, the daily First Range Out from the 2 October low was 257 points. If you square that range out in hours it gives 1pm Thursday 22 October. Today’s low (Thursday 22 October) has come in at 8781 at 12pm, 256 hours later.
Two intraday time frames balanced out at exactly 12pm, all the while landing on near exact (within 3 points) 100% repeating range.
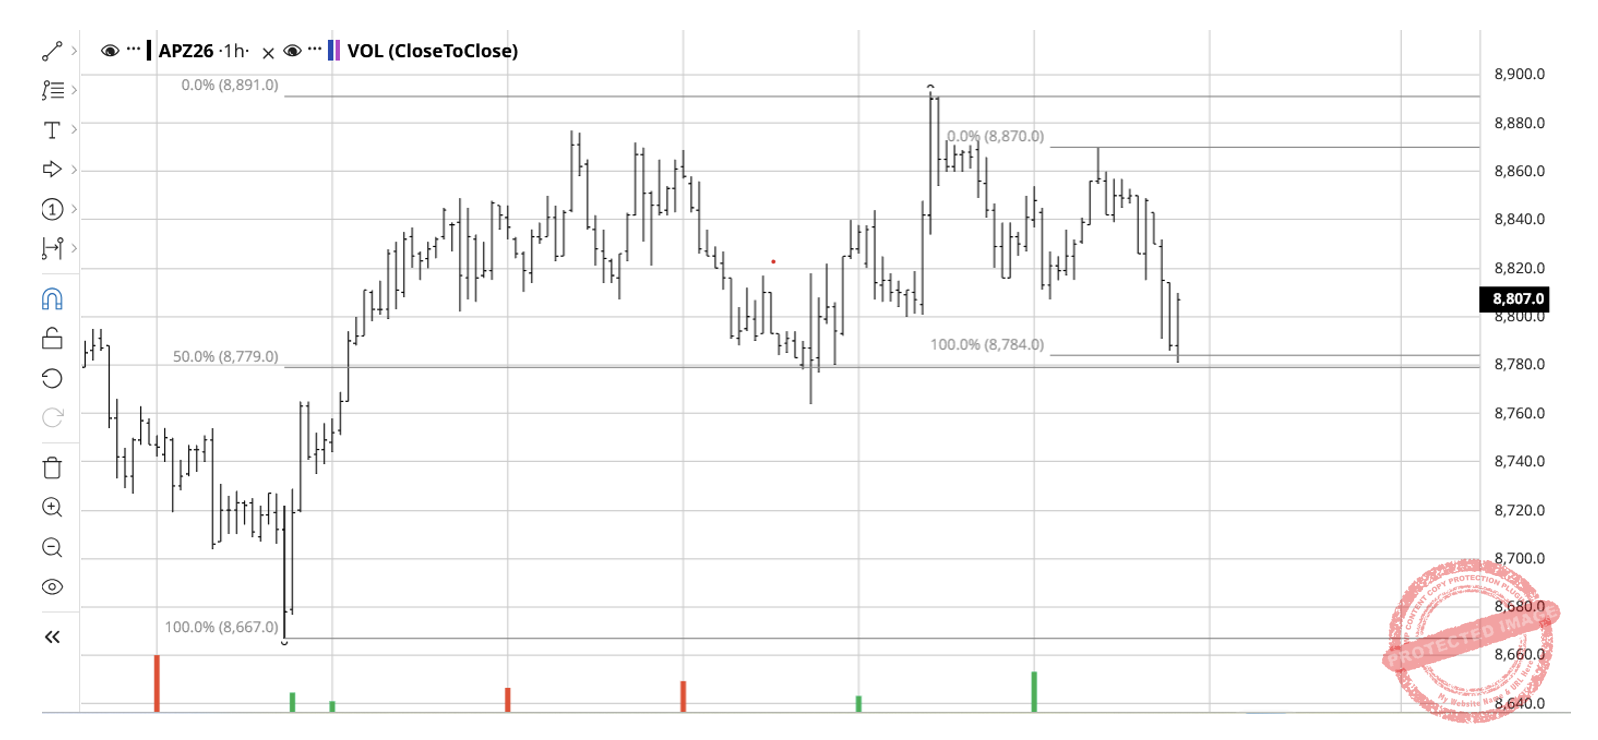
Chart 6
Of course, this low of 8781 could always be taken out but the key messages are;
- What you do on the daily, weekly and monthly charts you can also do on an hourly chart.
- Having these kinds of hand charts will only help you identify these key points in advance.
Happy Trading,
Gus