Apple Inc.
This month, let’s explore Apple Inc…
It is always fascinating dissecting the biggest companies in the world and seeing the Gann Methodology effectively functioning. Safety in the Market students who have studied the Ultimate Gann Course are conditioned to watch for set up patterns and to investigate any opportunity that may present itself. David Bowden often mentioned that once you have your trading plan sorted, you want to spend the majority of your time looking for trading opportunities, not necessarily rejigging your trading plan. While there is a time and place for that, the objective of trading is to make a profit.
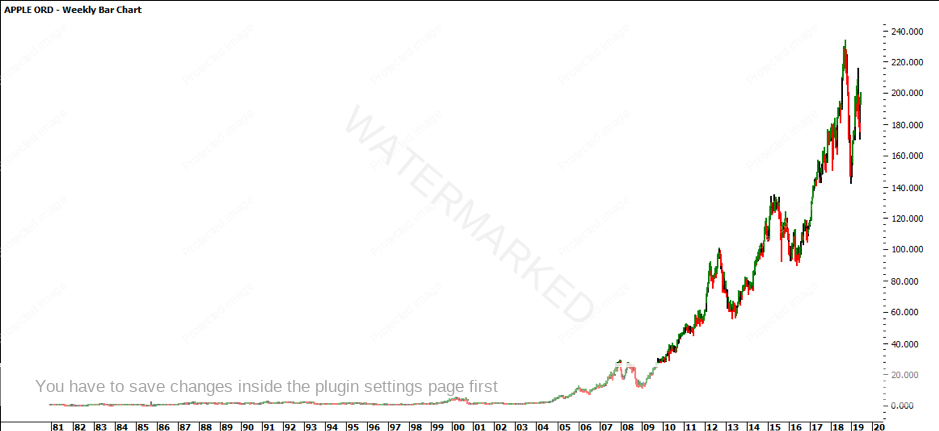
This month we will explore Apple Inc.’s (NASDAQ: AAPL) position in the market, predominately focusing on price action from 2008 to present. The market has many prior years of history, as it was first listed on the stock market on 12 December 1980. This article will focus on the more recent sections of the price action. The chart below explains why…
(As a side note, Apple Inc has undergone a number of stock splits in its lifetime.)
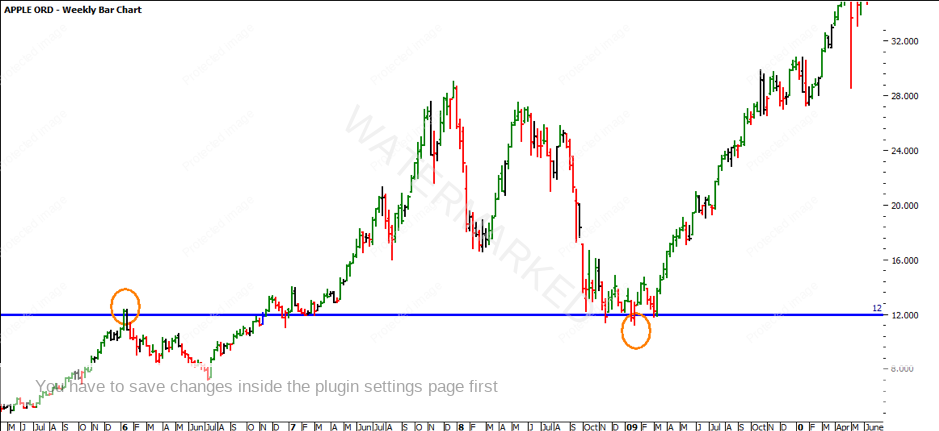
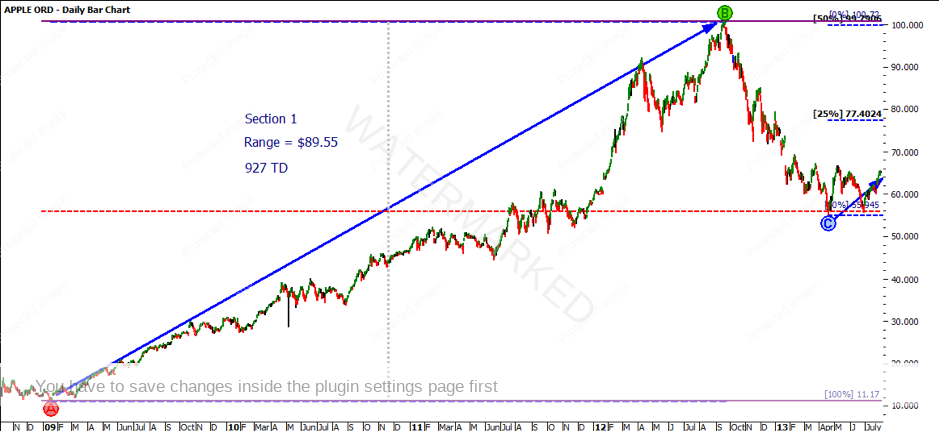
Looking back at 2009, the low was in January at $11.17, clustering with October 2018, November 2018 and March 2019 lows around $12.00. The market fell as the Global Financial Crisis (GFC) hit; Apple found support on the old January 2006 high at the $12.00 mark.
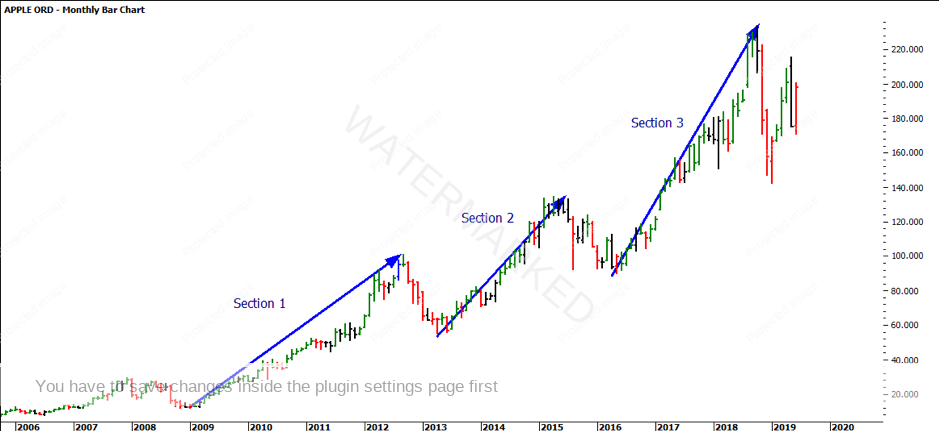
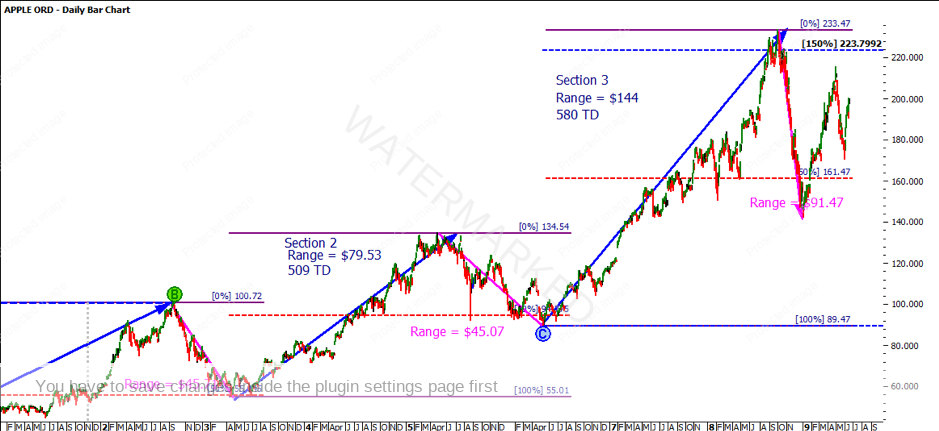
Assuming the January 2009 low is the bigger picture Point A, we can look to explore the great bull run that followed. As a basis of looking at the bigger picture, there are three obvious sections since the 2009 low as per the chart below.
Section one produced a range of $89.55 – relatively close to the prime number 90, which you would be aware of since it is a common number we use to break down the circle (90 degrees). It achieved this range in 927 trading days (TD) which is close to 10 multiples of 90 (927/90 = 10.3).
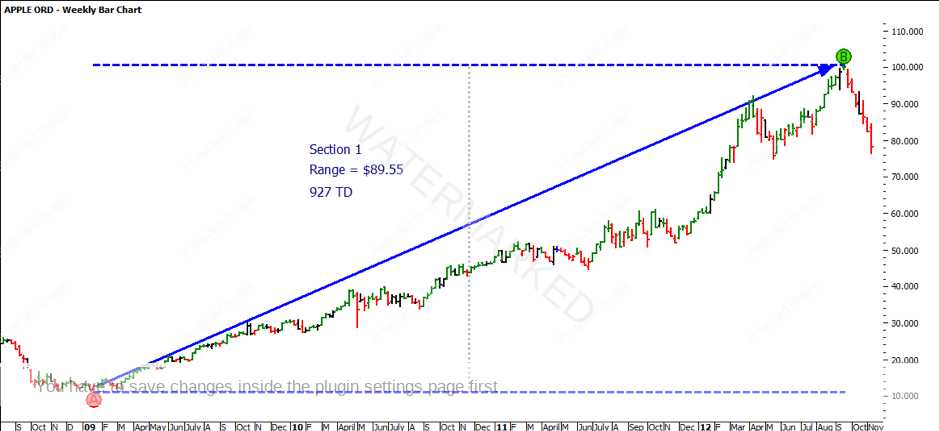
The range of section one was $89.55 and the halfway point between the January 2009 low at $11.17 and the September top at $100.71 is $55.94. The market retraced to $55.01 in April 2013 in 142 TDs.
Projecting the range of section one ($89.55) up from the April 2013 low at $55.01, the market failed to repeat 100%. It produced a range of $79.53 in 509 TD.
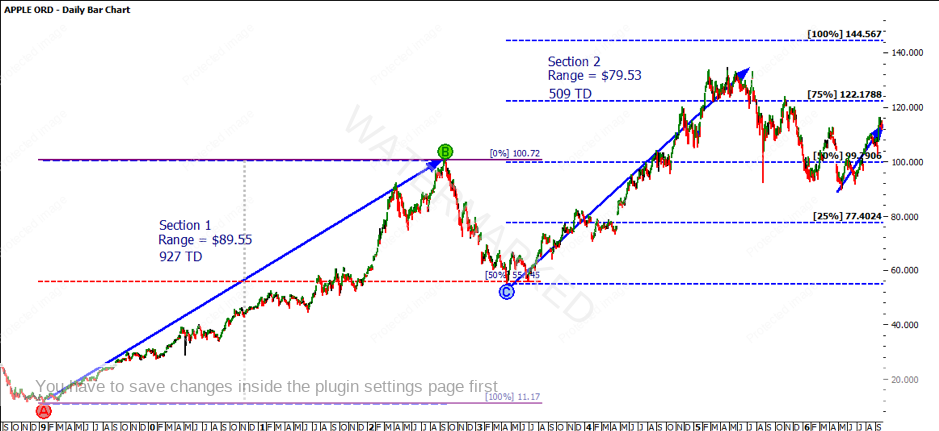
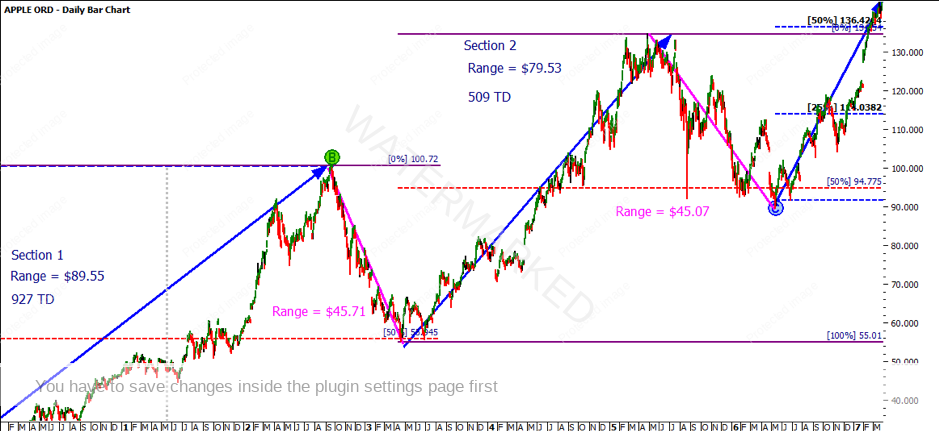
The range of section two was $79.53 and the halfway point between the April 2013 low at $55.01 and the April 2015 top at $134.54 is $94.77. The market retraced to the 50% level three times before forming a solid bottom in May 2016 at $89.47 which was relatively similar to the range of the first section at $89.55.
In addition, the retracement of section one was $45.71 and the retracement of section two was $45.07 – which is within 2% of a 100% repeat.
Repeating this activity again on section three, by projecting the range of section one ($89.55) up from the May 2016 low at $89.47, the market this time exceeded 100% and got close to a 150% repeat. It produced a range of $144.00 in 580 TD which is approximately 4 multiples. Again, having studied the Ultimate Gann Course you will be familiar with the number 144.
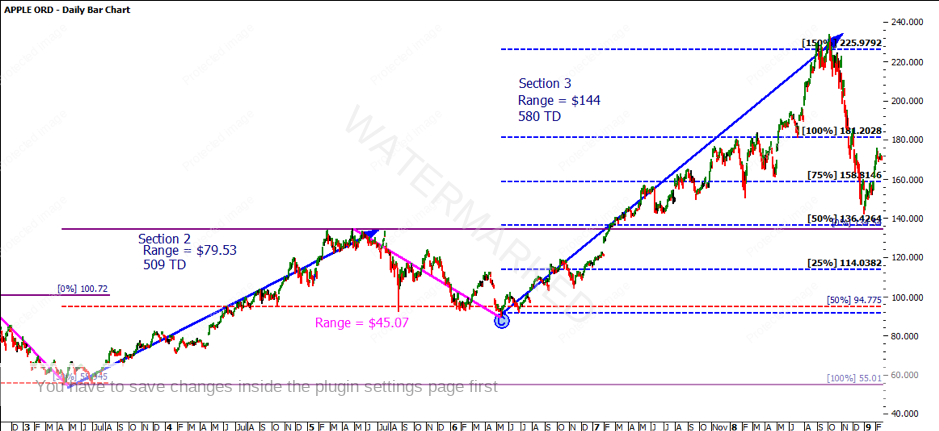
The range of section three was $144 and the halfway point between the May 2016 low at $89.47 and what is currently the all-time high in October 2018 at $233.47 is $161.47. The market exceeded the 50%, however, if you look at the retracement, it was 200% of section one’s retracement of $45.71, producing a range of $91.47 – only 2c out.
I encourage you to apply the same analysis process to the most recent January 2019 low and rate the strength of the market in the next cycle.
It’s your perception,
Robert Steer