Creating a Lows Resistance Card
ProfitSource Chart Re-Creation Exercises – Part Four
This month we continue the exercise of chart re-creation in ProfitSource. Briefly recapping, if you have read the last few Trading Tutors articles, you will know that this activity involves taking a chart you see – anywhere in your Safety in the Market course materials, and using ProfitSource to create your best replica of that chart. This gives you very good practice at applying your drawing tools in ProfitSource and helps with your Price Forecasting. If you haven’t managed to catch up on the last few articles – please do so, they make a worthwhile pre-requisite to this one.
This month we focus on an example of a Lows Resistance Card. We will do this with the Preset Gann Square drawing tool. Below is an example of this tool applied to a chart. It’s a current market example, applied to the Gold futures chart (symbol GC-SpotV in ProfitSource).
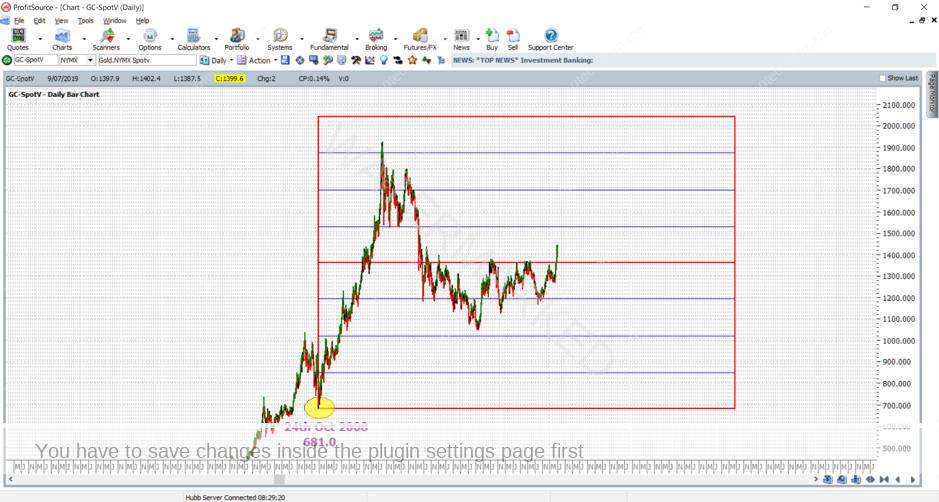
Our goal once more is to re-create the above chart in ProfitSource as closely as we can. Read this article one step at a time, following the instructions directly, applying them in your own ProfitSource installation. Let’s begin:
- Open ProfitSource
- Charts -> New Price Chart -> Enter GC-SpotV and click OK
Now that we have opened the chart, we need to zoom in on the October 2008 low, as this is the low to which we will “anchor” the Lows Resistance Card. There are two ways to do this:
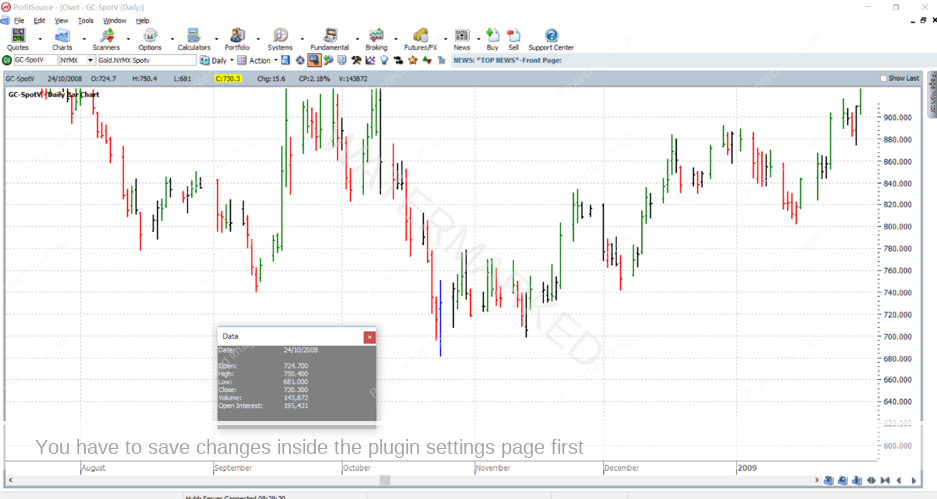
- Repetitively left click and drag on the chart space until the October 2008 low comes into view. This is the simplest, but the longest way. You are looking for 24 October 2008, with a low price of 681.0; and you can confirm your arrival at this low by pressing the F5 key to bring up the Data Window.
- A faster but more advanced way is to do the following:
a. Compress the price scale (left click and drag down on the price axis), then
b. Compress the time scale (left click and drag to the right on the time scale), or hit the F8 key, or use the “bar spacing” buttons in the bottom right hand corner of the screen.
c. Steps a. and b. above can bring most of the market’s price history into view, even as we keep our chart at daily resolution. You will see something similar to the below screenshot.
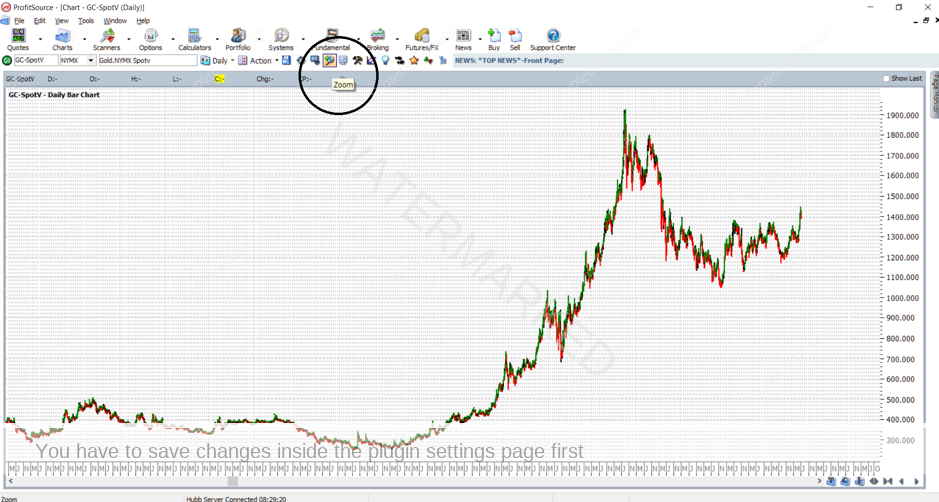
d. Your goal is then of course to zoom in on the October 2008 low – using the zoom tool as located in the screenshot above. Left click and drag to select the area on which you wish to zoom in, as shown below.
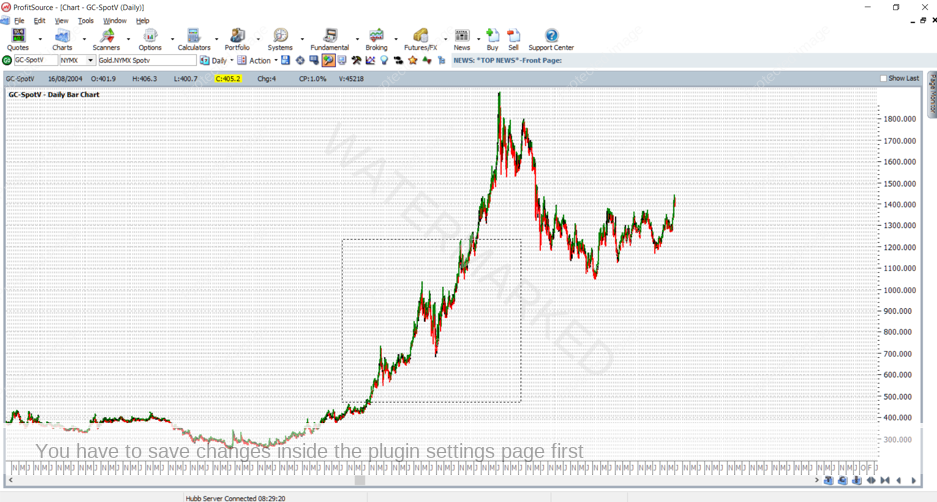
e. Repeat the zooming a few times if necessary. You are looking to focus on 24 October 2008, with a low price of 681.0; hover your mouse over that date, and the Data Window (press the F5 key) will confirm that you are in the right place.
Either way you zoom in, here is the view you are aiming for:
Now that we have the chart ready, it’s time to apply the relevant tool. Click on the Drawing Tools icon to open the Drawing Tools box, then click on the Gann2 tab, and select the Preset Gann Square. Note: you might have to use the small arrows as circled below to navigate to the Gann2 tab.
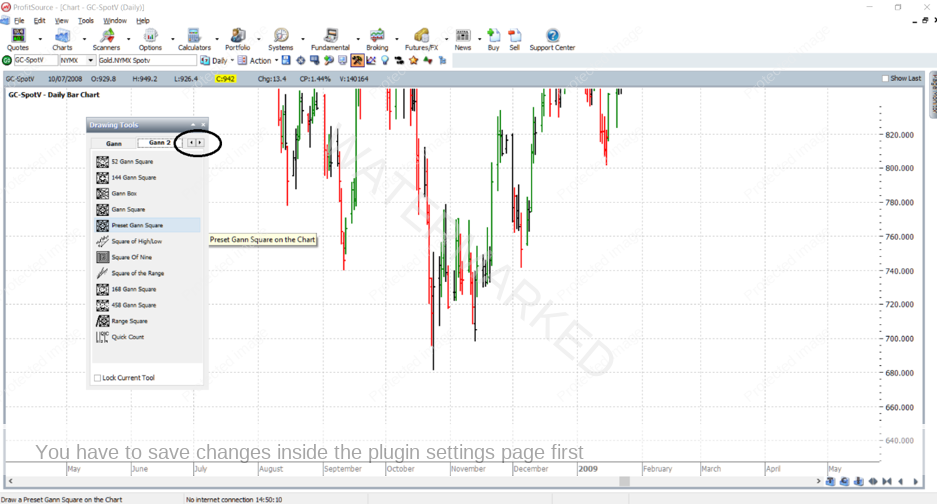
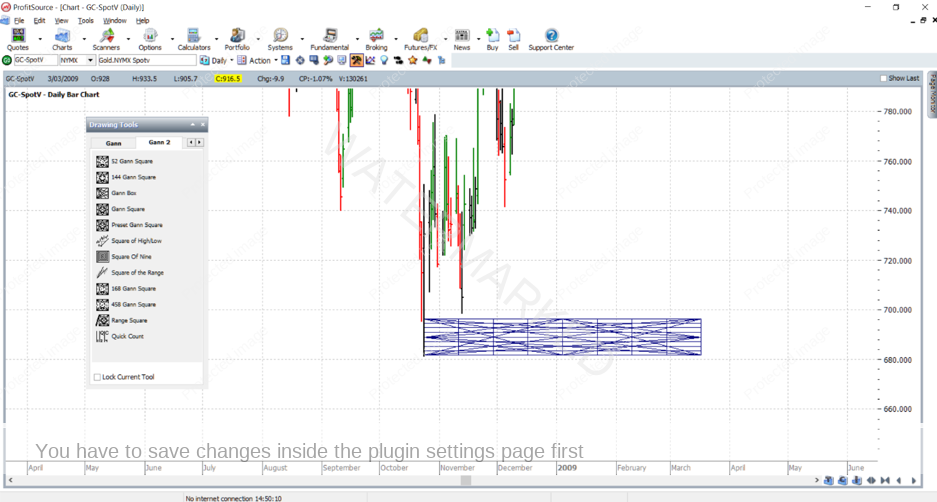
Now apply the Preset Gann Square to the chart with a left mouse click as close as possible to the low itself. Don’t worry if you don’t get it perfectly placed the first go. We will fine tune the parameters in the tool’s properties box. Depending on whether or not you have changed the default setting of this tool, you may now be seeing something similar to the below.
Now to fine tune the settings. Double click anywhere on the Gann Square tool to bring up its Properties Box. Make sure you have the settings as shown below.
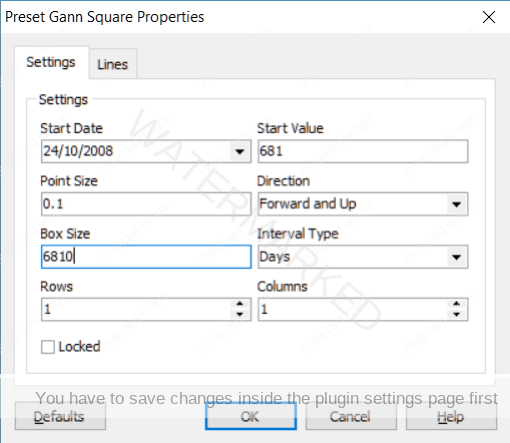
For future reference, if applying a Lows Resistance Card to a different market, you may need to do a little of your own research to make sure you have the correct “Point Size”. Also if in the future you go to calculate your own Box Size, this is calculated by example here:
Box Size = Start Value/Point Size = 681/0.1 = 6810
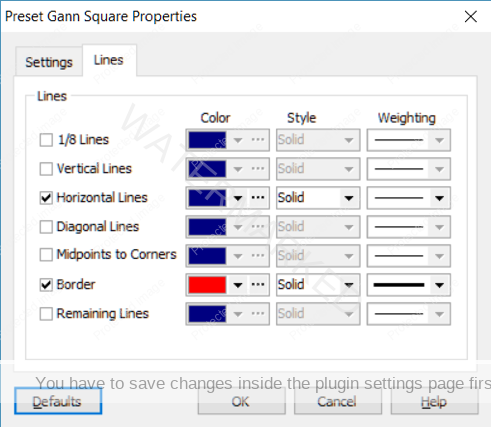
Before clicking OK, go to the “Lines” tab. Here we bring into effect the multiples and fractions of the low which we will project up from the low. To recreate the chart in this example, check or uncheck your lines as below and this will bring into effect 100%, 50% and 25% multiples of the 681 low. Notice the border I have set to a heavily weighted red colour – and this makes the 100% multiples of 681.0 stand out, as they are the most important.
Now click OK, and zoom back out by adjusting the time and price scales. Here is what you are looking for thus far:
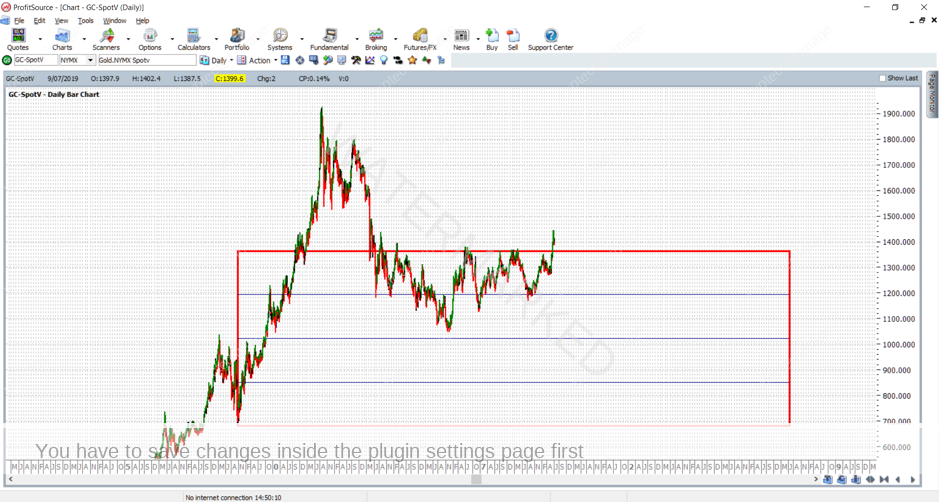
The next thing you will notice is that not all of the market action has been covered by one square – i.e. one multiple of our low. So what we need to do now is go back into the tool’s properties and increase the number of “rows” by one:
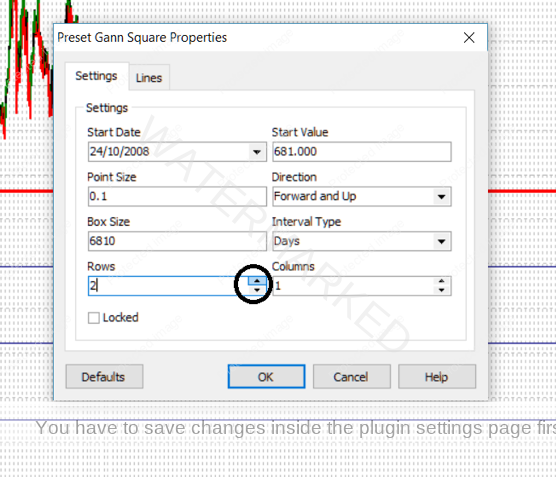
…and click OK. Then you should see our final goal – a nice replica of the chart presented at the beginning of this article.
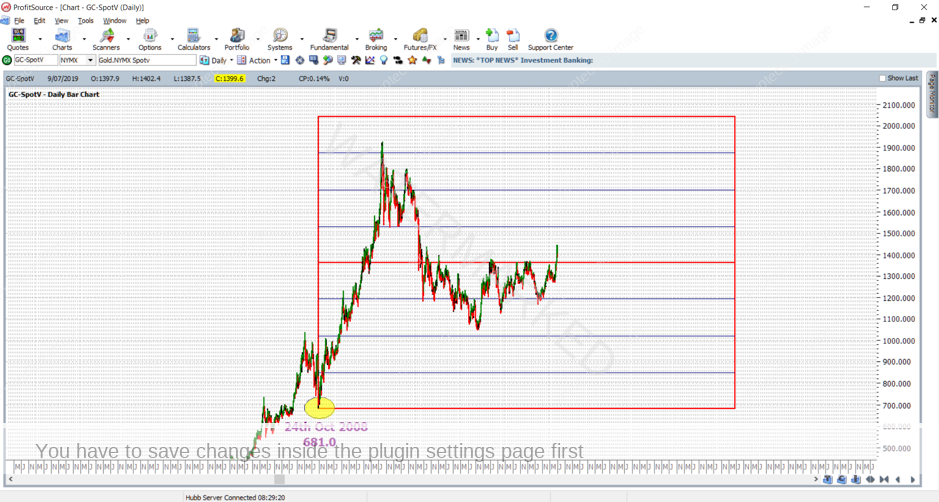
Often on a chart we may wish to label a significant high or low with its date and price. This is done in our chart above already. If you’re not sure of this step – I’ll give you some extra homework – go and research how to do it from our one of the last three Trading Tutors newsletters – this will be a worthwhile exercise!
And as usual for some more homework, take the following steps:
- Save your work in ProfitSource (click on the Disk icon in the toolbar above the chart page OR select Action -> Save Chart Page). This allows us to later re-open a chart should we need to.
- Send a screenshot to us at Trading Tutors
-> Right click on the chart, and select Save As GIF. Save your GIF file in a known folder on your computer, then email it to us.
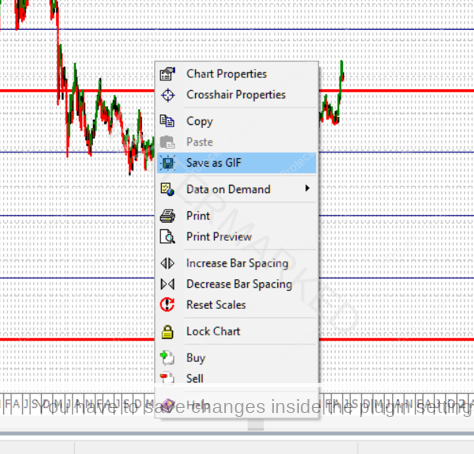
Finally, remember if you encounter any issues along the way, please don’t hesitate to ask!
Work Hard, Work Smart.
Andrew Baraniak