Bigger Picture ABC’s
How can you apply an ABC to explore the bigger picture target zones?
The ABC Trading Plan can be applied to both the minor and major trend. To trade using the ABC method of trading you must first learn to find the ABC patterns on your swing charts. While this month’s article isn’t directly about an ABC trade, it is about how you can apply an ABC to explore the bigger picture target zones, which means you can apply the same ABC trade concept to the bigger picture set ups that will help identify future support and resistance levels.
David suggested that you place a red dot under a Point A, a green dot above a Point B, and a blue dot under Point C, on both your swing and bar charts. This gives these three important points their due prominence. Obviously in ProfitSource this has been automatically done for you.
If you refer to ABC Trading Theory in your Smarter Starter Pack, you will note that Step 2 and 3 of the ABC Pattern outlines the process of identifying points A,B & C. Just a quick recap, the following is an extract from the Smarter Starter Pack:
Step 2: Identifying Point A & B
These are two successive swings A and B. If the trend is up, label any swing bottom with an A. Swing B will therefore be the next swing top. (For a downward daily trend, label any swing top A. Swing B will be the next swing bottom.)
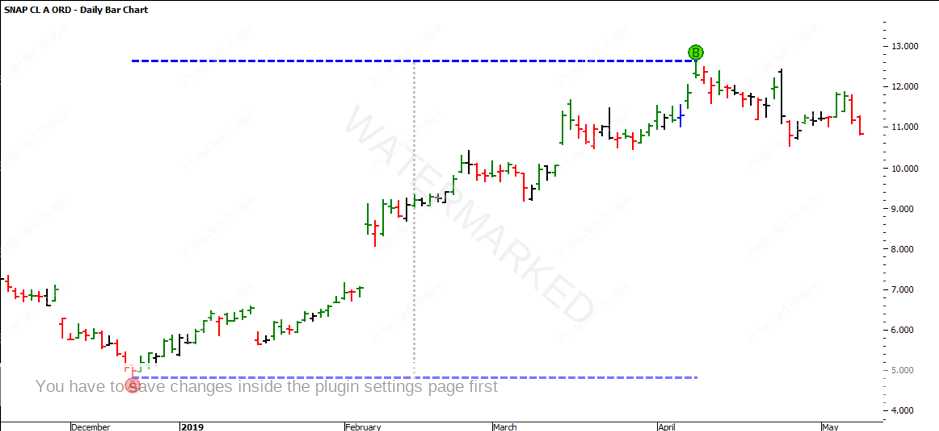
If we take a look at the bigger picture ABC on Snap Inc. a company known for turning down Facebook’s offer to buy them for over a billion dollars (ProfitSource Code: SNAP), you can see in the chart below we have labelled the All Time Low (ATL) on 21 September at $4.82 as Point A. While the next proceeding is in January 2019, I have taken the full range up to April 2019. The high was on 8 April 2019 at $12.63. The benefit of ProfitSource is to allow you to use the ‘ABC Milestone Tool’ to create your own ABC Patterns. In this case we now have an AB reference range of $7.81.

The Smarter Starter Pack goes on to explain Step 3, which involves identifying Point C. This is known as the most important part as Point C becomes our anticipatory trigger point which gets us into the ABC trade. Given you are purely performing analysis, Point C will be the next major bottom.
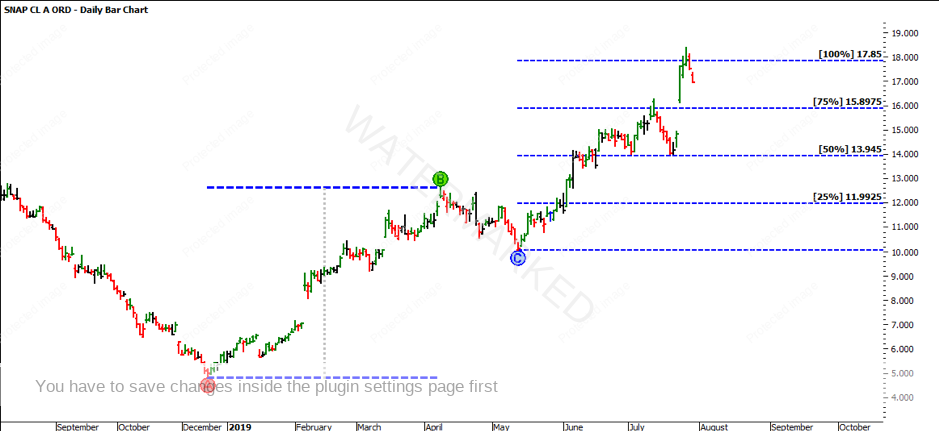
As you can see in the chart below, the Point C was on 13 May 2019 at $10.04. By identifying Point C, we can now project the AB reference range of $7.81 from the low at $10.04. This gives us a 100% target at $17.88. The market was able to hit and slightly exceed the 100% milestone and ever since, reacted off this level.

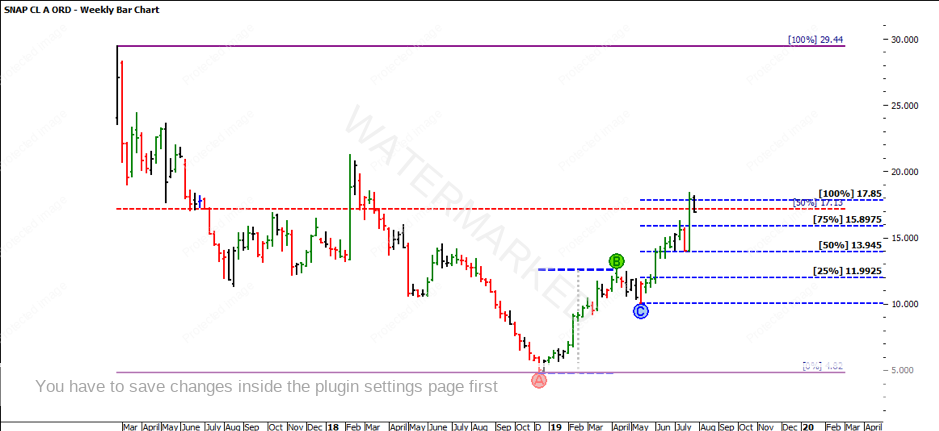
The expertise comes when you can line up additional Gann analysis with this level to identify it as a high probably target. If you apply a Ranges Resistance Card from the All Time High (ATH) at $29.44 and All Time Low (ATL) at $4.82, this gives you a range of $24.62. The 50% level of this range is $17.13. This is a price cluster with our ABC 100% milestone pressure point at $17.88. Assuming you were trading into this high you’d be watching for a potential change in trend.

It’s Your Perception,
Robert Steer