An ABC Trading Example
One of the key lessons in the Active Trader Program is the ABC paper trading exercises… have you done them? Today we’ll be taking you through another example using Cocoa.
For those studying the Active Trader Program, one of the important exercises of this course is the ABC paper trading exercise. This exercise is done using historical data from three markets. BHP, the Euro, and the S&P 500 stock index futures contract. The exercise is a vital part of your foundation when it comes to the Safety in the Market trading methodologies, and the exercise commences on page 161 of the Smarter Starter Pack Manual. The exercise is to be done by hand using Safety in the Market charting paper. Its main pre-requisite is an understanding of swing chart construction rules, including the handling of inside days and outside days on the bar chart. From this we build our system that determines the direction of the trend. The exercise takes us, in depth, through the concept of our ABC trade entry parameters, ABC milestones, trade management, and trade exit parameters.
Now as you do these exercises, you might be wondering if you can do the same, and get all of the parameters correct, for a current market example… so in this article, that’s what I will do. ProfitSource will be used in Walk Thru mode to help with the illustration of the example.
This time the trade is for the Cocoa futures market – chart symbol CO-SpotV in ProfitSource. The trade occurred in July of this year, and once entered the trade will be managed with the “Currency” style of ABC trade management. Usually when we refer to a particular ABC trade, in a minimal sense we can do so by stating its Point C date. In this case though, I will be thorough (as in your Smarter Starter Pack exercises), and refer to this trade by stating the date and price of its points A, B and C:
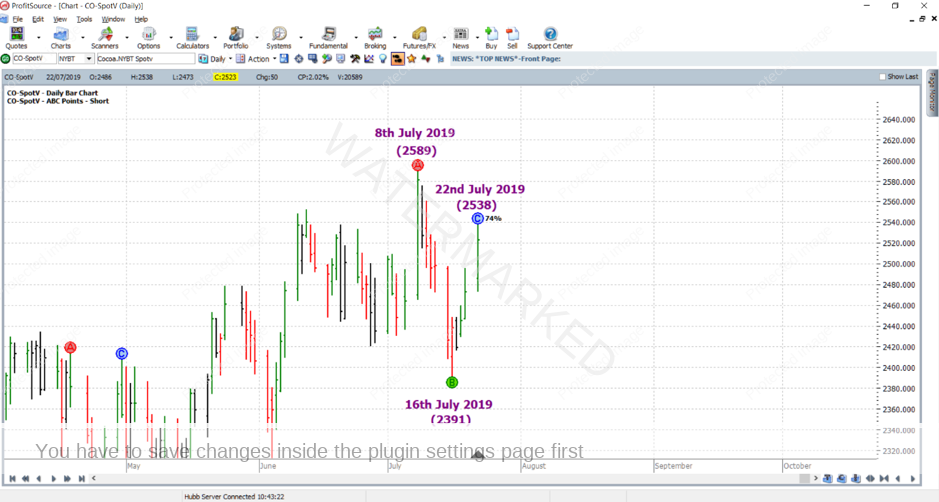
Point A at 2,589 8th July 2019
Point B at 2,391 16th July 2019
Point C at 2,538 22nd July 2019
This trade, prior to its entry, is shown in the chart below, using Walk Thru mode:
The first thing we do of course is calculate the AB reference range:
A – B = 2,589 – 2,391 = 198 points
Then we divide this reference range into quarters, thirds and halves. While we’re at it, let’s also work out 75% of the reference range.
25% of 198 = 49.5 points
33% of 198 = 66 points
50% of 198 = 99 points
75% of 198 = 148.5 points
And this is done in order to determine the milestones of the trade:
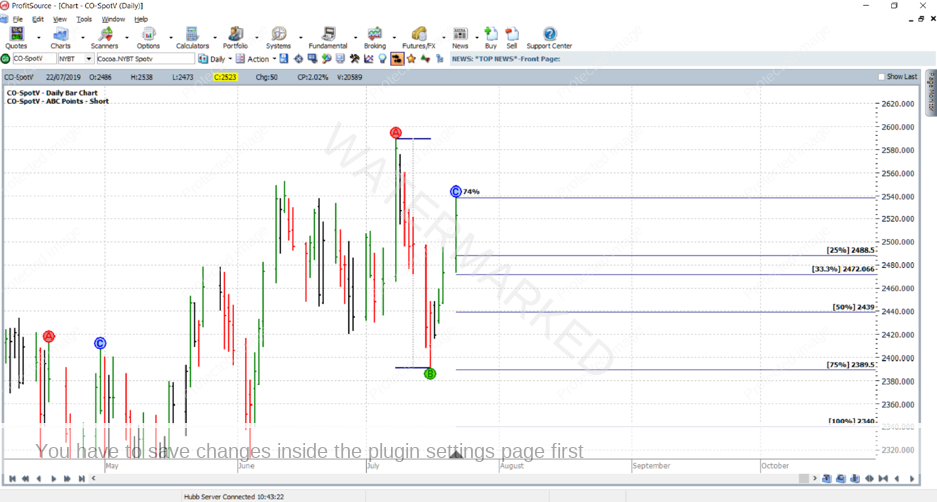
25% milestone = Point C – 25% of the AB range = 2538 – 49.5 = 2,488 (rounded down)
33% milestone = Point C – 33% of the AB range = 2538 – 66 = 2,472
50% milestone = Point C – 50% of the AB range = 2538 – 99 = 2,439
75% milestone = Point C – 75% of the AB range = 2538 – 148.4 = 2,390 (rounded up)
100% milestone = Point C – 100% of the AB range = 2538 – 198 = 2,340
The chart below shows how the ABC tool in ProfitSource can be used to validate our calculations thus far (having right clicked on any of the points A, B or C and selected “Draw ABC Pressure Points”).
Now what about the entry parameters?
Entry at 2472 (placed on 23 July 2019) = low of Point C – 1 point = 2473 – 1 point. Note also that this is right on the 33% milestone.
Initial Stop loss (placed on 23 July 2019) at 2539 = high of Point C + 1 point.
Target 100% milestone = 2340
Estimated Point C = (Point A + Point B)/2 = (2589 + 2391)/2 = 2490
So how did this one pan out…?
As can be seen by progressing through with Walk Thru mode (using the buttons in the bottom left hand corner of the chart) for a few extra trading days, entry was achieved on 23 July, and then two days later the market made it to the 50% milestone, at which point we would move our stops to Entry minus commission.
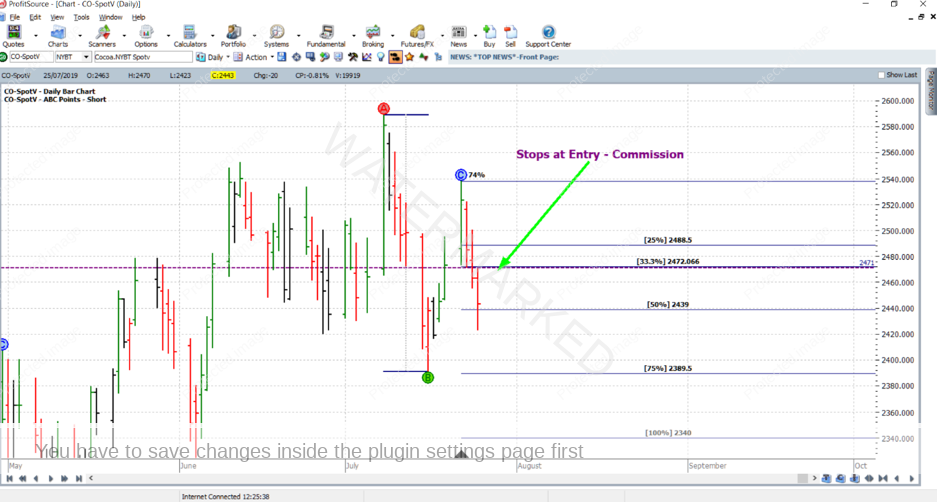
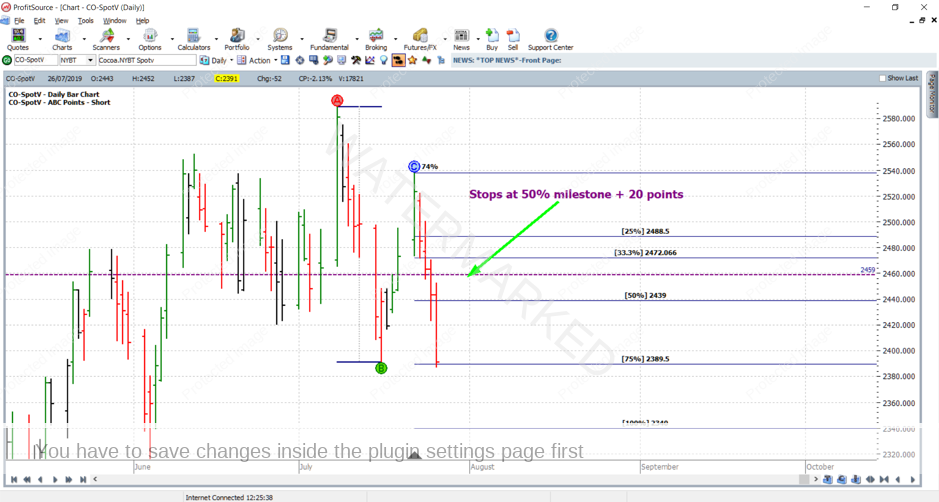
Then progressing one further day on with Walk Thru mode we can see that the 75% milestone was reached. See the chart below. At this point we will move stops to one-third of the average daily range (in this case I have used approximately one-third of the average range of the last 60 daily trading bars), which is 20 points, above the 50% milestone.
This will be 2,439 (the 50% milestone) + 20 points = 2,459
This will lock in some profit, as our trade has reached the next milestone.
As for the remaining time in the trade, moving forward in Walk Thru mode to 31 July 2019 shows that the 100% milestone was reached, and the trade closed:
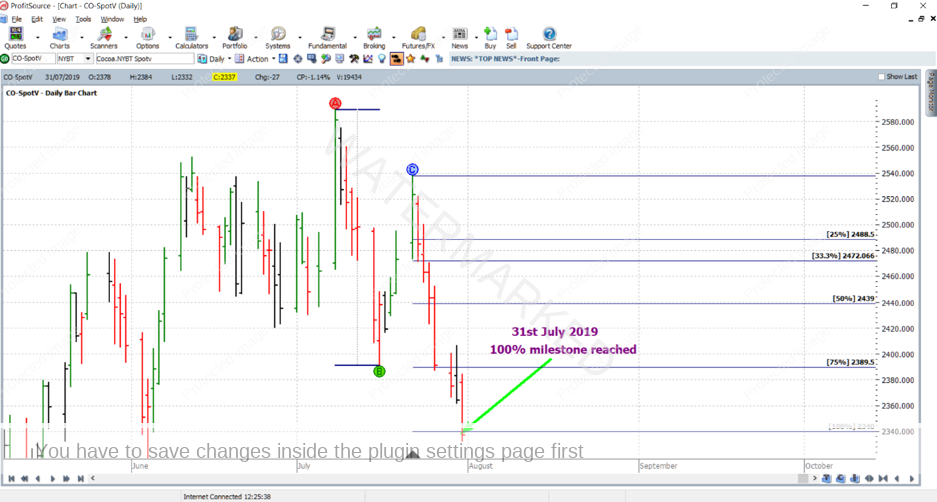
Here are the profit calculations:
Entry = 2472
Exit = 2340
Profit = 132 points (132 x $10USD = $1,320USD)
Cocoa futures can be traded through the Intercontinental Exchange (the “ICE”), 4.45AM to 1.30PM New York Time. Each point of price movement changes the value of one contract by $10 USD. The current initial margin is $2,090 USD, and currently the December 2019 contract is trading at the highest volume. For those still wishing to access this market with much lower margin, it can be traded using CFDs.
Hopefully you have found this a useful article. For some it would have confirmed what they already know. For others it may reveal that there is still some work from the Smarter Starter Pack to go back and do, if not revise. For others there may be some inspiration for back testing on another market.
Work hard, work smart!
Andrew Baraniak