Weekly Higher Bottom
Part three of our Tesla case study…
In the July 2019 Safety in the Market Newsletter, we explored the pivotal 50% level and potential to trade with trailing stops on Tesla Motors (TSLA). In August 2019 we reviewed how to take advantage of bigger picture ABC’s. This month we will combine the two concepts, both the bigger picture ABC as well as potential trading opportunities that may eventuate. The focus of this article is on the combination of the concepts in order to integrate trading analysis and trade management.
When it comes to ‘bigger picture’ set ups, we are generally identifying the position of the market on the major charts (weekly or monthly charts). These are the charts where all the analysis can be done. Then, when looking to take a trade, we can zoom into the daily chart to identify an entry point and take a position reducing our risk calculations.
Turning to TSLA, based on purely form reading, you can see that the first range out of the target zone has exceeded all the retracements since December 2018. The market had found support on old yearly lows and the all-time high 50% level (refer to July 2019 general article), which leads one to believe that there has been an overbalance in price and potential for a higher bottom forming. Gann tells us in his lessons that the first higher bottom was the safest place to buy.
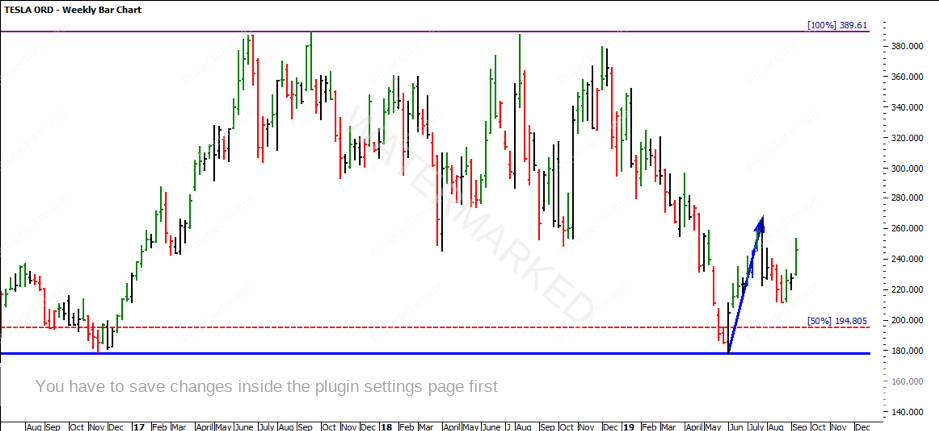
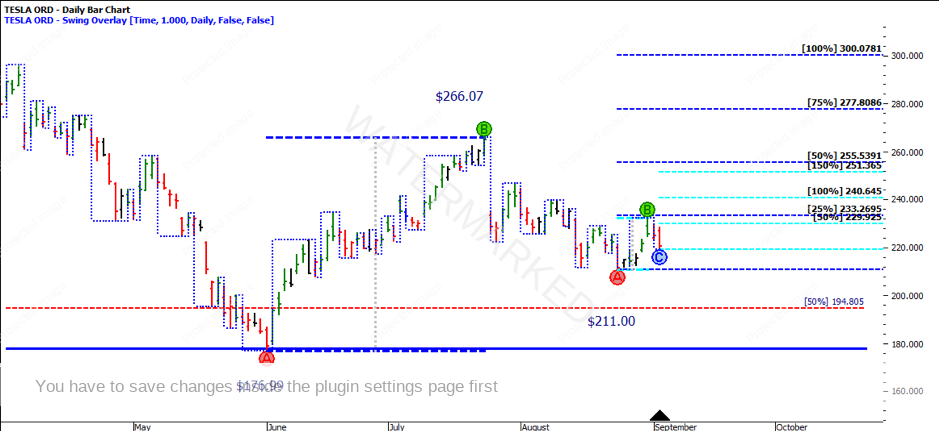
Breaking down the weekly chart into a bigger picture ABC, Point A is the June 2019 low at $176.99. Point B is July 2019 high at $266.07 and Point C is the August 2019 low at $211.00. The AB range is $89.07, which gives a target 100% milestone at $300.07.
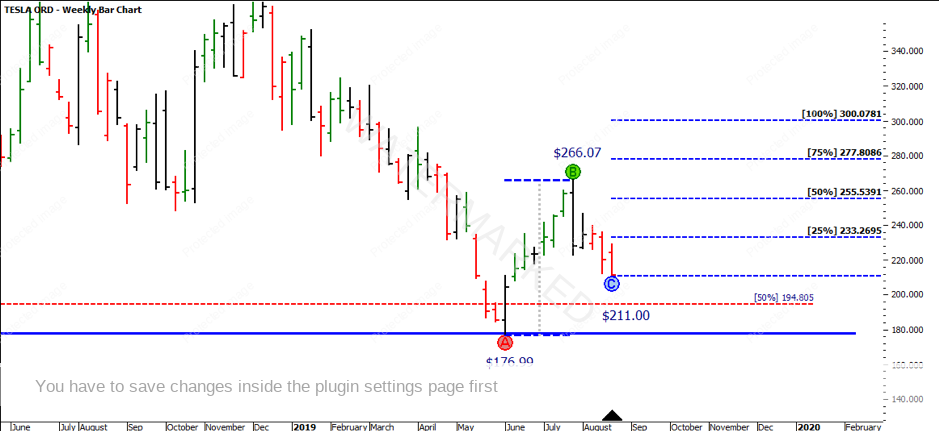
As we are looking at the weekly chart, you would be able to get into the market prior to 25% being hit, however the risk per share would be over $23. Therefore, if we zoom into the daily chart to find a smaller entry risk, it will highly reduce the overall risk per share.
Zooming into the daily chart you can see a minor double bottom occurred at 15 August and 23 August. This would have been a highly aggressive entry, so waiting for confirmation would have given you more confidence. On 30 August the market confirmed the major ABC, so waiting for the first higher swing bottom on the daily chart would have provided the confidence needed to enter.
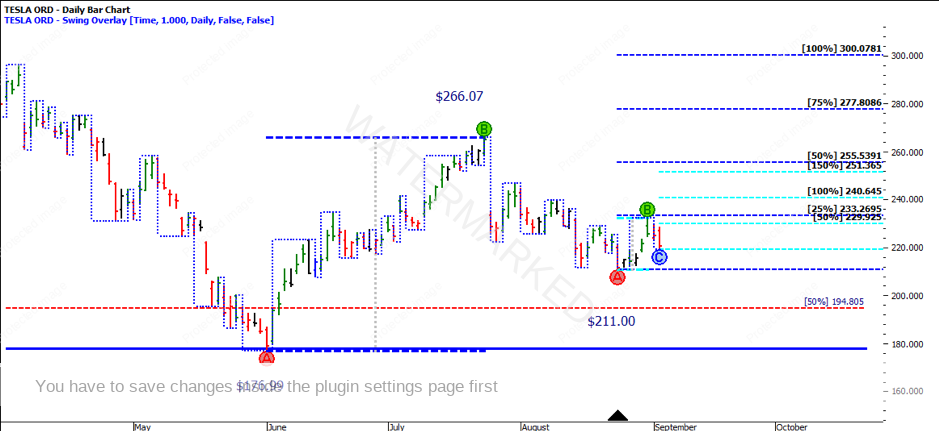
The first higher swing bottom on the daily chart would have been outside the normal ABC trading parameters. In saying so, you could still use the reference range of the AB which is $21.44 and projected a 2:1 reward to risk ratio as an exit point. Alternatively, as the July 2019 article outlined, there might be opportunities to explore a trailing swing bottom trade management strategy, or even a split position.
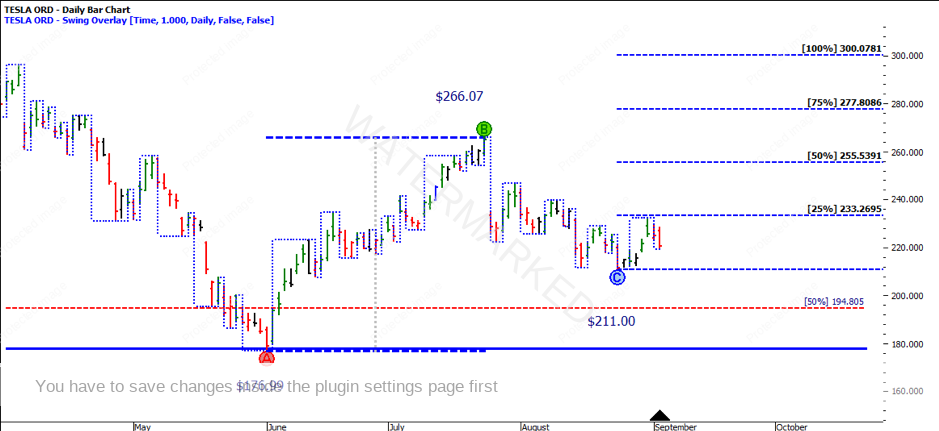
The first higher swing bottom on the daily chart would have provided a risk calculation of $11.71 ($229.92 – $218.21 – note that I have allowed $1.00 under Point C). By zooming into the daily chart, you have essentially halved your risk but increased the likelihood of being stopped out. This makes you ask yourself, is this set up a highly probability set up? and are you confident? If you are, then you place the order.
As the market unfolded, you would have been filled at the confirmation of the daily higher swing bottom. The market moved to hit the 2:1 reward to risk target at $251.36 which was the 150% milestone. It also just fell shy of the 50% major milestone at $255.53.
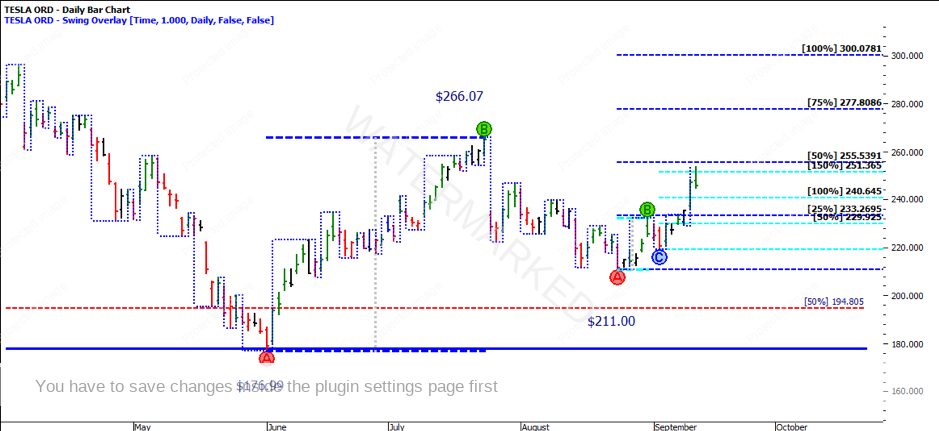
We have currently seen expanding swing ranges. We will be waiting for the potential pullback to confirm the strength of the market which will determine what the next move might be. Assuming you were still in the trade, you’d need a higher swing bottom, so stops can be moved behind the swing bottom.
It’s Your Perception
Robert Steer