Step Back and Listen
Take some time out to stop and ‘listen’ to the market…
Welcome to what will be my second last article for 2019. I am sure I have said this for the last 20 years I have been around markets, but “where did the year go?”. When you see Christmas decorations in the shops in early November its hard not to shy away from the inevitable fate that the year is ending. The cycles we see in everyday life are “speeding up” and markets are no different.
The media landscape is dominated by the topic that will generate the most clicks, and to anyone who has been affected by the fires across Australia in recent weeks, I hope that things are improving for you. We see the impeachment process in the US dominating the headlines and this is probably disguising the underlying issues that the world economy faces and the same in Australia, where the economic numbers are becoming weaker, but we have a stock market that keeps hanging in on the upside.
If we step back and “listen” to the markets metaphorically we see that for all the naysayers, the crash hasn’t arrived. Of course, we have seen volatility increase and this is something we should expect will continue. These days I have a foot in each camp in terms of my day job, as I see the decisions behind how super funds invest their vast sums of cash. The greatest challenge is that no one is prepared to accept negative or zero return overall, so in most cases, the need to invest in equity markets is seen as the lesser of all the evils of investment markets. I am not suggesting that this is the best way or that it won’t eventually end in tears. This can explain to some extent that whilst interest rates remain so low (and likely heading lower in Australia), why equity markets keep rising based on money flows and asset allocation.
Cash must find a home and, in most cases, leaving it under the mattress isn’t going to get it done for the masses. All one needs to do is look at some of the tech stocks on the Nasdaq to see the massive cash reserves they are sitting on to see how much reserve funds the market has. This is not surprising given the multi-year printing exercise the US Fed went through.
Given we are close to year end, the market phenomenon of a Christmas rally is always one I start to plan for. There are multiple articles over the years written by the team here at Safety in the Market to reference for a back story. To get a rally this would typically occur during December, but to get a rally we typically need a decline first. It’s also worthwhile to note we do on occasion see a decline; all I am looking for is movement.
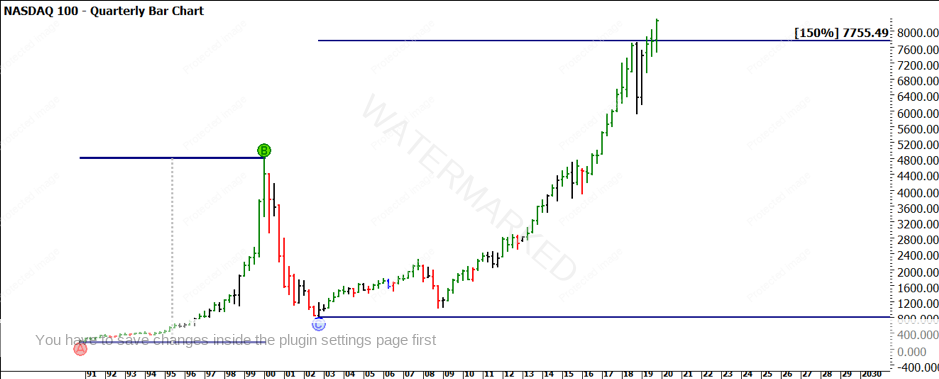
Chart 1 shows the Nasdaq Index in the US and its recent performance to higher prices. The price action has pushed above 8,000 points for the first time and in the last 10 years has been one of the standout indexes in terms of performance.
The 8,000 level could be one to watch if we do see a decline anytime before year end, as it could act as support for a potential rally to start from. We can also see, using milestone theory, that the major range from the birth of contract to the 2000 (tech wreck) high back down to the GFC low shows prices are trading above the 150% level.

Chart 1 – Quarterly Bar Chart NDX
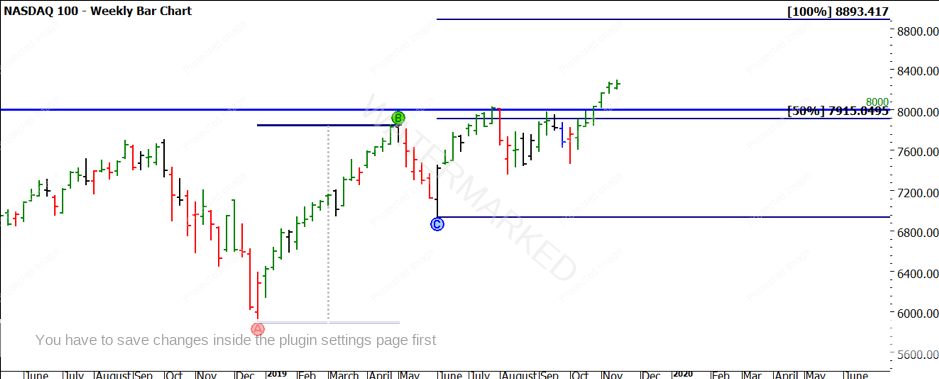
Chart 2 zooms into the more recent past with repeating ranges projecting 100% of the major bullish range of recent times, suggesting that prices closer to 8,900 could well be possible in the future. The 8,000-point level did initially act as resistance but has now been cleared. The 50% level of that range is also in the rear-view mirror.

Chart 2 – Weekly Bar Chart NDX
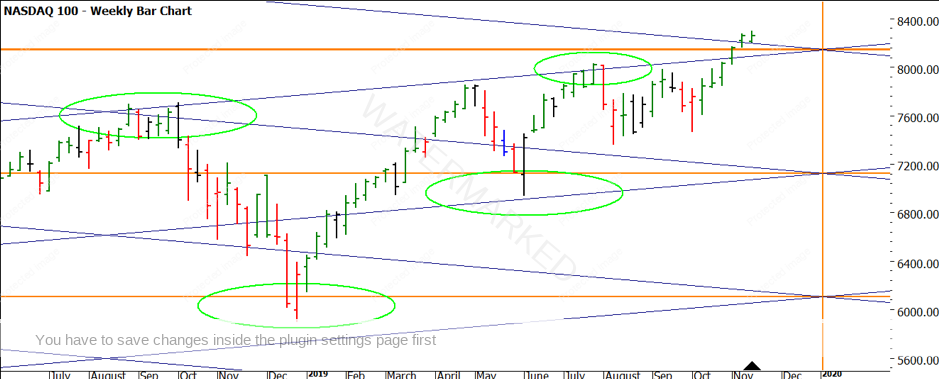
Continuing from the big picture to the small, we can see the same range projection technique supporting the strength of this recent move. There have been no red bars on the weekly chart in this move, suggesting some consistent upward momentum. In the case of Chart 3, the 150% level may come into play as David talks about that being a place to watch for a potential Point A.

Chart 3 – Weekly Bar Chart NDX
The final chart to consider is again a price technique of Lows Resistance Cards. I have selected the GFC low of 1,018 in 2008 (prices above 8,000 show how far this index has moved in 10 years)
Chart 4 uses multiples of the low, it has acted as good support and resistance on percentages of price and when used as a square. As we have broken through 8 multiples of the low in price, we could now see that level become support if we do see a decline.

Chart 4 – Weekly Bar Chart NDX
The end of year is often a time for rest and renewal and I am all for taking a break from trading, however, there is a good chance there will be some tradeable moves in the coming weeks so stay focused and ignore the media and noise markets like to generate.
Good Trading
Aaron Lynch